PARAMETRIC OPTIMIZATION OF ABRASIVE WATER JET
MACHINING USING TAGUCHI METHODOLOGY
Leeladhar Nagdeve*
Vedansh Chaturvedi**
Jyoti Vimal**
ABSTRACT
In this research paper, Taguchi method is applied to find optimum process parameters for Abrasive Water Jet Machining (AWJM). Abrasive water jet machining is a non conventional machining process in which removal of material takes place by impact erosion of high pressure ( 1500-4000 bar), high velocity of water and entrained high velocity of grit abrasives on a work piece. The objective of experimental investigation is to conduct research of machining parameters impact on MRR and SR of work piece of Al 7075. The approach was based on Taguchi’s method, analysis of variance and signal to noise ratio (SN Ratio) to optimize the Abrasive Water Jet Machining process parameters for effective machining and to predict the optimal choice for each AWJM parameter such as Traverse speed, Abrasive flow rate, Standoff distance and Abrasive grit size. There is L9 orthogonal array used by varying S, R, H, D respectively and for each combination we have conducted three experiments and with the help of Signal to Noise ratio we find out the optimum results for AWJM. It was confirmed that determined optimal combination of AWJM process parameters satisfy the real need for machining of Al 7075 in actual practice.
Keywords: Abrasive Water Jet Machine (AWJM), Taguchi’ method, ANOVA, SN Ratio, MRR,
SR.
*Research Scholar
**Assistant Professor, Department of Mechanical Engineering Madhav Institute of
1. INTRODUCTION
As an advanced manufacturing technology, abrasive water jet machining processes (AWJM)
is being increasingly used in various industries. Abrasive water jet machining makes use of
the principles of both abrasive jet machining and water jet machining. In abrasive water jet
machining a small stream of fine grained abrasive particles is mixed in suitable proportion,
which in forced on a work piece surface through a nozzle material removal occurs due to
erosion caused by the impact of abrasive particles on the work surface. AWJM is being used
in different industries for a long time. AWJM is especially suitable for machining of brittle
material like glass, ceramics and stones as well as for composite materials and ferrous and
non-ferrous material. The characteristics of surface produced by this technique depend on
many factors like jet pressure, standoff distance of nozzle from the target. Abrasive flow rate,
Traverse rate, work materials. Non contact of the tool with work piece, no heat affected zone,
low machining force on the work surface and ability to machine wide range of materials has
increase the use of abrasive water jet machining over other machining processes. In addition,
AWJ machining can be used in a variety of applications such as drilling, polishing, turning,
and milling.
A review of the basic erosion models can be found in [1]. The erosion of materials caused by
the impact of hard particles is one of several forms of material degradation generally
classified as wear. Erosion was defined by Bitter [2] as "material damage caused by the
attack of particles entrained in a fluid system impacting the surface at high speed", while
Hutchings [3] defined erosion as "an abrasive wear process in which the repeated impact of
small particles entrained in a moving fluid against a surface results in the removal of material
from that surface". Solid particle erosion is a serious problem in gas turbines, rocket nozzles,
cyclone separators, valves, pumps and boiler tubes. However, solid particle erosion can be
utilized in manufacturing processes such as abrasive water jet cutting. Abrasive water jet
(AWJ) machining is one of the recent non-traditional methods that have been used widely in
industry for parting cuts on ductile materials such as aluminium, brass, steel, titanium, and
nickel based alloys as well as brittle materials like glass, stone, and ceramics [4]. There are
numerous associated parameters and factors of AWJM process that can influence the surface
quality of the AWJ machined surfaced [5-7]. MRR increase by increasing abrasive mass flow
rate. Increasing speed is also increase MRR. Full factorial design help for analysis as no
separate combination needs for confirmation test [8]. Previous investigation [9-12]
the taperness of the drilled holes was not being reduce. Now an attempt has been made to
increase MRR and to decrease the taperness by varying standoff distance (S-O-D) with
different chemical environment and chemical concentration. Many researchers have been
carried out on different parameters of AWJM Fecaier et al [13] and Ohlsson and Magnusson
[14] investigated the force parameters involved during AWJ machining Andreas and
kavaeevic [15] investigated the properties and structures of high speed jets Momer et al [16]
investigated the influence of abrasive grain size distribution on abrasive water jet machining
process. It’s a non-conventional machining process. Tikhomirow [17] worked on the possible
feed rate depending on the standoff distance of the nozzle.
2. METHODOLOGY
• Analysis of Variance (ANOVA)
Analysis of variance (ANOVA) and F-test (standard analysis) are used to analysis the
experimental data as given follows
Notation:
Following Notation are used for calculation of ANOVA method
C.F. = Correction factor
T = Total of all result
n = Total no. of experiments
ST = Total sum of squares to total variation.
Xi = Value of results of each experiments ( i = 1 to 27 )
SY = Sum of the squares of due to parameter Y (Y = P, S, A, T)
NY1, NY2, NY3 = Repeating number of each level (1, 2, 3) of parameter Y
XY1, XY2, XY3 = Values of result of each level (1, 2, 3) of parameter Y
FY= Degree of freedom (D.O.F.) of parameter of Y
fT = Total degree of freedom (D.O.F.)
fe = Degree of freedom (D.O.F.) of error terms
VY = Variance of parameter Y
Se = Sum of square of error terms
Ve = Variance of error terms
FY = F-ratio of parameter of Y
SY’ = Pure sum of square
CY= Percentage of contribution of parameter Y
CF = T2/n
ST = ∑i=1 to 27 Xi2 – CF
SY = ( XY12/NY1 + XY22/NY2 + XY32/NY3) – CF
fY = ( number of levels of parameter Y) – 1
fT = ( total number of results)-1
fe = fT - ∑fY
VY = SY/fY
Se = ST - ∑SY
Ve = Se/fe
FY = VY/Ve
SY’ = SY – (Ve*fz)
CY = SY’/ST * 100%
Ce = ( 1- ∑PY)*100%
• SIGNAL TO NOISE RATIO CALCULATION
Quality Characteristics:
S/N characteristics formulated for three different categories are as follows:
Larger is Best Characteristic:
Data sequence for MRR (Material Removal Rate), which are higher-the-better performance
characteristic are pre-processed as per Eq.1
S/N= -10 log ((1/n) ((1/y2))...1
Nominal and Smaller are Best Characteristics
Data sequences for SR , which are lower-the-better performance characteristic, are
pre-processed as per Eq.2 &3
S/N= -10 log (y/s2y)...2
S/N= -10 log ((1/n) (∑(y2))...3
Where y^ is average of observed data y, sy2 is variance of y, and n is number of observations.
3. EXPERIMENTAL SET UP AND WORK PROCEDURE:
Material:
In this investigation, the work material Aluminium was used with the following main
properties: Tensile Strength 90 MPa, Modulus of elasticity 69 GPa, and Density 2.71 g/cm3. The abrasive used was garnet with mesh size of 60, 80, and 100 hardness of 7.5 mohs.
Chemical composition of Al7075 alloy is Al 91.02, Cu 1.65, Mg 2.0, Zn 5.0, and Mn 0.1.
The equipment used for machining the samples was Abrasive Water Jet Machine, model no.
2626 OMAX Jet Machining Centre equipped with OMAX-High-Pressure Pump of 40 ksi
(3376.43 bar). The OMAX variable speed, high-pressure pump is an electrically driven,
variable speed, positive displacement, crank shaft drive triplex pump designed for use with
the OMAX precision jet machining system and other applications requiring high pressure
water required by the OMAX jet machining system to operate. The pump control panel
provides a keypad display screen, and pumps start/stop controls. When the pump is attached
to an OMAX jet machining centre, controls sheared between the Jet machining centre
controller and the pump. The table size was 46’’*31’’ (1168*787 mm) and foot print was
116’’L*72’’W (2946mm*1829mm), weight (empty tank) was 3000 lbs-tables (1364 kg).X-Y
cutting travel was 29’’*26’’ (737min*660min). Mixing tube diameter was 0.7620mm and
jevel diameter was 0.3556mm and abrasive index was 0.94.
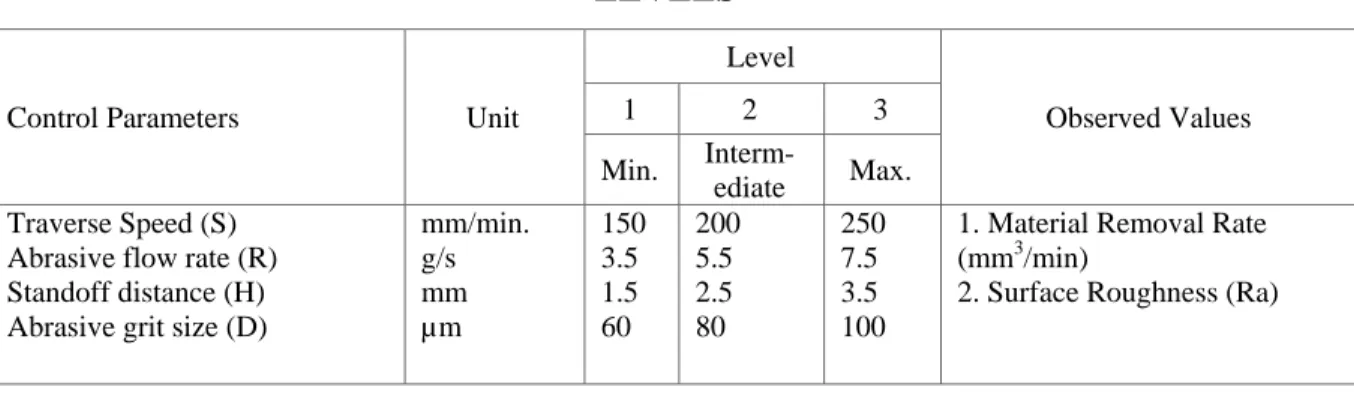
Experimental Design:
The experimental layout for the machining parameters using the L9 orthogonal array was
used in this study. This array consists of four control parameters and three level, as shown in
table In the taguchi method, most all of the observed values are calculated based on ‘the
higher the better’ and ‘the smaller the better’. Pressure is kept constant at 240 MPa .Thus in
this study, the observed values of MRR, and SR were set to maximum, and minimum
respectively. Next experimental trial was performed with three simple replications at each set
value. Next, the optimization of the observed values was determined by comparing the
standard analysis and analysis of variance (ANOVA) and SN ratio which was based on the
taguchi method.
TABLE 1: DESIGN SCHEME OF EXPERIMENT OF PARAMETERS AND
LEVELS
Control Parameters Unit
Level
Observed Values
1 2 3
Min.
Interm-ediate Max.
Traverse Speed (S) Abrasive flow rate (R) Standoff distance (H) Abrasive grit size (D)
mm/min. g/s mm µm
150 3.5 1.5 60
200 5.5 2.5 80
250 7.5 3.5 100
1. Material Removal Rate (mm3/min)
2. Surface Roughness (Ra)
TABLE 2: OBSEREVED VALUES OF MRR AND SR
No. Of Trial
Control Parameter(Level) Result /Observed Value
Traverse speed (mm/min. ) S Abrasive flow rate (g/s) R Standoff distance (mm) H Abrasive grit size (µm) D MRR (mm3/min)
SR (µm)
1 2 3 1 2 3
1 150 3.5 1.5 60 34.17 34.7
9
34.69 3.12 3.01 3.98
2 150 5.5 2.5 80 36.02 36.5
6
36.47 3.89 3.63 4.66
3 150 7.5 3.5 100 37.75 37.9
1
38.08 4.98 5.38 5.43
4 200 3.5 2.5 100 35.46 35.7
8
35.67 5.37 6.10 5.98
5 200 5.5 3.5 60 38.74 38.9
7
37.87 3.58 4.43 4.10
6 200 7.5 1.5 80 34.76 34.9
4
30.86 4.78 5.31 5.07
7 250 3.5 3.5 80 36.74 36.8
9
36.79 5.36 4.98 5.71
8 250 5.5 1.5 100 37.98 38.1
7
38.54 4.79 5.15 6.13
9 250 7.5 2.5 60 39.95 40.1
6
40.23 5.47 5.12 4.69
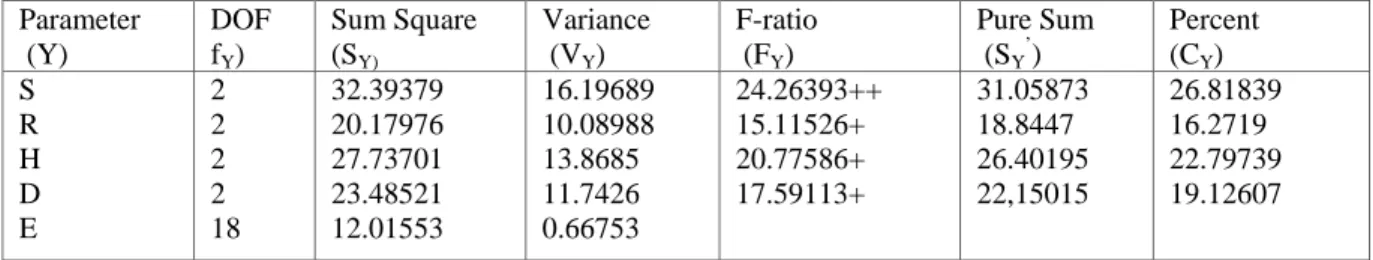
TABLE 3: ANALYSIS OF VARIANCE AND F-TEST FOR MRR
Parameter (Y)
DOF fY)
Sum Square (SY)
Variance (VY)
F-ratio (FY)
Pure Sum (SY’)
Percent (CY) S R H D E 2 2 2 2 18 32.39379 20.17976 27.73701 23.48521 12.01553 16.19689 10.08988 13.8685 11.7426 0.66753 24.26393++ 15.11526+ 20.77586+ 17.59113+ 31.05873 18.8447 26.40195 22,15015 26.81839 16.2719 22.79739 19.12607
TABLE4: ANALYSIS OF VARIANCE AND F-TEST FOR SR
Parameter (Y)
DOF (fY)
Sum Square (SY)
Variance (VY)
F-ratio (FY)
Pure Sum (SY’)
Percent (CY) S R H D E 2 2 2 2 18 5.116089 1.921622 0.758467 7.748689 3.608 2.558044 0.960811 0.379233 3.874344 0.200444 12.76186+ 4.793404+ 1.891962+ 19.32877++ 4.7152 1.520733 0.357578 7.3478 24.61877 7.939978 1.866967 38.36397
TABLE 5: SUMMARIZATION OF SIGNIFICANT PARAMETERS ON THE MACHINABILITY OF AWJM
Parameter MRR SR
Traverse Speed (S) Abrasive flow rate (R) Standoff distance (H) Abrasive grit size (D)
TABLE 6: S/N Ratio for MRR (Larger is Better)
1 2 3 S/N1 S/N2 S/N 3 Average
34.17 34.79 34.69 30.67289 30.82908 30.80408 30.76866
36.02 36.56 36.47 31.13087 31.26012 31.23871 31.20990 37.75 37.91 38.08 31.53833 31.57736 31.61393 31.57654 35.46 35.78 35.67 30.99477 31.07280 31.04606 31.03788 38.74 38.97 37.87 31.76319 31.81460 31.56590 31.71456 34.76 34.94 30.86 30.82159 30.86645 29.78791 30.49198 36.74 36.89 36.79 31.30278 31.33817 31.31459 31.31851
37.98 38.17 38.54 31.59109 31.63444 31.71823 31.64792 39.95 40.16 40.23 32.03033 32.07587 32.09100 32.06573
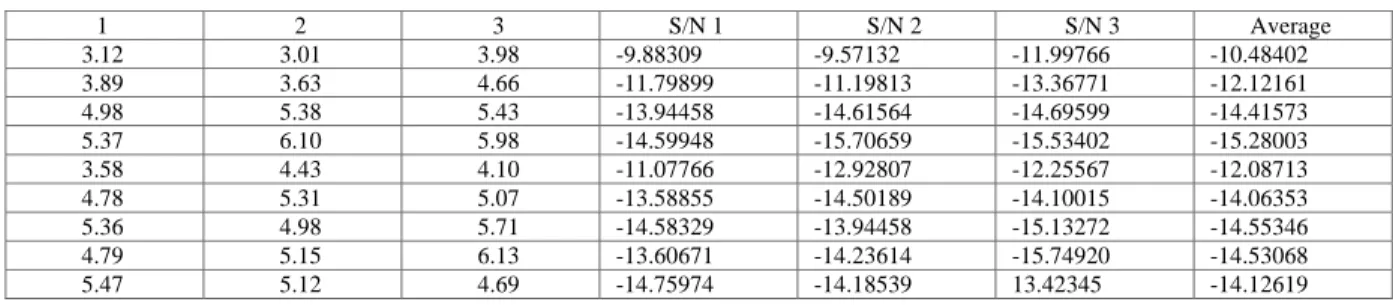
TABLE 7: S/N Ratio for SR (Smaller is Better)
1 2 3 S/N 1 S/N 2 S/N 3 Average
3.12 3.01 3.98 -9.88309 -9.57132 -11.99766 -10.48402 3.89 3.63 4.66 -11.79899 -11.19813 -13.36771 -12.12161 4.98 5.38 5.43 -13.94458 -14.61564 -14.69599 -14.41573 5.37 6.10 5.98 -14.59948 -15.70659 -15.53402 -15.28003 3.58 4.43 4.10 -11.07766 -12.92807 -12.25567 -12.08713 4.78 5.31 5.07 -13.58855 -14.50189 -14.10015 -14.06353 5.36 4.98 5.71 -14.58329 -13.94458 -15.13272 -14.55346 4.79 5.15 6.13 -13.60671 -14.23614 -15.74920 -14.53068 5.47 5.12 4.69 -14.75974 -14.18539 13.42345 -14.12619
Taguchi Analysis: S/N Ratio for MRR versus S, R, H, D
Response Table for Signal to Noise Ratios Larger is better
Level S R H D 1 31.18 31.04 30.97 31.52 2 31.09 31.52 31.44 31.01 3 31.68 31.38 31.54 31.42 Delta 0.59 0.48 0.56 0.50 Rank 1 4 2 3
Figure 1:S/N Ratio of MRR for different levels
Taguchi Analysis: S/N Ratio for SR versus S, R, H, D
Response Table for Signal to Noise Ratios Smaller is better
Level S R H D 1 -12.38 -13.47 -13.07 -12.27 2 -13.83 -12.96 -13.87 -13.60 3 -14.43 -14.21 -13.70 -14.77 Delta 2.05 1.25 0.80 2.50 Rank 2 3 4 1
Figure 2 : S/N Ratio of SR for different levels
4. RESULTS AND DISCUSSION:
The following discussion focuses on the different of process parameters to the observed
values (MRR and SR) based on the Taguchi methodology.
Material Removal Rate (MRR)
Main effects of MRR of each factor for various level conditions are shown in figure1.
According to figure 1 the MRR increases with four major parameter S, R, H, and D. MRR is
maximum in the case of Traverse Speed(S) at level 3 (250), in the case of Abrasive flow
Rate (R) at level 2 (5.5), in the case of Standoff distance (H) MRR will be maximum at
level 3 (3.5), and in the case of Abrasive griet Size (D) at the level 1 (60). So the optimal
parameter setting for the MRR found S3R2H3D1
Surface Roughness (SR)
Figure 2 evaluates the main effects of each factor for various level conditions. According to
the figure 2 the surface Roughness decreases with four major parameter S, R, H, and D. SR
will be minimum in the case of Traverse Speed (S) at level 1 (150), in the case of Abrasivw
case of Abrasive grit Size (D) condition surface Roughness will be minimum at level 1 (60).
So the optimal parameter setting for minimum surface roughness is S1R2H1D1.
CONFIRMATION TEST
The confirmation experiments were conducted using the optimum combination of the
machining parameters obtain from Taguchi analysis. These confirmation experiments were
used to predict and verify the improvement in the quality characteristics for machining of
Aluminium. For MRR predicted process combination is S3R2H3D1 and for S1R2H1D1
and found MRR 36.12 mm3/min and SR 2.34µm.
CONCLUSIONS
This paper presents analysis of various parameters and on the basis of experimental results,
analysis of variance (ANOVA), F-test and SN Ratio the following conclusions can be drawn
for effective machining of aluminium (Al7075) by AWJM process as follows:
• Traverse Speed (S) is the most significant factor on MRR during AWJM. Meanwhile Abrasive Flow Rate, Standoff distance, and Abrasive Grit Size are sub significant in
influencing. The recommended parametric combination for optimum material removal rate is
S3R2H3D1
• In case of surface Roughness Abrasive Grit Size is most significant control factor and
hence the optimum recommended parametric combination for optimum surface Roughness is
S1R2H1D1.
REFERENCES
[1.] Kovacevic R, Hashish M., Mohan R., Ramulu M, Kim T.J., Geskin E.S., 1997, State of
the Art of Research and Development in Abrasive Waterjet Machining, ASM E Transact ions,
Journal of Manufacturing Science and Engineering, 11 9/4B: 776-785.
[2.] Bitter J.G.A., 1963, A Study of Erosion Phenomena, Part 1, Wear, 6:5-21.
[3.] Hutchings I.M., Winter R.E., 1974, Particle Erosion of Ductile Metals: A Mechanism of
Material Removal, Wear, 27/1: 121 -1 28.
[4.] Siores E., Wong W.C.K., Chen L., Wager J.G., 1996, Enhancing Abrasive Waterjet
Cutting of Ceramics by Head Oscillation Techniques, Annals of the CIRP,45/1: 327-300.
[5.] M. Hashish, A Model of Abrasive Water Jet
[6.] Ramulu, M. And Arola, D., 1994, “The Influence of Abrasive Waterjet Cutting
Conditions on the Surface Quality of Graphite/Epoxy Laminates”, Int. J. Mach. Tools Manuf.
[7] Konig, W. And Rummenholler, S., 1993 “Technological and Industrial Safety Aspects in
Milling FRPs”, ASME Mach. Adv. Comp. 45 (66): 1-14.
[8.] Vaubhav.j.limbachiya1*,Prof Dhaval.M.Patel2 Vol. 3 No. 7 July 2011, “An Investigation of Different Material on Abrasive Water jet Machine”. ISSN: 0975-5462.
[9] M. Hashish, Pressure effect i AWJ machining, J. Eng. Mater. Technol. 3 (1989)
221-228.
[10] A.R.C. Westwood, Control and application ofenvironment sensitive fracture
processes, J. Mater Sci. 9 (1974) 1871- 1995.
[11] Hashish, M., 1991, “advances in composite Machining with Abrasive-Waterjets”.
Process. Manuf. Comp. Mat. 49 (27): 93-111
[12] Y.Enomoto, Sliding fracture of soda-lime glass in liquid environment, J. Mater. Sci. 6
(1981) 3365-3370.
[13] Fekaier,A.J.C. Guinot, A. Schmitt and G. Houssaye,1994. Optimization of the
abrasive jet cutting surface quality by the workpiede reaction forces analysis, 12th Intl. Conf. Jet Cutting Tehnol., pp:127-134.
[14] Ohlsson, L. And C. Magnusson, 1994. Mechanisms of striation formation in abrasive
water jet cutting, 12th Intl. Conf. Jet Cutting Technol., pp:151-164.
[15] Andreas, W.M. and R. Kovacevic, 1998. Properties and structure of High Speed water
Jets. Principle of Abrasive Water Jet Machining.
[16] Momer, A.W., R. Kovacevich and R. Schuneman, 1996. The influence of abrasive grain
size distribution on abrasive water jet machining process. Proceedings of the25th Nor American Manufacturing Research Conference, Society of Manufacturing Engineers,
Deavborn.
[17] Tikhomirov, R.A., V.F. Babanin, E.N. Petukhov, I.D. Starikove and V.A.