International Journal of Research in Engineering & Applied Sciences 21 http://www.euroasiapub.org
WEAR RATE MEASUREMENT (IC ENGINE) USING LUBRICANT
OIL TESTING METHOD
PankajSharma* Pratesh Jayaswal*
ABSTRACT
Diesel engines are generally used for the automobile vehicles. These engine are the heart of
the all the vehicles. Maintenance is the most important aspect for increasing Engine life
which in turn increases the life of vehicle. Engine performances are directly depends upon
the health of its components like piston, cylinder, cylinder head, crankshaft, cam shaft,
connecting rod etc. Engines performances are also depend upon its lubricating oil. In this
study, main aim is to the heath monitoring of the diesel engine components through the study
of engine oil. In this paper the quality of engine oil which was changed, after different
kilometers are measured. For this purpose Viscosity Test, Flash Point and Fire Point and
Sulpher Test are used for the analysis of wear debris particles which is suspended in engine
oil. These methods are very useful in engine oil analysis and provide important information
about the condition of engine and whether it is needed to replace or maintain and it will also
helpful for cost control. If the rates of these wear debris particles are high then it will
indicate that engine is not in good condition and will require maintenance work. The aim of
this paper is the condition monitoring of engine by preventing it to the upcoming failure
through the study and analysis of the wear particles suspended in the engine oil since engine
made through different particles such as engine block made from cast iron, piston made
from the Aluminum alloy, crankshaft made from Cast iron etc. allow to determine where the
chances of failure occur in the engine as the life of vehicle increases in term of Kilometers.
Keywords: Condition monitoring Diesel Engine, lubrication monitoring, wear particle
analysis, rotary particle depositor, microscope, viscosity.
International Journal of Research in Engineering & Applied Sciences 22 http://www.euroasiapub.org
1. INTRODUCTION
Oil monitoring is a key component of successful condition monitoring programs [6]. It can be used as a predictive and proactive tool to identify the wear modes of rubbing parts and diagnose the faults in machinery. [1] It is a method of predicting the health of equipment in a non-intrusive way, by the study of wear particles. The continuous trending of wear rate monitors the performance of engine / engine components and provides early warning and diagnosis. Oil condition monitoring can sense danger earlier than Vibration technique [2].This technique holds good for both oil and grease samples. By analyzing the oil sample, the residual life of used oil is determined and a fault in the machine can be diagnosed before the machine has to be prematurely shut down. Sliding adhesive wear particles are found in most lubricating oils. They are an indication of normal wear.
The aim is to classify all these particulars according to their morphological attribute of size, shape, edge details thickness ratio, color texture and by using this classification there by predict wear failure modes in the engine and utilized this information to prevent the engine from possible future trouble. So in this way it is clear that the aim of this paper is to reduce maintenance work which in term also reduce all the expenditure which are used for maintain a Vehicle’s engine in a working able condition.
2. TESTING METHOD
2.1 SPECTROMETRIC OIL ANALYSIS PROGRAMS
2.1.1 Introduction
A spectrophotometer is a device to measure light intensity at different wavelengths. It produces light with a light source, and after the light passes through a subject, the light is diffracted into a spectrum which is detected by a sensor and interpreted into results we can use. The output of a spectrophotometer is usually a graph of light intensity versus wavelength. It is a maintenance tool which is used to check the condition of the oil lubricated mechanical systems (Examples: Motors, Engines, Gear boxes, Hydraulic systems). The systems can be kept under surveillance without dismantling them. Abnormally worn compounds can be localized and replaced before a catastrophic failure occurs. The quantity and type of wear metals in sample of lubricating oil is determined. The quantity can indicate something about the magnitude of the wear and the type of wear metals can reveal which component is wearing out.
IJREAS
Volume 2, Issue 7 (July 2012)
ISSN: 2249-3905
International Journal of Research in Engineering & Applied Sciences 23 http://www.euroasiapub.org
2.1.2 Method Description
Spectrophotometer oil analysis is perhaps one of the more commonly used techniques for the determination of certain elements by either atomic emission or atomic absorption spectroscopy. While the techniques is readily automated to achieve a fast throughput of sample 1, 2 and has morphology of the wear debris and is sensitive to particles sizes 10 ~m 13[9].
2.1.3 Spectrophotometer Instrument
All spectrophotometer instruments designed to measure the absorption of radiant energy have the basic components as follows.
1. A stable monochromatic;
2. A wavelength selector to isolate a desired wavelength from the source (filter or source of radiant energy (Light) :
3. Transparent container (cuvette) for the sample and the blank;
4. A radiation detector (phototube) to convert the radiant energy received to a measurable signal; and a readout device that displays the signal from the detector.
LIGHT SOURCE
MONOCHROMATER
SAMPLE
PHOTOTUBE MEASURING ABSORBED/TRANSMITTED
Figure 2.1: Component of Spectrophotometer
2.1.4 Working
International Journal of Research in Engineering & Applied Sciences 24 http://www.euroasiapub.org
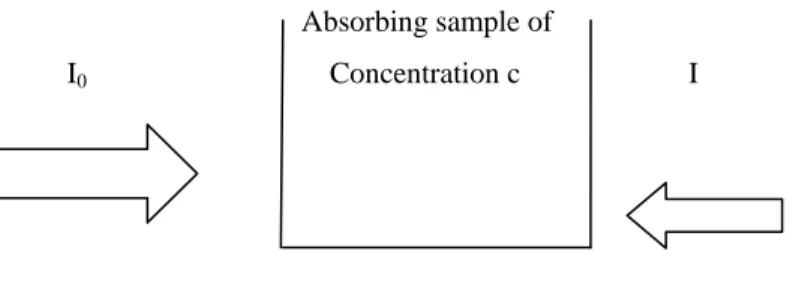
beam. Solutions are placed in containers (called "cuvettes") whose material is transparent: quartz is commonly used, but for visible light, one also uses disposable cuvettes made of polystyrene or polycarbonate.
The Transmittance, T of the solution is defined as the ratio of the intensities of the transmitted beam, I to the intensity, Io of the incident beam:
Absorbing sample of
I0 Concentration c I
Path Length I
Figure 4.2: Beer–Lambert absorption of a beam of light as it travels through a cuvette
of width ℓ.
T = I/Io
The Absorbance, α of a solution is defined as α = -log10T. Since α is a logarithmic function, it is dimensionless.
The Beer-Lambert law states that the absorbance is directly proportional to the path length, ℓ of the sample and its concentration c. These relation are usually written as
α=εℓc Where
α = absorbance (no unit, since α = log10 T= log10 I0 / I) ε = molar absorptivity (with units of L mol-1 cm-1)
ℓ = path length of the sample i.e. the path length of the cuvette in which the sample is contained
c = concentration of the compound in solution, expressed in mol L-1 2.2 Rotary Particle Depositor
International Journal of Research in Engineering & Applied Sciences 25 http://www.euroasiapub.org
and size, require a degree of expertise that can be generated through the supplementary techniques such as Ferrography or Rotary particle depositor. [10].
2.2.1 Working
The RPD Rotary Ferro graph offers a rapid and simple method of debris separation and particle size analysis. A measured volume of lubricant sample is filled in the burette. Then switch on the power of RPD machine. When magnet and glass slide (substrate) assembly start to rotate at desired speed start allowing drop by drop lubricating sample oil on the glass slide by the means of nozzle fitted on burette. Keep the machine turn on till the end of lubricating oil in the burette. Particles of debris are deposited radially as three concentric rings by the combined effects of rotational, magnetic and gravitational forces. It should be noted that lubricating oil sample is well shacked before filling in burette.
2.3 Flash Point and Fire Point
Flash point is the lowest temperature at which the oil lubricant gives off enough vapours that ignite for a moments when a tiny flame brought near it, while fire points is the lowest temperature at which a vapours of the oil burns continuously for at least five seconds, when a tiny flame is brought near it. A good lubricant should have flash points at least above the temperature at which it is to be used. The flash and fire points are usually determined by using “PENSKY-MARTEN’S APPARATUS”.
This apparatus consist of: 2.3.1 Oil Cup
An oil cup is about 5 cm in diameter and 5.5 mm deep. The level to which oil is filled marked inside the cup. The cup is provided with the four opening of the standard size. Through one of these passes a thermometer; while the second opening is used for introducing test flame. 2.3.2. Shutter
Shutter is the lever mechanism, provided at the top of the cup. By moving the shutter, opening in the lid opens and flame is dipped in to this opening, thereby burning the flame over the oil surface.
2.3.3 Flame exposure device
It is a tiny flame, connected to the shutter by a lever mechanism. 2.3.4 Air Bath
Oil cup is supported by its flange over an air bath which is heated by a heater. 2.3.5 Pilot Burner
International Journal of Research in Engineering & Applied Sciences 26 http://www.euroasiapub.org
2.3.6 Working
Oil under examination is filled up to the mark in the oil cup and then heated by the heater. Stirrer is worked between tests at a rate of about 1 to 2 revolution per second. Heat is applied
so as to C rise of temperature,
test flame is introduced for a moment, by working the shutter. The temperature, at which a distinct flash (a combination of weak sound and light) appears inside the cup, is recorded as the flash point. The heating is continues thereafter and then test flame is applied as before. When the oil ignites the continuous to burn at least 5 seconds, the temperature reading is then recorded as the fire point of the oil.
2.4 Viscosity
Viscosity is a measure of the resistance of a fluid which is being deformed by either shear stress or tensile stress. In everyday terms (and for fluids only), viscosity is "thickness" or "internal friction". Thus, water is "thin", having a lower viscosity, while honey is "thick", having a higher viscosity. Put simply, the less viscous the fluid is, the greater its ease of movement (fluidity)[3].
Viscosity of lubricating oil is determined with the help of an apparatus known as Viscometer. In a viscometer a known volume of lubricant is allowed to flow, from a given height, through standard capillary tube under its own weight and the time of flow in second is recorded. The time is seconds is proportional to the true viscosity [5]. The results are expressed in terms of time taken by oil to flow through particular instruments. For example, if time of flow of oil throug C is 120 Seconds, then its
C. 2.4.1 Procedure
Test of viscosity determination is very simple. First of all oil is filled up to the mark in the oil cup, and then this cup is heated by the water bath. Insert thermometer in the oil cup and note C, remove the valve rod from the jet opening. Hence oil is falling down in the beaker (50 ml in size) which is already placed just beneath of oil cup. Time required to fill the beaker is known as the viscosity of the respective oil. Same procedure is applied for all the samples and determines their viscosity.
2.5 Litmus Paper Test
International Journal of Research in Engineering & Applied Sciences 27 http://www.euroasiapub.org
colour moves toward the dark black from the light brown. Following figure shows the result of litmus paper test.
2.6 Sulphur Test
If sulphur present in considerable amount in the lubricating oil it promotes corrosion. The corrosion test shows the amount of sulphur contents.
2.6.1 Procedure
Sulphur test is one of the important tests. For this 2 gm. weighted sample of lubricant are used (i.e. in this dissertation sulpher test are used for 2 gm. oil samples). First of all, weight of crucible is determined by the universal weighing machine. Net amount of sample are then mixed with the dilute HCl. Then heats up this mixture for 30 minute and then allow the mixture for cooling about 30 minute. Then mix the saturated solution of BaCl2 (which work as the indicator) in this solution. If sulpher is present in the mixture then solution changes their colour otherwise not. If sulpher is present then an arrangement of conical flask and funnel are made. Watt men filter paper is placed on the top the arrangement (i.e. funnel) and applies solution on it. Liquid is filtered by filter paper and only sulphur is present on it. Then allow this paper for dry. When the paper is dried then put is on the crucible and burn the filter paper. When the filter paper is burnt, again weight the crucible. Subtract the pre-determined value of the crucible from it. Result weight shows the sulpher present in the 2 gm. sample. Similar procedure is applied for the entire sample and determined the sulpher present in all sample.
2.7 Moisture Content Test
This test is somewhat simple test as compare to other tests of this paper. This test gives quick result. In this test weighted sample of lubricant are taken in the beaker and heats up either by means of the gas burner or by means of the heater. For this test 5 gm. of each sample are taken. During this moisture content test, samples of engine oil are then heated up until the oil sample of engine smoke began to leave. If at this time sample of oil gives splatter of water which indicates the appearance of moisture in the sample otherwise sample are free from moisture. Similar procedure is applied for all the sample of oil.
2.8 Filter Gram Analysis
International Journal of Research in Engineering & Applied Sciences 28 http://www.euroasiapub.org
assured to differentiate between chemical leaching and mechanical wear. 2.8.1 Procedure
A filter gram analysis of an oil sample can be a very useful addition to the more traditional methods of condition monitoring. The sample to be examined is dissolved in a solvent (Di methyl Sulphoxside) and filtered through a very fine membrane filter (watt men filter of 41 no). Filter papers used in the examination are capable of measuring the particle of size more than 22 microns. The wear debris and other contaminants in the oil are captured on the membrane for examination under a high power microscope[8]. The filter gram report gives an analysis of the size and composition of all the particles found as well as the wear mechanism which generate the metallic particles. Photographs of selected particles are presented on the report. Debris recovered from filter media can also be analyzed by these techniques.
2.9 Infrared Technology
Infrared thermography has been used as a condition monitoring tool for over a decade. The technology provides thermal images that could help the experts in detecting faults in electrical and mechanical systems. In spite of its capabilities, infrared thermography has not found its way into autonomous systems. The main reason for this is the high cost of the technology. A typical infrared camera could cost more than £40 000 or far more. A recent drive to reduce the cost of the technology has had only a limited effect. Most of the available infrared systems in the market are designed as portable systems for measuring and saving data. The low-cost infrared imager used in the present research work is type IRI1002, produced by IRISYS Limited. The infrared multipoint radiometer is an uncooled pyro electric system. The pyro electric detectors generate a charge on every pixel that is proportional to the change in the infrared radiation received as a result of change in temperature of the viewed objects. Imagers of this type require a constantly changing image signal, and thus the imager has a mechanical chopper to generate a continuous change in infrared radiation.
The difference between the chopper and the open-view infrared radiation produces a corresponding charge which is converted into a voltage and amplified to produce a thermal representation of the object.
2.10 Wear Debris Analysis
International Journal of Research in Engineering & Applied Sciences 29 http://www.euroasiapub.org
The technique of Wear Debris Analysis is gaining popularity in the field of Condition Based Maintenance. WDA is a method of predicting the health of equipment in a non-intrusive way, by the study of wear particles. The continuous trending of wear rate monitors the performance of Machine / Machine components and provides early warning and diagnosis. Oil condition monitoring can sense danger earlier than Vibration technique. This technique holds good for both oil and grease samples.
2.11 pH Test
PH is the measure of hydrogen ion activity. It is used to express the intensity of acidic or alkaline condition of a solution. pH is the relative acidity or basicity of a substance. This value is important information to have in many situations as the pH level of a substance dictates its safety, chemical reactivity and effects on the environment. Everyone from chemical engineers to home gardeners can make use of the pH information for a specific substance. This value is so important that the ability to test the pH of a substance, such as oil, has been around for many years and can easily be accomplished. pH of lubricating oil sample can be determined by electrometrically or colorimetrically.
2.11.1 Procedure
Following step shows the method of ph test:
1. Remove a universal indicator strip from its container.
2. Dip one end of the universal indicator strip into the oil for which you want to test the pH level.
3. Set the universal indicator on a dry surface for 60 seconds to allow the pH reading to take place.
International Journal of Research in Engineering & Applied Sciences 30 http://www.euroasiapub.org
5. Match the new color of the universal indicator paper to that of the chart to find an exact pH match.
3. Data Collection and Experimental Setting
All data of sample are collected from the Prem Motors Gwalior, and these all sample are belongs to the engine oil of (diesel engine) Maruti Swift Details of all samples are described below [4]: Details of engine components are given in Table : 1
Following Table 2: shows the all the details of oil (in terms of kilometers) which are used for the investigation.
Sample CodeVehicle
R i t ti N
Total Vehicle Runs
(kil t )
1. 0 (unused)
2. MP07-mJ-7777 1500 3. MP06-CA-1687 3000 4. MP07-CA-4425 5000 5. MP07-CC-6022 8000 6. MP07-CC-3050 10000 7. MP07-CC-4510 12000 8. MP07-CA-4209 15000
4. TESTING RESULTS
4.1 Viscosity TestViscosity of lubrication oil of all the vehicles which was used for the investigation, are listed below in the following table in this test viscosity of the oil are determined at 99.9˚ C. It is clear with the help of above viscosity test that as vehicle life increases (in term of running kilometer) the viscosity of the engine-oil also increases.
S.No. Characteristics Description
1. Engine Type DIESEL
2. Cylinder Type Four Cylinder Engine
3. Bore 74 (mm)
4. Stroke 75.5 (mm)
5. Maximum Power 87Bhp at 6000 rpm
6. Maximum Torque 114Nm at 4000 rpm
International Journal of Research in Engineering & Applied Sciences 31 http://www.euroasiapub.org
Table: 3
4.2 Sulphur test
Sulphur test are carried out through Gravimetric Analyst is. Following table 8 shows the result of sulphur test.
Weight of crucible= 16.1140
Table: 4
Sample
Code
Weight of
Cr cible
Weight of Sulpher
1 16.2718 0.1678
2 16.2986 0.1745
3 16.3764 0.2424
4 16.4308 0.2792
5 16.5098 0.3458
6 16.5462 0.4122
7 16.6209 0.5269
Sample Investigated
International Journal of Research in Engineering & Applied Sciences 32 http://www.euroasiapub.org
Following figure shows the graphs for the Sulpher weight found in the entire oil sample
It is clear from the above table that weight of sulphur increases as the vehicle runs increases 4.3 Flash point and fire point test
Flash point and fire point of the entire engine oil sample which war used for the investigation are listed below.
TABLE: 4
Sample Flash Point Fire Point
1. 200 210
2. 192 195
3. 182 180
4. 170 172
5. 163 171
6. 155 161
7. 144 158
8. 137 152
International Journal of Research in Engineering & Applied Sciences 33 http://www.euroasiapub.org
4.4 MOISTURE CONTENT TEST
TABLE: 5- Moisture Content
It is clear from the test that no moisture presents in any sample. This also indicates that there is no leakage in the engine. Hence it is clear that vehicles whose oil was used for the investigation are from moisture.
4.5 SOAP TEST
Concentration of aluminum and iron particles is shown in the following table. TABLE-6 Concentration of Iron and Aluminum
Sample code Remarks
1. Moisture not found 2. Moisture not found 3. Moisture not found 4. Moisture not found 5. Moisture not found 6. Moisture not found 7. Moisture not found 8. Moisture not found
Sample
code
CONCENTRATION
WAVELENGTH (WL608.0)
CONCENTRATION WAVELENGTH (WL634.0)
2. 35.45 0.261 5.012 0.004
3. 50.123 0.321 30.457 0.017
4. 60.29 0.264 80 0.072
5. 80.187 0.428 110.174 0.0769
6. 99.76 0.603 190.125 0.417
7. 101.205 0.606 190.786 0.122
8. 115.325 0.766 216.23 0.236
International Journal of Research in Engineering & Applied Sciences 34 http://www.euroasiapub.org
It is clear from SOAP analysis, Concentration of Aluminum and Iron particles has increased with vehicle runs. So that the parts of engine which was made from aluminum and iron, wear rate increased with vehicle run.
Concentration of Iron and Aluminum in the samples
4.6 pH TEST-
Table-7 pH test result
SAMPLE
CODE
VEHICLE
REGISTRATION
NO
pH
VALUE
REMARKS
1. Unused oil 6.5 Free acid Negligible
2. MP07- MJ-7777 7.0 Free acid Negligible
3. MP06-CA-1687 7.5 Free acid Negligible
4. MP07-CA-4425 7.0 Free acid Negligible
5. MP07-CC-6022 5.0 More free Acid -Adulteration -Contamination
6. MP07-CC-3050 8.0 Basic (more OH¯ ) –Adulteration -Contamination
7. MP07-CC-4510 8.2 Basic (more OH¯ ) -Adulteration -Contamination
International Journal of Research in Engineering & Applied Sciences 35 http://www.euroasiapub.org
On the basis of pH test it is clear that as the vehicle life increases free acid increases, and the rate of Adulteration and Contamination are also increases.
4.6.1Significance-
Table: 8 Significance of pH value
pH value of sample Significance
6.5-7.5 Contamination are not there
6.5 Natural Good
8-10 Basic (more OH¯ ) Contamination are there
5 Contamination is there No of free acid increases Adulteration.
5. CONCLUSION
IC engines are generally used for the automobile vehicles. These engines are important for the Automobile as like the heart for human being. As the heart of human being is fail whole system of body also failed. So for successful operation of vehicle engine should perform its intended function properly. There are lots of methods are available for the monitoring of engines performance such as vibration monitoring, acoustic monitoring, oil monitoring etc. This dissertation is totally based on oil monitoring.
Oil analysis is the most effective techniques for monitoring the health of engine. They offer complementary strengths in root cause analysis of engine failure, and are natural allies in diagnosing engine condition. They reinforce indications seen in each technology, and have unique diagnostic strengths in highlighting specific wear conditions. The following few conclusions could be highlighted;
1. It is clear from the pH test, as the vehicle life increases rate of free acid increases, and the rate of Adulteration and Contamination are also increases.
2. In the litmus paper test, colour of strips are becoming dark as the running of vehicle which also have same meaning that debris particles are closely placed with each other in this way the colour of strips are dark. This also means that the quality of engine oil has been continuously decreased.
International Journal of Research in Engineering & Applied Sciences 36 http://www.euroasiapub.org
4. Moisture content test is very important test for engine’s point of view. This test concludes that no moisture has present in the lubrication oil. This also indicates that engines of vehicle whose oil are used for the investigation are free from any types of moisture.
5. In the Flash point and Fire point, burring temperature of engine oil continuously decreased, i.e. the flash point and fire point of engine oil samples are continuously deceased with the vehicle runs. This indicates that engine oil will also burn with the fuel and this is not a good symptom for safe running of the engine.
6. In SOAP, concentration of Iron and Aluminium particles has increased with respect to vehicle runs, which in terms increases the viscosity of the oil i.e. the quality of the oil continuously decreased with the vehicle runs.
7. In the sulphur test, it is proved with the Gravimetric analysis that the rate of sulphur presence is increased with vehicle runs.
8. It is clear with the viscosity test, the viscosity of the engine oil increased with vehicle run, which indicates that the rate of particle deposition increased with the vehicle runs i.e. more debris particles are suspended in the engine oil with the vehicle runs
9. It is clear with the filter gram analysis that the presences of non-ferrous particles are increased with the running of vehicle, i.e. the quality of engine oil continuously decreased with the vehicle runs.
REFERENCES
(1). Sang Myung Chun, (2011), “Simulation of engine life time related with abnormal oil consumption”, Tribology International, 44, pp. 426-436.
(2). Li Du and Jiang Zhe, (2011), “A high throughput inductive pulse sensor for online oil debris monitoring”, Tribology International, 44, pp. 175–179.
(3). Margareth Judith Souza de Carvalho et al, (2010), “Lubricant viscosity and viscosity improver additive effects on diesel fuel economy”, Tribology International, 43, pp. 2298– 2302.
(4). A Albarbar et al, (2010), “Diesel engine fuel injection monitoring using acoustic measurements and independent component analysis”, Measurement, 43, pp.1376-1386.
(5). B. Tesfa et al, (2010), “Prediction models for density and viscosity of biodiesel and their effects on fuel supply system in CI engines”, Renewable Energy 35, pp. 2752-2760.
International Journal of Research in Engineering & Applied Sciences 37 http://www.euroasiapub.org
(7). D A Green and R Lewis, (2008), “The effects of soot-contaminated engine oil on wear and friction: a review”, Automobile Engineering, Vol. 222 Part D, pp.1669-1689.
(8). Allison M. Toms and Karen Cassidy, (2008), “Filter Debris Analysis for Aircraft Engine and Gearbox Health Management”, Failure analysis and prevention, 8, pp.183–187.