(www.interscience.wiley.com)DOI:10.1002/path.2008
Original Paper
Peripheral chondrosarcoma progression is accompanied
by decreased Indian Hedgehog signalling
L Hameetman,1 LB Rozeman,1M Lombaerts,1J Oosting,1AHM Taminiau,2A-M Cleton-Jansen,1JVMG Bov´ee1 and PCW Hogendoorn1*
1Department of Pathology, Leiden University Medical Centre, Leiden, The Netherlands
2Department of Orthopaedic Surgery, Leiden University Medical Centre, Leiden, The Netherlands
*Correspondence to: Professor PCW Hogendoorn, Department of Pathology, Leiden University Medical Centre PO Box 9600 L1-Q, 2300 RC Leiden, The Netherlands. E-mail:
Received: 17 February 2006 Revised: 13 March 2006 Accepted: 31 March 2006
Abstract
Hedgehog (HH) signalling is important for specific developmental processes, and aberrant, increased activity has been described in various tumours. Disturbed HH signalling has also been implicated in the hereditary syndrome, Multiple Osteochondromas. Indian Hedgehog (IHH), together with parathyroid hormone-like hormone (PTHLH), participates in the organization of growth plates in long bones. PTHLH signalling is absent in osteochondromas, benign tumours arising adjacent to the growth plate, but is reactivated when these tumours undergo malignant transformation towards secondary peripheral chondrosarcoma. We describe a gradual decrease in the expression of Patched (PTCH) and glioma-associated oncogene homologue 1 (GLI1) (both transcribed upon IHH activity), and GLI2 with increasing malignancy, suggesting that IHH signalling is inactive and PTHLH signalling is IHH independent in secondary peripheral chondrosarcomas. cDNA expression profiling and immunohistochemical studies suggest that transforming growth factor-β(TGF-β)-mediated proliferative signalling is active in high-grade chondrosarcomas since TGF-β downstream targets were upregulated in these tumours. This is accompanied by downregulation of energy metabolism-related genes and upregulation of the proto-oncogene jun B. Thus, the tight regulation of growth plate organization by IHH signalling is still seen in osteochondroma, but gradually lost during malignant transformation to secondary peripheral chondrosarcoma and subsequent progression. TGF-β signalling is stimulated during secondary peripheral chondrosarcoma progression and could potentially regulate the retained activity of PTHLH. Copyright 2006 Pathological Society of Great Britain and Ireland. Published by John Wiley & Sons, Ltd.
Keywords: Hedgehog; transforming growth factor-β; cartilaginous tumours; molecular pathways; tumour progression
Introduction
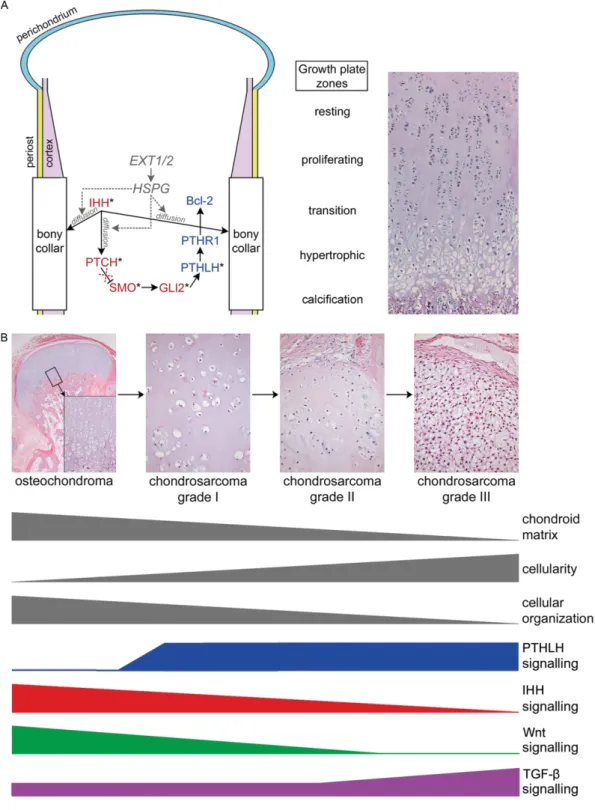
Hedgehog (HH) signalling plays an important role dur-ing embryonic and postembryonic development, where it regulates cell proliferation and/or differentiation [1]. Upon binding to HH, Patched (PTCH) relieves its inhi-bition of Smoothened (SMO), which activates glioma-associated oncogene homologue (GLI) transcription factor family members (GLI1–3). This leads to activa-tion of target genes, including GLI1 and PTCH itself [2,3]. In the growth plate, Indian Hedgehog (IHH) reg-ulates chondrocyte proliferation and differentiation in a tightly regulated paracrine feedback loop, together with parathyroid hormone-like hormone (PTHLH or PTHrP; Figure 1A) [4–6].
Deregulated IHH signalling has been implicated in patients with Multiple Osteochondromas [7–9], an autosomal dominant disorder characterized by the for-mation of cartilage-capped, benign, bony neoplasms on the outer surface of bones preformed by endochon-dral ossification [8,10]. EXT1 and EXT2 have been
identified as tumour suppressor genes for Multiple Osteochondromas [11]. These genes are involved in the biosynthesis of heparan sulphate proteoglycans [12,13], multifunctional macromolecules involved in the diffusion of HH to PTCH [9,14]. Osteochondromas also occur as solitary lesions in a non-hereditary back-ground [10]. The cartilage cap of osteochondromas morphologically recapitulates the epiphyseal growth plate [10].
including sporadic basal cell carcinoma [19], medul-loblastoma [20], colon cancer [21], small-cell lung cancer [22], and prostate cancer [23]. Inactivation of HH signalling has been associated with developmen-tal malformations such as cyclopia and holoprosen-cephaly [2].
The involvement of IHH signalling in tumouri-genesis as well as endochondral ossification points to its possible involvement in osteochondroma and chondrosarcoma. We have previously demonstrated that molecules downstream in the IHH/PTHLH sig-nalling pathway are not expressed in osteochondromas [24,25], suggesting that growth signalling is disturbed. Malignant transformation leads to re-expression of these signalling molecules [24,25].
Here, we aimed at elucidating the role of IHH signalling in the progression of peripheral chon-drosarcomas, in a series of hereditary and spo-radic osteochondromas, as well as chondrosarco-mas. The same series was subjected to genome-wide expression analysis to identify other signal transduc-tion pathways involved in chondrosarcoma progres-sion.
Material and methods
Patient material
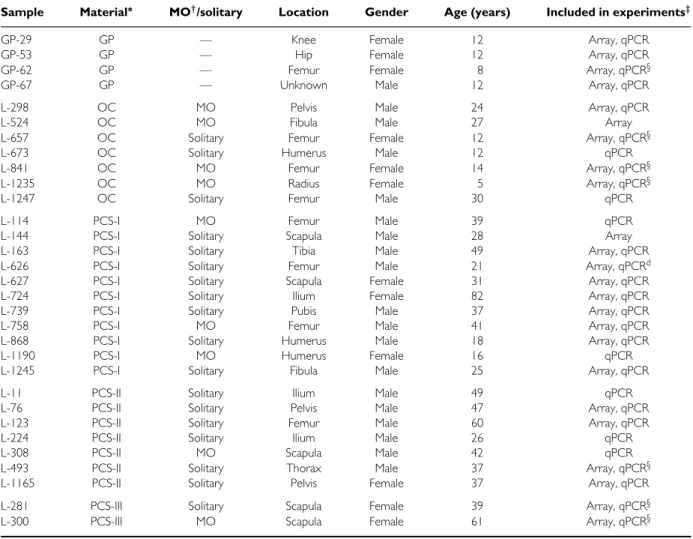
Fresh frozen samples were obtained from resected specimens (Table 1). Growth plates were acquired from resections or biopsies for orthopaedic clinical conditions not related to osteochondroma or chon-drosarcoma. All tissue samples were handled in a coded fashion, according to Dutch national ethical guidelines (‘Code for Proper Secondary Use of Human Tissue’, Dutch Federation of Medical Scientific Soci-eties).
RNA isolation
RNA was isolated from tumour samples that contained at least 70% tumour cells, as determined by haema-toxylin and eosin stained frozen sections, as described previously [26]. From L-493, RNA was isolated from two different parts of the tumour (one part correspond-ing to a low-grade area and the other with high-grade morphology), to investigate possible differences in gene expression within one tumour.
Table 1.Clinicopathological and tumour data
Sample Material∗ MO††/solitary Location Gender Age (years) Included in experiments‡‡
GP-29 GP — Knee Female 12 Array, qPCR
GP-53 GP — Hip Female 12 Array, qPCR
GP-62 GP — Femur Female 8 Array, qPCR§
GP-67 GP — Unknown Male 12 Array, qPCR
L-298 OC MO Pelvis Male 24 Array, qPCR
L-524 OC MO Fibula Male 27 Array
L-657 OC Solitary Femur Female 12 Array, qPCR§
L-673 OC Solitary Humerus Male 12 qPCR
L-841 OC MO Femur Female 14 Array, qPCR§
L-1235 OC MO Radius Female 5 Array, qPCR§
L-1247 OC Solitary Femur Male 30 qPCR
L-114 PCS-I MO Femur Male 39 qPCR
L-144 PCS-I Solitary Scapula Male 28 Array L-163 PCS-I Solitary Tibia Male 49 Array, qPCR L-626 PCS-I Solitary Femur Male 21 Array, qPCRd
L-627 PCS-I Solitary Scapula Female 31 Array, qPCR L-724 PCS-I Solitary Ilium Female 82 Array, qPCR L-739 PCS-I Solitary Pubis Male 37 Array, qPCR
L-758 PCS-I MO Femur Male 41 Array, qPCR
L-868 PCS-I Solitary Humerus Male 18 Array, qPCR
L-1190 PCS-I MO Humerus Female 16 qPCR
L-1245 PCS-I Solitary Fibula Male 25 Array, qPCR
L-11 PCS-II Solitary Ilium Male 49 qPCR
L-76 PCS-II Solitary Pelvis Male 47 Array, qPCR L-123 PCS-II Solitary Femur Male 60 Array, qPCR
L-224 PCS-II Solitary Ilium Male 26 qPCR
L-308 PCS-II MO Scapula Male 42 qPCR
L-493 PCS-II Solitary Thorax Male 37 Array, qPCR§ L-1165 PCS-II Solitary Pelvis Female 37 Array, qPCR
L-281 PCS-III Solitary Scapula Female 39 Array, qPCR§
L-300 PCS-III MO Scapula Female 61 Array, qPCR§
∗GP=growth plate; OC=osteochondroma; PCS=peripheral secondary chondrosarcoma grade I, II or III. †MO=Multiple Osteochondromas.
‡Array=cDNA microarray; qPCR=quantitative reverse transcriptase PCR experiments.
Quantitative reverse transcriptase PCR (qPCR) For first strand cDNA synthesis, 1 µg of total RNA was reverse transcribed using AMV reverse transcrip-tase (Roche, Penzberg, Germany) with 100 ng primer (dT) 15 (Roche) and 50 ng random primers (Invitrogen Carlsbad, CA, USA), according to the manufacturer’s instructions.
qPCR reactions were performed as previously described [27] with PCR primers provided as shown in supplementary Table 1 (available at http://www.in-terscience.wiley.com/jpages/0022-3417/suppmat/path. 2008.html). Expression levels were normalized to four genes (CPSF6, GPR108, CAPNS1,andSRPR) selected from expression profiling experiments of peripheral and central [28] cartilaginous tumours, with the least variation between all samples using the geNorm pro-gramme [29]. Log2transformed normalized data were analysed in SPSS 11.0 (SPSS Inc, Chicago, IL, USA). Expression levels in human growth plates were compared with those in osteochondromas, low-grade (grade I) and high-grade (grades II and III) chondrosar-comas using one-way analysis of variance with Bon-ferroni correction. Spearman’s non-parametric correla-tion coefficients were computed for relacorrela-tions between expression levels and histological grade. Corrected p-values≤0.05 were considered significant.
cDNA microarrays
A custom-made cDNA microarray was used in order to include more genes involved in chondrogenesis. The list of cDNA clones is available upon request. Array production, hybridization, and image acquisition procedures were performed as described previously [28]. In brief, tumour and growth plate samples were hybridized against a common reference panel of cell lines [28,30]. For hybridization, 1µg of sample total RNA and 1µg of reference panel total RNA were used to generate biotin- and fluorescein-labelled cDNA, using the Micromax TSA labelling kit (Perkin Elmer, Wellesley, MA, USA). Hybridized slides were scanned with a GeneTac LSV scanner (Genomic Solutions, Ann Arbor, MI, USA). Experimental quality was checked by labelling and hybridizing five samples in duplicate, either as experimental duplicates (n=2) or as dye swaps (n =3).
Data analysis
Signal intensities were recorded and quantified with Genepix Pro 4.1 software (Axon Instruments, Union City, CA, USA). A Microsoft Excel macro [28] was previously created to select bona fide spots systematically, normalize these by dividing by the median of all bona fide spots, and log transform the normalized spots.
Analysis was performed for genes expressed in at least 70% of samples. Unsupervised hierarchi-cal clustering (with ‘complete linkage’ and ‘correla-tion’) was performed with Spotfire Decisionsite soft-ware for functional genomics (Somerville, MA, USA).
Two methods for group comparison were used. The first method (corrected t-test method) used the log-transformed ratios of the Excel macro. P-values were calculated by a two-sided Student’st-test with unequal variance and corrected for multiple testing using the step-up procedure with a false discovery rate of 10% [31]. The second method was the Limma (Linear mod-els for Microarray Data) package [32], because of its excellent performance in microarray analysis. Limma used the raw Genepix data for within-array print-tip loess normalization of intensities after the same cri-teria for spot selection were applied, as described in the Excel macro [28]. Identities of differentially expressed, spotted clones were verified by sequencing the PCR products.
Differentially expressed genes were selected for verification by either qPCR or immunohistochemistry. The microarray series could be expanded with seven extra tumours (Table 1) for qPCR analysis.
Immunohistochemistry
Expression of JUNB (antibody sc-8051, Santa Cruz Biotechnology Inc, Santa Cruz, CA, USA, dilution 1 : 150) and PAI1 (SERPINE1 protein; antibody No 3785, American Diagnostica, Stanford, CT, USA, dilution 1 : 350) was evaluated in 18 osteochondromas, 39 chondrosarcomas, and 12 human growth plates. Staining and scoring of 4 µm sections of formalin-fixed, paraffin-embedded material was performed as described [24]. Staining intensity was compared with internal positive controls: osteoblasts and osteoclasts for JUNB, blood vessels and connective tissue for PAI1.
Activity of TGF-β signalling and Wnt signalling was investigated by the presence of either nuclear phosphorylated Smad2 (PS2 antibody, kindly donated by P ten Dijke [33], dilution 1 : 2000) expression or nuclear β-catenin (clone 14, BD Biosciences, Erembodegem, Belgium, dilution 1 : 800) expression. Osteoblasts served as positive internal control for PS2, and osteoblasts and blood vessels forβ-catenin.
A χ2 test and Spearman’s non-parametric correla-tion were used in the statistical analysis. Values of p ≤0.05 were considered significant.
Results
qPCR to detect mRNA expression of IHH signalling molecules
Table 2.Log2 transformed relative expression data of IHH signalling molecules in qPCR
Growth plate Osteochondroma Osteochondroma Low grade PCS∗
Low-grade
PCS vs High grade PCS
High-grade PCS vs
(n=4) (n=6) vs growth plate growth plate growth plate
Genes Median††±SD Median±SD p-value‡‡ n Median±SD p-value n Median±SD p-value
IHH 10.94±2.44 9.08±2.62 1.000 9 10.34±2.88 1.000 9 7.19±2.65 0.166 PTCH 10.74±0.54 10.22±0.73 1.000 10 9.24±1.38 0.039 10 7.80±1.11 0.001 SMO 10.22±0.49 10.33±0.36 1.000 10 10.50±0.66 1.000 10 9.73±1.34 0.554 GLI1 9.80±0.23 9.43±0.75 1.000 10 8.49±1.04 0.235 10 8.37±1.35 0.043 GLI2 11.10±0.93 9.87±0.73 0.567 10 9.17±1.23 0.015 10 8.62±1.59 0.002 GLI3 9.65±0.22 8.91±0.71 1.000 10 9.04±0.70 1.000 10 9.16±1.00 0.475 PTHLH 7.44±0.83 6.08±1.11 0.620 10 5.68±1.08 0.474 10 4.95±1.89 0.206
∗PCS=peripheral chondrosarcoma.
†Median=median log transformed expression level of the group. ‡P-value after Bonferroni correction.
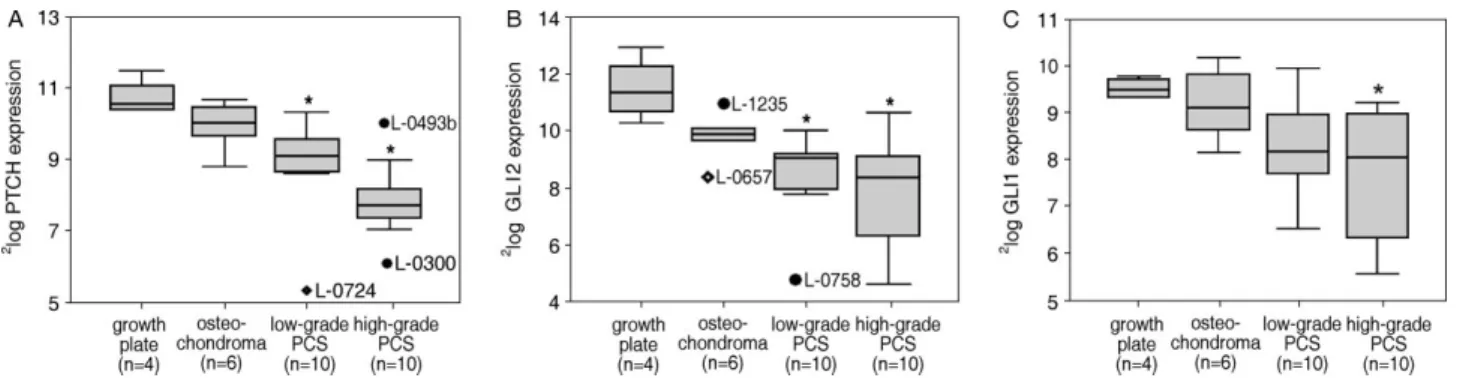
Figure 2.qPCR results of IHH signalling molecules. (A– C) Log-transformed relative mRNA expression levels in growth plate, osteochondromas, and low-grade and high-grade chondrosarcomas represented in boxplots of (A)PTCHexpression, (B)GLI2
expression, and (C)GLI1expression. *Significantly lower expression compared with growth plate (p<0.05). Diamonds=extreme values; filled circles=outliers; PCS=peripheral chondrosarcoma
(p=0.006) and was reduced in low-grade chondrosar-comas (p =0.015). Expression of both GLI2 and GLI1 was even lower in high-grade tumours than in growth plate (p =0.002 and p=0.043, respectively; Figure 2B and C). GLI1 expression correlated with GLI2 expression (r =0.584,p=0.02).GLI3 expres-sion was not affected in tumours (Table 2).
Increasing histological grade correlated negatively to the expression ofPTCH (r = −0.600, p=0.001), GLI1 (r = −0.458, p =0.018), and GLI2 (r =
−0.457, p=0.019), suggesting gradual downregu-lation of IHH signalling during tumour progression (Figure 1B). Expression of PTCH (r = −0.810, p < 0.001), GLI1 (r = −0.524, p=0.006), and GLI2 (r = −0.421, p =0.032) correlated negatively with patient age (supplementary Figure 1, available at http://www.interscience.wiley.com/jpages/0022-3417/ suppmat/path.2008.html), gradually diminishing over 40 years. Using age as a covariate in the analysis, the difference in expression between growth plates and chondrosarcomas was only significant for GLI2 (p=0.034).
For the grade II chondrosarcoma L-493, two sepa-rate tissue samples were used. Expression data from the matrix-rich sample were similar to those of low-grade tumours, while results from the more cellular and myxoid sample corresponded to those of high-grade chondrosarcomas. PTHLH mRNA expression
was present in all tumours. PTHLH protein expres-sion data, as determined previously [24], was available for four osteochondromas and 14 chondrosarcomas, and correlated with the mRNA expression (r =0.53,
p =0.01).
Expression profiling
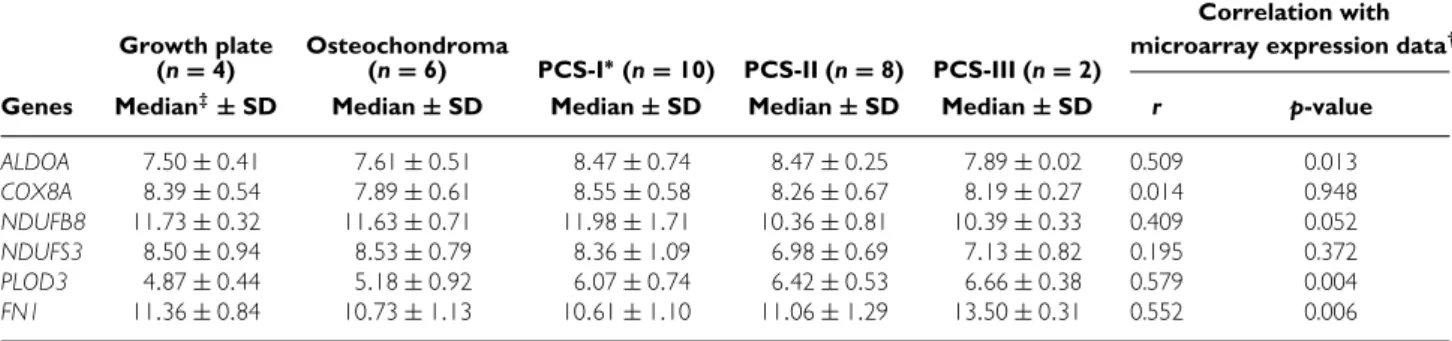
Table 3.Log2 transformed normalized expression levels for verification of microarray data
Growth plate Osteochondroma
Correlation with microarray expression data†† (n=4) (n=6) PCS-I∗(n=10) PCS-II (n=8) PCS-III (n=2)
Genes Median‡‡±SD Median±SD Median±SD Median±SD Median±SD r p-value
ALDOA 7.50±0.41 7.61±0.51 8.47±0.74 8.47±0.25 7.89±0.02 0.509 0.013 COX8A 8.39±0.54 7.89±0.61 8.55±0.58 8.26±0.67 8.19±0.27 0.014 0.948 NDUFB8 11.73±0.32 11.63±0.71 11.98±1.71 10.36±0.81 10.39±0.33 0.409 0.052 NDUFS3 8.50±0.94 8.53±0.79 8.36±1.09 6.98±0.69 7.13±0.82 0.195 0.372 PLOD3 4.87±0.44 5.18±0.92 6.07±0.74 6.42±0.53 6.66±0.38 0.579 0.004 FN1 11.36±0.84 10.73±1.13 10.61±1.10 11.06±1.29 13.50±0.31 0.552 0.006
∗PCS=peripheral chondrosarcoma.
†Correlation of qPCR expression data with microarray expression data available for four growth plates, four osteochondromas, eight grade I,
five grade II, and two grade III chondrosarcomas.
‡Median=median log transformed expression level of the group.
therefore not be optimally correlated to the qPCR results of these genes.
Limma analysis revealed 17 differentially expressed cDNA clones between osteochondromas and human growth plates (supplementary Table 2, available at http://www.interscience.wiley.com/jpages/0022-3417/ suppmat/path.2008.html). Fourteen clones were more highly expressed in osteochondromas, including multi-ple clones encoding the proto-oncogene jun B (JUNB) and several metallothionein 1 (MT1) genes.
We did not find any significantly differentially expressed genes in the comparison of osteochondroma and grade I chondrosarcoma.
A comparison of grade I and grade III chon-drosarcomas for analysis of tumour progression identified 79 differentially expressed genes with the corrected t-test method and 32 with the Limma package (supplementary Table 3, available at http://www.interscience.wiley.com/jpages/0022-3417/ suppmat/path.2008.html). Eleven genes were present in both analyses. Several genes involved in TGF-β signalling were upregulated in grade III chon-drosarcomas: fibronectin 1(FN1); serine (or cys-teine) proteinase inhibitor, clade E (nexin, plasmino-gen activator inhibitor type 1), member 1
(SER-PINE1); thrombospondin 1 (THBS1); and
cyclin-dependent kinase inhibitor 1A (CDKN1A, p21, CIP1). TGF-β1 was upregulated in high-grade chon-drosarcomas (supplementary Table 3, available at http://www.interscience.wiley.com/jpages/0022-3417/ suppmat/path.2008.html). Several genes involved in extracellular matrix remodelling were upregulated; among the downregulated genes (corrected t-testn= 23; Limman =5) were those encoding theα1 chains of type IX collagen(COL9A1) and type II colla-gen (COL2A1). Additionally, several genes encod-ing proteins involved in oxidative phosphorylation were downregulated in grade III chondrosarcomas. These included genes encoding NADH dehydroge-nase (ubiquinone) 1 β subcomplex, 8 (NDUFB8), a component of complex I, and cytochrome c oxidase subunit 8A (COX8A) of complex IV. Also, glycolytic enzyme aldolase C (ALDOC), part of the glycolysis,
was downregulated in grade III chondrosarcomas com-pared with grade I lesions.
qPCR verification of cDNA microarray results
To confirm the differences in mRNA expression of genes relevant to TGF-β signalling, extracellu-lar matrix, and oxidative phosphorylation found in the progression analysis, we performed qPCR on four genes representing these groups (Table 3). The qPCR results for FN1, PLOD3, and NDUFB8 corre-lated with the microarray expression data (p=0.006, p =0.004 and p =0.052, respectively). No correla-tion was found for COX8A (p=0.948). FN1 was upregulated in grade III chondrosarcomas compared with osteochondromas, and grade I and II chondrosar-comas (p =0.011, 0.014, and 0.012, respectively). Procollagen-lysine, 2-oxoglutarate 5-dioxygenase 3 (PLOD3) expression was significantly positively cor-related with increasing histological grade (r =0.506, p =0.008), whileNDUFB8 showed a negative corre-lation (r = −0.391, p=0.049). Additionally, mRNA expression of NADH dehydrogenase (ubiquinone) Fe-S protein 3 (NDUFFe-S3) of oxidative phosphorylation complex I, and aldolase A (ALDOA) of glycolysis were analysed. Similarly to NDUFB8, NDUFS3 expres-sion was negatively correlated with tumour progres-sion (r = −0.529, p =0.005). Expression of COX8
andALDOAdecreased with progression.ALDOAwas
upregulated in grade I chondrosarcomas in comparison with osteochondromas (p =0.024).
Immunohistochemical analysis of protein expression
SERPINE1 and JUNB microarray expression data
were verified by immunohistochemistry (Table 4). The sum score of PAI1 (SERPINE1 protein) cor-related with the mRNA expression (r =0.488, p= 0.047) and with increasing histological grade (r = 0.447, p<0.001, Figure 3A–C).
Figure 3. Immunohistochemical results. (A) Low-power view of an osteochondroma with weak PAI1 protein staining in less than 25% of the cells. Note the positive blood vessels, used as internal positive control; (B) a grade II chondrosarcoma with strong cytoplasmic PAI1 protein staining in 75 – 100% of the cells; (C) Boxplot of total scores from the semiquantitative scoring of PAI1 protein expression. There is a significant positive correlation between progression and PAI1 protein expression (r=0.447,
p<0.001). (D) Low-power view of an osteochondroma demonstrating weak nuclear JUNB protein expression in 25 – 50% of the cells; (E) grade I chondrosarcoma with moderate nuclear JUNB protein expression in 75 – 100% of the cells; (F) strong nuclear JUNB expression was found in most cells in this grade II chondrosarcoma. (G) Low-power view of a human epiphyseal growth plate with strong nuclear and cytoplasmic phosphorylated Smad2 staining in the proliferating and hypertrophic chondrocytes, whereas the resting chondrocytes are negative; (H) peripheral chondrosarcoma grade II with strong phosphorylated Smad2 expression in the majority of tumour cells. The same was observed in grade III chondrosarcomas (I)
Table 4.Immunohistochemistry results for PAI1 and JUNB
PAI1 JUNB††
Positive∗
Percent-age Positive∗
Percent-age
Growth plate 1/10 (0/2) 10 (0) Osteochondroma 9/18 (2/3) 50 (67) 5/13 (1/3) 38 (33) PCS grade I 15/23 (5/8) 65 (63) 7/22 (3/5) 32 (60) PCS grade II 12/13 (4/4) 92 (100) 7/12 (2/4) 58 (50) PCS grade III 3/3 (2/2) 100 (100) 3/3 (2/2) 100 (100)
∗Number of positive tumours/total number of tumours that could be
evaluated. Data for the tumours for which cDNA array analysis was also available are shown in parentheses.
†Five osteochondromas and nine chondrosarcomas could not evaluated
because the internal positive controls were negative.
in the microarray experiments, JUNB protein expres-sion correlated with the mRNA expresexpres-sion (r =0.544, p =0.016). Expression analysis revealed differential expression of JUNB mRNA between growth plate and osteochondroma. When comparing growth plates
and osteochondromas for JUNB protein expression, no difference was observed (Fisher’s exact test, p =0.179). The number of JUNB-positive tumours correlated significantly with increasing histological grade (χ2, linear-by-linear, p =0.005, Figure 3D–F, Table 4).
In human growth plates, both cytoplasmic and nuclear expression of phosphorylated Smad2 was observed in proliferating and hypertrophic chondro-cytes (Figure 3G). Expression was variable in rest-ing chondrocytes. Nuclear and cytoplasmic expression of phosphorylated Smad2 was observed in all osteo-chondromas and chondrosarcomas (Figure 3H and I), implicating active TGF-β signalling (Figure 1B).
tumours also included in the frozen series demon-strated a positive correlation between PTCH expres-sion and nuclear expresexpres-sion of β-catenin (r =0.567, p=0.006).
Discussion
This study shows that mRNA expression of IHH downstream targets is gradually downregulated dur-ing tumour progression in peripheral chondrosarcoma compared with normal growth plates, from which its benign precursor, osteochondroma, originates. Expres-sion of bothPTCH and GLI1, two genes transcribed upon activation of HH signalling [3], correlated neg-atively with increasing histological grade. This was also found for GLI2, which transduces the IHH sig-nal during endochondral bone development [34], but is not a known downstream target of IHH. Recently, GLI3 has been identified as a key effector of IHH sig-nalling during cartilage development [35], where IHH antagonizes the repressor activity of GLI3 on PTHLH expression and proliferation. However, in chondrosar-comas,GLI3 expression was similar to the expression seen in human growth plate (Table 2). Therefore, there was no indication that GLI3 plays a role in chondrosar-coma progression.
Recently, constitutively active IHH signalling was demonstrated in chondrosarcoma explants [36]. These contradictory results could be partly explained by the selection of housekeeping genes for qPCR analysis. This has been shown to be tissue type specific [29], which led us to choose genes based upon the expres-sion array results, instead of choosing random, non-tumour-specific genes, like GAPDH, which was not stably expressed in cartilaginous tumours. Also, no discrimination was made by Tietet albetween periph-eral and central-type chondrosarcomas, [36] even though it was previously shown that these subtypes clearly have a different genetic make-up [37,38] and other distinct pathways might be operative.
IHH signalling has been shown to be upstream of canonical Wnt signalling cascades required for osteogenic differentiation [39]. Wnt signalling appears to be involved in chondrogenic differentiation, since we could demonstrate decreased nuclear expres-sion ofβ-catenin during chondrosarcoma progression (Figure 1B). This intriguing potential relation between IHH and Wnt signalling in chondrogenesis needs fur-ther studies.
EXT1 and EXT2 are of importance for the diffu-sion of IHH to its receptor [9,14,40]. Consequently, there is a strong indication that IHH signalling is important in osteochondroma formation. Here we have demonstrated that the expression of IHH signalling in osteochondromas did not differ from the expression found in growth plates. Morphologically, osteochon-dromas strongly resemble the epiphyseal growth plate [10], and different zones of endochondral ossification can sometimes be distinguished. It was not technically
possible to dissect these different layers to investigate zone-specific expression of IHH signalling molecules. This probably also affects expression levels of genes that are only expressed in a specific layer.
Similar to growth plates, osteochondromas cease to grow after puberty [10]. Therefore, we investigated the putative relationship between mRNA levels of IHH signalling molecules in tumours and patient age, and demonstrated decreasing expression of PTCH, GLI1, and GLI2 over a period of 40 years. However, the observation that diagnosis correlates with age [41], and the distinct expression profiles of low-grade and high-grade tumours of patients with the same age (including the two samples from L-493), suggest that expression
ofPTCH, GLI1, andGLI2 does correlate with tumour
progression.
Despite inactivation of IHH signalling, there is active, IHH-independent PTHLH signalling in chon-drosarcomas (Figure 1B) [4,24]. This is similar to the finding in central chondrosarcomas [27], but not to murine growth plate, where IHH has been shown to directly regulate PTHLH expression [42]. Our results showed a discrepancy between PTHLH mRNA and previously published protein expression [24]. However
PTHLH mRNA has a very short half-life [43], making
it difficult to correlate protein and gene expression. A good candidate to activate PTHLH signalling in the absence of IHH is TGF-β, which can
regu-late PTHLH expression independently of IHH [44].
Genome-wide expression profiling experiments reveal-ed that tumour progression was indereveal-ed associatreveal-ed with upregulation of genes involved in TGF-β signalling, including TGF-β1, comparable to results found in other tumours [45]. Expression of FN1, SERPINE1,
and THBS1 was upregulated in grade III
chondrosar-comas (Tables 3 and 4). These genes are known down-stream targets of TGF-β signalling and are signifi-cant in regard to tumour invasion and metastasis [46]. Upregulation of the TGF-β downstream cell cycle inhibitor CDKN1A has previously been noted at the protein level [24]. The changes observed in extra-cellular matrix-related genes could also be regulated by TGF-β. Taken together, these results implied that TGF-β signalling is activated in high-grade chon-drosarcomas and this conclusion was supported by the presence of nuclear phosphorylated Smad2 in these tumours. Phosphorylated Smad2 was also present in osteochondromas and human growth plates. For the latter the expression pattern was similar to that of unphosphorylated Smad2 in rat epiphyseal growth plate [47]. One can hypothesize that in chondrosar-comas TGF-β activates specific target genes needed to acquire a malignant phenotype. The possibility cannot be excluded that some of these differentially expressed genes, likeTHBS1 and FN1, are the result of increased vascularization in high-grade chondrosar-comas [48,49].
cellular organization in comparison with osteochon-droma suggest loss of the IHH/PTHLH feedback loop (Figure 1). IHH signalling is a tightly controlled sig-nalling pathway. We observed that osteochondroma cells are still controlled by IHH and undergo endo-chondral ossification. As the osteochondroma ages, IHH signalling decreases, which was also seen in the growth plate [50], and all tumour cells will eventu-ally differentiate. One can hypothesize that tumour cells may escape from IHH control to transform into a malignancy, by switching to less controlled prolifer-ative signalling pathways, such as TGF-β signalling, thereby causing a cascade of events resulting in tumour progression (Figure 1B). To explore this hypothesis further, a model system would be helpful, but this is hampered by differences between humans and rodents, in which there is no closure of the growth plate at the end of sexual maturation [51].
Further analysis of the genome-wide expression studies revealed decreased expression of genes that encode proteins involved in oxidative phosphorylation and glycolysis in grade III chondrosarcomas com-pared with grade I chondrosarcomas. Glycolysis is upregulated in hypoxic environments, such as pauci-vascular osteochondromas and low-grade chondrosar-comas [10,15], giving cells a growth advantage [52]. High-grade chondrosarcomas show increased vascu-larization [48,49], which will raise oxygen availabil-ity and thereby abolish the need for glycolysis. This was reflected by the downregulation of ALDOA and
ALDOC in grade III chondrosarcomas.
Oxidative phosphorylation was simultaneously downregulated with glycolysis. In otherwise non-invasive C2C12 myoblasts, depletion of mitochon-drial DNA induces an invasive phenotype [53] and increases resistance to apoptosis, in part by upregulat-ing Bcl-2 [54]. High-grade chondrosarcomas have high Bcl-2 expression [24] and an increased risk of recur-rence and metastasis [15], consistent with an invasive phenotype.
The expression profiles of osteochondromas and grade I chondrosarcomas were indistinguishable. This distinction is also considered difficult at the histolog-ical level and is usually based on a combination of histological, radiological, and clinicopathological data [15]. Most likely the differences in gene expression are very subtle or only detectable at the protein level and cannot be detected with the method used.
Both qPCR and genome-wide expression profiling revealed similarities in gene expression between osteo-chondromas and human epiphyseal growth plates. However, JUNB (and to lesser extent FOSB) were more highly expressed in osteochondromas than in growth plates. JUNB and FOSB are members of the AP-1 transcription factor family, which has been implicated in endochondral ossification in mice [55,56]. Remarkably, we found very low levels of JUNB mRNA and protein in growth plates. JUNB can have a stimulatory effect on chondrocyte proliferation [55]. At the protein level, JUNB gradually increased
during malignant transformation and further progres-sion, which is consistent with its effect on prolifera-tion. This increase in JUNB expression might also be regulated by TGF-β [57].
In conclusion, IHH signalling controls the tight reg-ulation of growth plate organization and is still active in osteochondroma. However, IHH signalling is grad-ually inactivated during peripheral chondrosarcoma progression when tumour cells adapt to a more malig-nant phenotype (Figure 1B). TGF-β signalling can potentially regulate PTHLH signalling and concurrent remodelling of the extracellular matrix. Downregula-tion of genes involved in oxidative phosphorylaDownregula-tion and glycolysis accompanies the more invasive pheno-type of high-grade tumours.
Acknowledgements
We thank P ten Dijke for providing the PS2 antibody, A Yavas, PM Wijers-Koster, HJ Baelde, and HJ van Paassen for technical assistance; P Eilers for his help with statistical analysis; R van Eijk and T van Wezel for their assistance with the cDNA array experiments; and S Romeo for fruitful discussions. This study was financially supported by the Dutch Cancer Society (grant number: RUL 2002 – 2738), and presented at the 18th Annual Meeting of the European MusculoSkeletal Oncology Society (EMSOS), where it was awarded the EMSOS prize. The Department of Pathology, LUMC is partner of the EuroBoNeT consortium, a European Commission granted Network of Excellence for studying the pathology and genetics of bone tumours.
References
1. Nybakken K, Perrimon N. Hedgehog signal transduction: recent findings.Curr Opin Genet Dev2002;12:503–511.
2. Mullor JL, Sanchez P, Altaba AR. Pathways and consequences: hedgehog signaling in human disease. Trends Cell Biol 2002;12:562–569.
3. Ingham PW. Transducing hedgehog: the story so far. EMBO J 1998;17:3505–3511.
4. Amling M, Neff L, Tanaka S, Inoue D, Kuida K, Weir E, et al. Bcl-2 lies downstream of parathyroid hormone related peptide in a signalling pathway that regulates chondrocyte maturation during skeletal development.J Cell Biol1997;136:205–213.
5. Van der Eerden BCJ, Karperien M, Gevers EF, Lowik CWGM, Wit JM. Expression of Indian Hedgehog, PTHrP and their receptors in the postnatal growth plate of the rat: evidence for a locally acting growth restraining feedback loop after birth.J Bone Miner Res2000;15:1045–1055.
6. Hogendoorn PCW, Bov´ee JVMG, Karperien M, Cleton-Jansen AM. Skeletogenesis: genetics. In Nature Encyclopedia of the Human Genome, Cooper DN (ed). Nature Publishing Group: London, 2003; 306–313.
7. Duncan G, McCormick C, Tufaro F. The link between heparan sulfate and hereditary bone disease: finding a function for the EXT family of putative tumor suppressor proteins.J Clin Invest 2001;108:511–516.
8. Bov´ee JVMG, Hogendoorn PCW. Multiple osteochondromas. In World Health Organization Classification of Tumours. Pathology and Genetics of Tumours of Soft Tissue and Bone, Fletcher CDM, Unni KK, Mertens F (eds). IARC Press: Lyon, 2002; 360–362.
10. Khurana J, Abdul-Karim F, Bov´ee JVMG. Osteochondroma. In Multiple osteochondromas. In World Health Organization Classification of Tumours. Pathology and Genetics of Tumours of Soft Tissue and Bone, Fletcher CDM, Unni KK, Mertens F (eds). IARC Press: Lyon, 2002; 234–236.
11. Bov´ee JVMG, Cleton-Jansen AM, Wuyts W, Caethoven G, Taminiau AHM, Bakker E,et al. EXT-mutation analysis and loss of heterozygosity in sporadic and hereditary osteochondromas and secondary chondrosarcomas.Am J Hum Genet1999;65:689–698. 12. McCormick C, Duncan G, Goutsos KT, Tufaro F. The putative tumor suppressors EXT1 and EXT2 form a stable complex that accumulates in the golgi apparatus and catalyzes the synthesis of heparan sulfate.Proc Natl Acad Sci USA2000;97:668–673. 13. Simmons AD, Musy MM, Lopes CS, Hwang L-Y, Yang Y-P,
Lovett M. A direct interaction between EXT proteins and glycosyltransferases is defective in hereditary multiple exostoses. Hum Mol Genet1999;8:2155–2164.
14. The I, Bellaiche Y, Perrimon N. Hedgehog movement is regulated through tout velu -dependent synthesis of a heparan sulfate proteoglycan.Mol Cell1999;4:633–639.
15. Bertoni F, Bacchini P, Hogendoorn PCW. Chondrosarcoma. In Multiple osteochondromas. In World Health Organization Classification of Tumours. Pathology and Genetics of Tumours of Soft Tissue and Bone, Fletcher CDM, Unni KK, Mertens F (eds). IARC Press: Lyon, 2002; 247–251.
16. Bov´ee JVMG, Cleton-Jansen AM, Taminiau AHM, Hogendoorn PCW. Emerging pathways in the development of chondrosarcoma of bone and the implications for targeted treatment.Lancet Oncol 2005;6:599–607.
17. Evans HL, Ayala AG, Romsdahl MM. Prognostic factors in chondrosarcoma of bone. A clinicopathologic analysis with emphasis on histologic grading.Cancer1977;40:818–831. 18. Hahn H, Wicking C, Zaphiropoulous PG, Gailani MR, Shanley S,
Chidambaram A, et al. Mutations of the human homolog of Drosophila patched in the nevoid basal cell carcinoma syndrome. Cell1996;85:841–851.
19. Wolter M, Reifenberger J, Sommer C, Ruzicka T, Reifenberger G. Mutations in the human homologue of the Drosophila segment polarity gene patched (PTCH) in sporadic basal cell carcinomas of the skin and primitive neuroectodermal tumors of the central nervous system.Cancer Res1997;57:2581–2585.
20. Reifenberger J, Wolter M, Weber RG, Megahed M, Ruzicka T, Lichter P,et al. Missense mutations in SMOH in sporadic basal cell carcinomas of the skin and primitive neuroectodermal tumors of the central nervous system.Cancer Res1998;58:1798–1803. 21. Oniscu A, James RM, Morris RG, Bader S, Malcomson RD,
Harrison DJ. Expression of sonic hedgehog pathway genes is altered in colonic neoplasia.J Pathol2004;203:909–917. 22. Watkins DN, Berman DM, Burkholder SG, Wang B, Beachy PA,
Baylin SB. Hedgehog signalling within airway epithelial progeni-tors and in small-cell lung cancer.Nature2003;422:313–317. 23. Karhadkar SS, Steven BG, Abdallah N, Dhara S, Gardner D,
Maitra A, et al. Hedgehog signalling in prostate regeneration, neoplasia and metastasis.Nature2004;431:707–712.
24. Bov´ee JVMG, Van den Broek LJCM, Cleton-Jansen AM, Hogen-doorn PCW. Up-regulation of PTHrP and Bcl-2 expression char-acterizes the progression of osteochondroma towards peripheral chondrosarcoma and is a late event in central chondrosarcoma. Lab Invest2000;80:1925–1933.
25. Hameetman L, Kok P, Eilers PHC, Cleton-Jansen AM, Hogen-doorn PCW, Bov´ee JVMG. The use of Bcl-2 and PTHLH immunohistochemistry in the diagnosis of peripheral chon-drosarcoma in a clinicopathological setting. Virchows Arch 2005;446:430–437.
26. Baelde HJ, Cleton-Jansen AM, van Beerendonk H, Namba M, Bov´ee JVMG, Hogendoorn PCW. High quality RNA isolation from tumours with low cellularity and high extracellular matrix component for cDNA microarrays: application to chondrosarcoma. J Clin Pathol2001;54:778–782.
27. Rozeman LB, Hameetman L, Cleton-Jansen AM, Taminiau AHM, Hogendoorn PCW, Bov´ee JVMG. Absence of IHH and retention
of PTHrP signalling in enchondromas and central chondrosarco-mas.J Pathol2005;205:476–482.
28. Rozeman LB, Hameetman L, van Wezel T, Taminiau AHM, Cleton-Jansen AM, Hogendoorn PCW, et al. cDNA expression profiling of central chondrosarcomas: Ollier disease resembles solitary tumors and alteration in genes coding for energy metabolism with increasing grade.J Pathol2005;207:61–71. 29. Vandesompele J, De Preter K, Pattyn F, Poppe B, Van Roy N, De
Paepe A,et al. Accurate normalization of real-time quantitative RT-PCR data by geometric averaging of multiple internal control genes.Genome Biol2002;3:research0034.1–0034.11.
30. Scherf U, Ross DT, Waltham M, Smith LH, Lee JK, Tanabe L, et al. A gene expression database for the molecular pharmacology of cancer.Nat Genet2000;24:236–244.
31. Benjamini Y, Hochberg Y. Controlling the false discovery rate: a practical and powerful approach to multiple testing.J Roy Stat Soc, Ser B1995;289:289–300.
32. Smyth GK, Yang YH, Speed T. Statistical issues in cDNA microarray data analysis.Methods Mol Biol2003;224:111–136. 33. Persson U, Izumi H, Souchelnytskyi S, Itoh S, Grimsby S,
Engstrom U, et al. The L45 loop in type I receptors for TGF-beta family members is a critical determinant in specifying Smad isoform activation.FEBS Lett1998;434:83–87.
34. Mo R, Freer AM, Zinyk DL, Crackower MA, Michaud J, Heng HH,et al. Specific and redundant functions of Gli2 and Gli3 zinc finger genes in skeletal patterning and development.Development 1997;124:113–123.
35. Hilton MJ, Tu X, Cook J, Hu H, Long F. Ihh controls cartilage development by antagonizing Gli3, but requires additional effectors to regulate osteoblast and vascular development. Development2005;132:4339–4351.
36. Tiet TD, Hopyan S, Nadesan P, Gokgoz N, Poon R, Lin AC, et al. Constitutive hedgehog signaling in chondrosarcoma up-regulates tumor cell proliferation.Am J Pathol2006;168:321–330. 37. Bov´ee JVMG, Cleton-Jansen AM, Kuipers-Dijkshoorn N, Van den Broek LJCM, Taminiau AHM, Cornelisse CJ,et al. Loss of heterozygosity and DNA ploidy point to a diverging genetic mechanism in the origin of peripheral and central chondrosarcoma. Genes Chromosomes Cancer1999;26:237–246.
38. Bov´ee JVMG, van Royen M, Bardoel AFJ, Rosenberg C, Cor-nelisse CJ, Cleton-Jansen AM, et al. Near-haploidy and subse-quent polyploidization characterize the progression of peripheral chondrosarcoma.Am J Pathol2000;157:1587–1595.
39. Hu H, Hilton MJ, Tu X, Yu K, Ornitz DM, Long F. Sequential roles of Hedgehog and Wnt signaling in osteoblast development. Development2005;132:49–60.
40. Bornemann DJ, Duncan JE, Staatz W, Selleck S, Warrior R. Abrogation of heparan sulfate synthesis in Drosophila disrupts the Wingless, Hedgehog and Decapentaplegic signaling pathways. Development2004;131:1927–1938.
41. Mulder JD, Sch¨utte HE, Kroon HM, Taconis WK. Radiologic Atlas of Bone Tumors(2 edn). Elsevier: Amsterdam, 1993. 42. Vortkamp A, Lee K, Lanske B, Segre GV, Kronenberg HM,
Tabin CJ. Regulation of rate of cartilage differentiation by indian hedgehog and PTH-related protein.Science1996;273:613–622. 43. Sellers RS, Capen CC, Rosol TJ. Messenger RNA stability of
parathyroid hormone-related protein regulated by transforming growth factor-beta1.Mol Cell Endocrinol2002;188:37–46. 44. Ferguson CM, Schwarz EM, Puzas JE, Zuscik MJ, Drissi H,
O’Keefe RJ. Transforming growth factor-beta1 induced alter-ation of skeletal morphogenesis in vivo. J Orthop Res 2004;22:687–696.
45. Blobe GC, Schiemann WP, Lodish HF. Role of transforming growth factor beta in human disease. N Engl J Med 2000;342:1350–1358.
46. Berking C, Takemoto R, Schaider H, Showe L, Satyamoorthy K, Robbins P, et al. Transforming growth factor-beta1 increases survival of human melanoma through stroma remodeling.Cancer Res2001;61:8306–8316.
signaling components during endochondral ossification. J Bone Miner Res1999;14:1145–1152.
48. Geirnaerdt MJ, Bloem JL, Eulderink F, Hogendoorn PCW, Taminiau AHM. Cartilaginous tumors: correlation of gadolinium-enhanced MR imaging and histopathologic findings. Radiology 1993;186:813–817.
49. Ayala G, Liu C, Nicosia R, Horowitz S, Lackman R. Microvascu-lature and VEGF expression in cartilaginous tumors.Hum Pathol 2000;31:341–346.
50. Kindblom JM, Nilsson O, Hurme T, Ohlsson C, Savendahl L. Expression and localization of Indian hedgehog (Ihh) and parathyroid hormone related protein (PTHrP) in the human growth plate during pubertal development. J Endocrinol 2002;174:R1–R6.
51. Hughes PC, Tanner JM. The assessment of skeletal maturity in the growing rat.J Anat1970;106:371–402.
52. Gatenby RA, Gillies RJ. Why do cancers have high aerobic glycolysis?Nat Rev Cancer2004;4:891–899.
53. Amuthan G, Biswas G, Zhang SY, Klein-Szanto A, Vijaya-sarathy C, Avadhani NG. Mitochondria-to-nucleus stress signaling
induces phenotypic changes, tumor progression and cell invasion. EMBO J2001;20:1910–1920.
54. Biswas G, Anandatheerthavarada HK, Avadhani NG. Mechanism of mitochondrial stress-induced resistance to apoptosis in mitochondrial DNA-depleted C2C12 myocytes.Cell Death Differ 2005;12:266–278.
55. Eferl R, Wagner EF. AP-1: a double-edged sword in tumorigene-sis.Nat Rev Cancer2003;3:859–868.
56. Hess J, Hartenstein B, Teurich S, Schmidt D, Schorpp-Kistner M, Angel P. Defective endochondral ossification in mice with strongly compromised expression of JunB.J Cell Sci2003;116(Pt 22):4587–4596.