PREDICTORS OF E. COLI CONTAMINATION AT RURAL WATER POINTS IN KENYA, MALAWI, MOZAMBIQUE, UGANDA, AND ZAMBIA
Julian T. Oliver
A thesis submitted to the faculty at the University of North Carolina at Chapel Hill in partial fulfillment of the requirements for the degree of Master of Science in the Department of Environmental Sciences and Engineering in the Gillings School of Global Public Health.
Chapel Hill 2015
Approved by:
Jackie MacDonald Gibson J. Michael Bowling
iii ABSTRACT
Julian T. Oliver: Predictors of E. coli contamination at rural water points in Kenya, Malawi, Mozambique, Uganda, and Zambia
(Under the direction of Jackie MacDonald Gibson)
Little quantitative information is available on how institutional factors affect drinking water quality in rural sub-Saharan Africa. Data were collected on E. coli concentrations and management practices at 549 rural water points in Kenya, Malawi, Mozambique, Uganda, and Zambia. Water piped on the premises of the home had much lower odds of contamination than public taps, boreholes, dug wells, and springs. The presence of a trained technician marginally decreased the odds of contamination (OR=0.28, p=0.07). Among water points testing positive for E. coli, nearby technical support and fee collection systems were associated with significantly lower concentrations. The sanitary inspection score, previously recommended as a surrogate for water quality analysis, was uncorrelated with E. coli concentrations (Kendall’s tau=-0.063,
p=0.11). These results provide further evidence of the need for financial and institutional support to maintain water points and to aim for piped water as the gold standard.
ACKNOWLEDGEMENTS
v
TABLE OF CONTENTS
LIST OF TABLES ... vi
LIST OF FIGURES ... vii
LIST OF ABBREVIATIONS ... viii
CHAPTER 1: INTRODUCTION ...1
CHAPTER 2: METHODS ...2
2.1 Study Population ...3
2.2 Study Design ...3
2.3 Cluster Selection ...4
2.4 Household Selection ...4
2.5 Water Point Selection ...4
2.6 Data Collection ...5
2.6.1 Water Sampling ...5
2.7 Data Analysis ...5
2.7.1 Model Development ...6
2.7.2 Sanitary Inspection Analysis ...6
CHAPTER 3: RESULTS ...6
3.1 Descriptive Analysis ...8
3.1.1 Water Point Type and Sufficiency of Supply ...8
3.1.2 E. coli Concentrations ...8
3.2 Negative Binomial Logit Hurdle Model Analysis ...11
3.2.1 Logistic Regression Component of Hurdle Model Analysis ...11
3.2.2 Negative Binomial Component of Hurdle Model Analysis ...14
CHAPTER 4: DISCUSSION ...14
CHAPTER 5: CONCLUSIONS ...19
APPENDIX 1: WATER POINT QUESTIONNAIRE FOR WORLD VISION EVALUATION ...20
APPENDIX 2: PROTOCOL FOR WATER SAMPLE PROCEDURES ...26
REFERENCES ...28
vii
LIST OF TABLES
Table 1: Independent variables considered for analysis ...6 Table 2: Sanitary inspection questionnaire ...7 Table 3: Negative binomial logit hurdle model for water points ...13
LIST OF FIGURES
Figure 1. Water point types included in study sample ...8 Figure 2. WHO E. coli risk categories by country in percentage of water points ...9 Figure 3. Fraction of water points with and without specified characteristics ...10 Figure 4. Distance of technical support and distance of materials for repairs
in percentage of water points ...10
Figure 5. Sanitary inspection score vs. log10 of E. coli concentration ...15
ix
LIST OF ABBREVIATIONS
ADP Area Development Program
JMP WHO/UNICEF Joint Monitoring Programme for Water Supply Sanitation
MDG Millennium Development Goals
O&M Operation and Maintenance
PPS-WOR Probability Proportionate to Size Without Replacement
PSU Primary Sampling Unit
SSU Secondary Sampling Unit
WaSH Water, Sanitation, and Hygiene
WHO World Health Organization
CHAPTER 1: INTRODUCTION
In 2010, the Millennium Development Goal (MDG) of halving the proportion of the global population without sustainable access to drinking water between 1990 and 2015 was met. However, in 2014, the World Health Organization (WHO) reported that 11% of people in the world still do not have sustainable access to safe drinking water (WHO/UNICEF 2014). The lowest levels of drinking water coverage are in sub-Saharan Africa (WHO/UNICEF 2014).
People who have sustainable access to drinking water use water from what the WHO/UNICEF Joint Monitoring Programme for Water Supply Sanitation (JMP) calls an improved source1 (WHO/UNICEF 2014). However, due to the presence of microbial and chemical contamination, improved sources do not always supply safe water (Bain et al. 2014a). Bain et al. (2014b) estimated that “1.8 billion people globally use a drinking water source that suffers from fecal contamination.” Fecal contamination is considered by the WHO as the greatest threat to public health (WHO/UNICEF 2010).
Many studies have assessed the effectiveness of interventions for contamination of global water supplies. Kayser et al. (2014) found that post-construction support of small piped water systems improved water quality in El Salvador. Studies in South Africa and Nigeria found point-of-use interventions to be successful in improving water quality and lowering incidence of diarrhea (Abebe et al. 2014, Barzilay et al. 2011).
1 An improved drinking water source is one that, “by the nature of its construction and when
2
Foster et al. (2013) studied the management of rural water systems in Liberia, Sierra Leone, and Uganda to identify predictors of functionality. Factors associated with water system functionality included presence of a fee collection system, spare parts proximity, availability of a handpump mechanic, and women in key water committee positions. However, little quantitative information is available on how these institutional factors affect drinking water quality in rural sub-Saharan Africa.
This study evaluated associations between water system management practices and E. coli concentrations at rural drinking water points in Kenya, Malawi, Mozambique, Uganda, and Zambia. Factors assessed included the presence of local water committees, the gender
composition of those committees, the availability of spare parts, the presence of staff responsible for operating and maintaining the system and whether or not the staff were trained, the collection of fees for water use, and the type of water point (piped water, public tap, borehole, dug well, and others). In addition, this study evaluated whether a measure known as the sanitary inspection score, which was developed by the World Health Organization and others to predict drinking water contamination risk, is correlated with E. coli concentration. The sanitary inspection score is based on ten yes/no questions intended to determine the “possible hygiene risks that could affect the current and future quality of water supplies (WHO/UNICEF 2011).” The results of this study can inform community leaders, local public health organizations and government agencies, and international development organizations on strategies for improving the
CHAPTER 2: METHODS
2.1 Study Population
The data used in this study were collected as part of an evaluation of water, sanitation and hygiene (WaSH) programs led by World Vision. The programs are being carried-out in rural communities in ten countries2 in sub-Saharan Africa. World Vision has several area development programs (ADP) in each country. In addition to the data collected in these ADPs, data from adjacent or nearby “comparison areas” where World Vision is not operating were collected to assess the progress of World Vision-supported areas in comparison to these comparison areas. The data from water points in both of these subgroups were used in this study. The water points used in this study were identified in interviews with heads of households, who were asked to identify the primary functioning water point that they use and last used nonfunctioning water point.
2.2 Study Design
A population-based field study design was used for the World Vision evaluation in which interviews were conducted to gather data about water points in addition to households, schools, and health facilities. Water samples were also collected at each of these locations. This study used data collected from Kenya, Malawi, Mozambique, Uganda, and Zambia. The independent variables used in the model were selected based on our interest in their relationship with water quality at rural water points. The dependent variable, E. coli/100 ml, was chosen because it is a commonly used indicator of fecal contamination.
4 2.3 Cluster Selection
A multi-stage geographically clustered sample design was used to select households. A probability proportionate to size without replacement (PPS-WOR) sampling method (Stevens, 1958) was used to select clusters of households based upon well-delineated geopolitical area units. These clusters were the primary sampling units (PSU) and varied in size depending on the country in which they were located. In smaller countries, these clusters were selected in a single stage. In larger countries, clusters exceeding 200 households were selected using the first stage with a subsampling of smaller geographical units (segments) conducted in a second stage yielding secondary sampling units (SSU). Clusters of 100-200 households were ultimately selected. Consultants in each country were asked to select World Vision areas for study by overlaying area maps of PSUs on maps of the World Vision ADP boundary maps. Comparison areas were then selected from the enumeration districts outside of the ADPs. Ultimately, 56 clusters (PSUs) in World Vision areas and 56 clusters in the comparison areas were selected. 2.4 Household Selection
Consultants in each country created the household sampling frame by creating a map of every occupied housing unit in each selected cluster. Systematic sampling was then used to select a random sample of 25 households in each cluster to be interviewed. Systematic sampling entails sampling every Kth household on the list after a random starting point, in which the sampling interval (K) for each segment is based on the ratio of the total number of households in the segment and the designated number of selected households for the segment.
2.5 Water Point Selection
the last used nonfunctioning water point. The enumerators were responsible for locating the functioning and non-functioning water points mentioned in the interview so that the water at the water points could be sampled. GPS coordinates were taken at both the households and the water points.
2.6 Data Collection
The water or WaSH committees of identified water points were asked questions about the water point(s) they were responsible for. If a committee was not present, a community leader was interviewed. Enumerators recorded interviewee responses on a questionnaire form (Appendix 1) or on a mobile device if it was available (this varied by country). The questions asked that provided information for the independent variables used in this study were mostly asked in a “Yes,” “No,” or “Don’t Know” response format. When questions were asked about distance, a set of ranges was provided (e.g. 0-5 km, 5-10 km, etc.).
2.6.1 Water sampling
Enumerators used sterile Whirlpak® bags to collect water samples. Water samples were either tested immediately or stored according to protocol (Appendix 2) and tested off-site. 2.7 Data Analysis
A negative binomial logit hurdle model was used to perform regression analysis using Stata version 13.0 to identify relationships between a range of explanatory variables and E. coli
6
not detecting E. coli in a 100 ml sample. The negative binomial component of the model provides the expected number of E. coli in a 100 ml sample.
2.7.1 Model Development
A manual stepwise method was used to select the final model used in the analysis. A full model with all considered independent variables (Table 1) was run and the p values of both components of the model were observed. If any independent variable had a p value above 0.2 it was removed from the model. The final model includes only independent variables that had a p value below 0.2 in at least one component of the model.
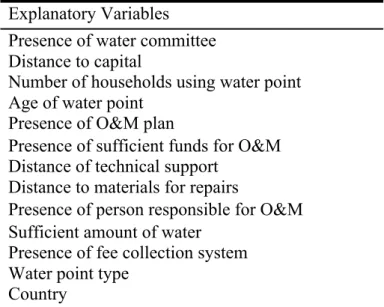
Table 1. Independent variables considered for analysis
Explanatory Variables Presence of water committee Distance to capital
Number of households using water point Age of water point
Presence of O&M plan
Presence of sufficient funds for O&M Distance of technical support
Distance to materials for repairs
Presence of person responsible for O&M Sufficient amount of water
Presence of fee collection system Water point type
Country
2.7.2 Sanitary Inspection Analysis
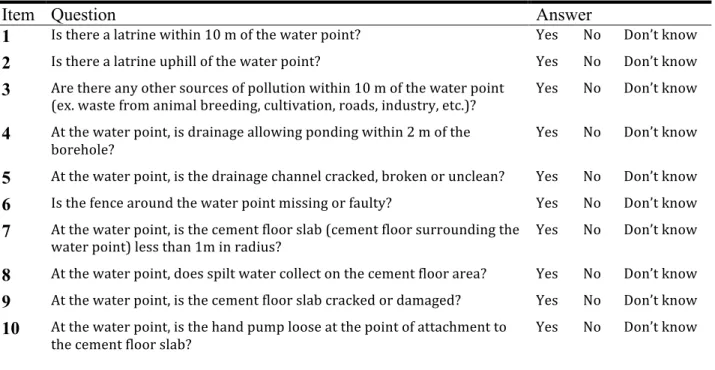
A separate analysis was conducted to determine the relationship between sanitary inspection scores of boreholes and E. coli concentration. A sanitary inspection score questionnaire was adapted from the WHO/United Nations Children’s Fund guide Rapid
Assessment of Drinking-water Quality: A Handbook for Implementation (Table 2). The
drainage channels). “Yes” answers indicate higher risk and are scored as “1,” while “no” answers are assigned a score of zero. Therefore, a score of 10 indicates the highest possible risk, and a score of zero represents the lowest possible risk. The total score out of ten was calculated for each borehole. The Kendall’s rank correlation between E. coli concentration and sanitary inspection score was then determined, and the significance of the correlation was assessed with the Kendall’s rank correlation test.
Table 2. Sanitary inspection questionnaire
Item Question Answer
1 Is there a latrine within 10 m of the water point? Yes No Don’t know
2 Is there a latrine uphill of the water point? Yes No Don’t know
3 Are there any other sources of pollution within 10 m of the water point
(ex. waste from animal breeding, cultivation, roads, industry, etc.)? Yes No Don’t know
4 At the water point, is drainage allowing ponding within 2 m of the
borehole? Yes No Don’t know
5 At the water point, is the drainage channel cracked, broken or unclean? Yes No Don’t know
6 Is the fence around the water point missing or faulty? Yes No Don’t know
7 At the water point, is the cement floor slab (cement floor surrounding the
water point) less than 1m in radius? Yes No Don’t know
8 At the water point, does spilt water collect on the cement floor area? Yes No Don’t know
9 At the water point, is the cement floor slab cracked or damaged? Yes No Don’t know
10 At the water point, is the hand pump loose at the point of attachment to
8
CHAPTER 3: RESULTS
3.1 Descriptive Analysis
3.1.1 Water Point Type and Sufficiency of Supply
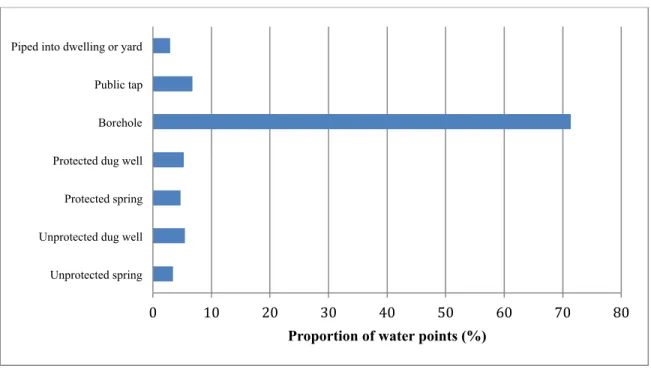
The majority of the water points in the study sample were boreholes (71.4%) (Figure 1). Public taps were the second-most represented water point type in the sample, making up 6.74% of the sample. The remaining water point types present made up less than 6% of the sample each. Notably, 24.5% of the water points lacked sufficient water to provide year-round service..
Figure 1. Water point types included in study sample (n=549)
3.1.2 E. coli Concentrations
The World Health Organization classifies the presence of E. coli /100 ml in four groups representing the degree of fecal contamination and potential risk to human health: low risk,
0 10 20 30 40 50 60 70 80
Unprotected spring Unprotected dug well Protected spring Protected dug well Borehole Public tap Piped into dwelling or yard
intermediate risk, high risk and very high risk. The majority of water points in each country were classified as low (Figure 2). Zambia had the highest percentage of water points classified as low risk (89.6%) and Kenya had the lowest percentage of water points classified as low risk (51.9%). Uganda had the lowest percentage of water points classified as very high risk (0.0%) and Kenya had the highest percentage of water points classified as very high risk (16.98%).
Figure 2. WHO E. coli risk categories by country in percentage of water points
3.1.3 Management Practices
To understand the degree to which different management structures are in place at water
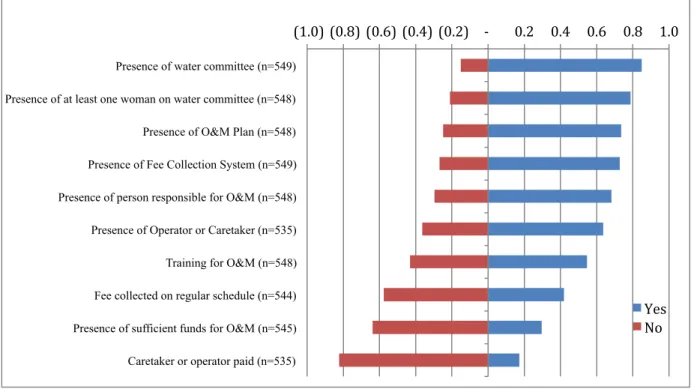
points in the five countries, descriptive statistics of questionnaire responses were analyzed. Most water points in the study sample were managed by a water committee (84.9%), and most of these committees (92.8%) had at least one woman member (Figure 3). A large proportion of water points had a caretaker or operator (63.6%), but most water points did not have a paid caretaker or operator (82.4%). The majority of water points in the study sample also had a person responsible for repairing and maintaining the water point (68.3%) and most water points had a person who
0.00 10.00 20.00 30.00 40.00 50.00 60.00 70.00 80.00 90.00 100.00
Low Risk (<1 cfu/100 ml)
Intermediate Risk (1-10 cfu/100 ml)
High Risk (11-100 cfu/100 ml)
Very High (>100 cfu/ 100 ml)
10
had received training in operation and maintenance (O&M) of the water point (54.7%). Water points in the study sample generally had a fee collection system in place (72.3%) and had a plan for O&M (73.5%). However, fees for water point use were not generally collected on a regular schedule (57.7%) and did not have sufficient funds for O&M (63.9%).
Figure 3. Fraction of water points with and without specified characteristics
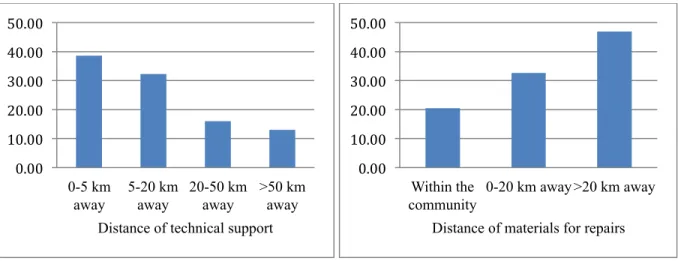
A majority of water points in the study sample were located between 0 and 20 km away from water point support for technical problems (70.6%) (Figure 4). However, a large proportion of water points in the study sample were located further than 20 km away from a place to obtain materials for water point repairs (46.9%).
(1.0) (0.8) (0.6) (0.4) (0.2) -‐ 0.2 0.4 0.6 0.8 1.0
Presence of water committee (n=549) Presence of at least one woman on water committee (n=548) Presence of O&M Plan (n=548) Presence of Fee Collection System (n=549) Presence of person responsible for O&M (n=548) Presence of Operator or Caretaker (n=535) Training for O&M (n=548) Fee collected on regular schedule (n=544) Presence of sufficient funds for O&M (n=545) Caretaker or operator paid (n=535)
Figure 4. Distance of technical support (n=523) and distance of materials for repairs (n=549) in percentage of water points
3.2 Negative Binomial Logit Hurdle Model Analysis
A negative binomial logit hurdle model was used to perform a regression analysis to find the association between E. coli detection and concentration, the management factors shown in Table 1, and demographic variables that may affect water quality.. Two management-related variables— presence of an O&M plan, and presence of sufficient funds for O&M—were
excluded from the final model, because their p values were above the inclusion criterion (p < .2). 3.2.1 Logistic Regression Component of Hurdle Model Analysis
Results from the logistic regression component (Table 3, columns 2-3) indicate factors
influencing whether or not a water point is likely to be contaminated with E. coli. The type of water point had the largest influence on the potential for contamination: in comparison to water
piped on the premises of a household, public taps and protected dug dwells and springs had the
highest odds of contamination (OR=2240, p<.001), public taps the second-highest odds
(OR=536, p=.003), unprotected dug wells and springs the third-highest odds (OR=262, p=.003),
and boreholes the fourth-highest odds (OR=67, p=.002). In general, water points that are closer
to technical support had higher odds of contamination than those that are more distant from
technical support. However, this relationship is statically significant only for water points that 0.00
10.00 20.00 30.00 40.00 50.00
0-5 km away
5-20 km away
20-50 km away
>50 km away Distance of technical support
0.00 10.00 20.00 30.00 40.00 50.00
Within the community
0-20 km away >20 km away
12
are >20 km from technical support, which had odds of contamination 10 (=1/0.10) times lower
than water points within 5 km of technical support (p=.026). Notably, water points that were
older were significantly less likely to be contaminated (OR=0.95, p=0.027). Among the five
countries, water points are most likely to be contaminated in Kenya and least likely to be
contaminated in Zambia.
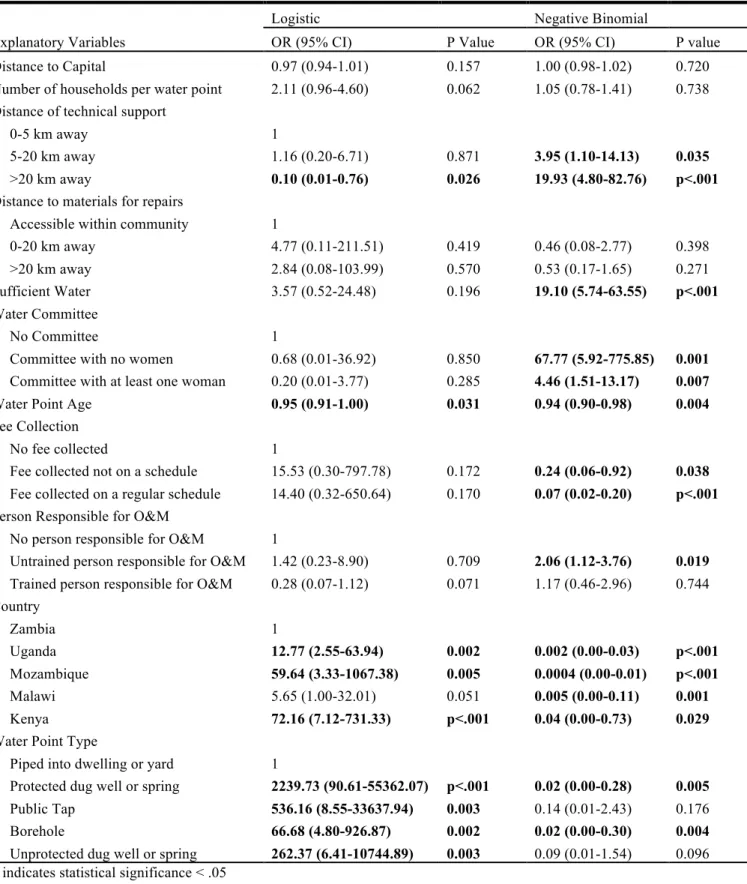
Table 3. Negative binomial logit hurdle model for water points
Explanatory Variables
Logistic Negative Binomial
OR (95% CI) P Value OR (95% CI) P value
Distance to Capital 0.97 (0.94-1.01) 0.157 1.00 (0.98-1.02) 0.720 Number of households per water point 2.11 (0.96-4.60) 0.062 1.05 (0.78-1.41) 0.738 Distance of technical support
0-5 km away 1
5-20 km away 1.16 (0.20-6.71) 0.871 3.95 (1.10-14.13) 0.035
>20 km away 0.10 (0.01-0.76) 0.026 19.93 (4.80-82.76) p<.001
Distance to materials for repairs
Accessible within community 1
0-20 km away 4.77 (0.11-211.51) 0.419 0.46 (0.08-2.77) 0.398 >20 km away 2.84 (0.08-103.99) 0.570 0.53 (0.17-1.65) 0.271 Sufficient Water 3.57 (0.52-24.48) 0.196 19.10 (5.74-63.55) p<.001
Water Committee
No Committee 1
Committee with no women 0.68 (0.01-36.92) 0.850 67.77 (5.92-775.85) 0.001
Committee with at least one woman 0.20 (0.01-3.77) 0.285 4.46 (1.51-13.17) 0.007
Water Point Age 0.95 (0.91-1.00) 0.031 0.94 (0.90-0.98) 0.004
Fee Collection
No fee collected 1
Fee collected not on a schedule 15.53 (0.30-797.78) 0.172 0.24 (0.06-0.92) 0.038
Fee collected on a regular schedule 14.40 (0.32-650.64) 0.170 0.07 (0.02-0.20) p<.001
Person Responsible for O&M
No person responsible for O&M 1
Untrained person responsible for O&M 1.42 (0.23-8.90) 0.709 2.06 (1.12-3.76) 0.019
Trained person responsible for O&M 0.28 (0.07-1.12) 0.071 1.17 (0.46-2.96) 0.744
Country
Zambia 1
Uganda 12.77 (2.55-63.94) 0.002 0.002 (0.00-0.03) p<.001
Mozambique 59.64 (3.33-1067.38) 0.005 0.0004 (0.00-0.01) p<.001
Malawi 5.65 (1.00-32.01) 0.051 0.005 (0.00-0.11) 0.001
Kenya 72.16 (7.12-731.33) p<.001 0.04 (0.00-0.73) 0.029
Water Point Type
Piped into dwelling or yard 1
Protected dug well or spring 2239.73 (90.61-55362.07) p<.001 0.02 (0.00-0.28) 0.005
Public Tap 536.16 (8.55-33637.94) 0.003 0.14 (0.01-2.43) 0.176
Borehole 66.68 (4.80-926.87) 0.002 0.02 (0.00-0.30) 0.004
Unprotected dug well or spring 262.37 (6.41-10744.89) 0.003 0.09 (0.01-1.54) 0.096 * indicates statistical significance < .05
14
3.2.2 Negative Binomial Component of Hurdle Model Analysis
Results from the negative binomial component (Table 3, columns 4-5) indicate factors
influencing the expected E. coli concentration at water points where contamination was found. In general, water points that are located further from technical support had higher expected E. coli concentrations than those that are closer to technical support. This relationship is significant for both water points that are located 5-20 km away from technical support (OR=3.95, p=.035)
and those located >20 km away from technical support (OR=19.93 p<.001). The type of water
point also influences expected E. coli concentrations. Boreholes had expected E. coli
concentrations 50 (=1/.02) times lower than piped water (p=.004) and protected dug wells and
springs had expected E. coli concentrations 50 times lower than piped water (p=.005), although these former sources are at much higher risk of contamination than piped water, as shown in the
logistic component of the hurdle model. In comparison to water points where no fee for water is
collected, expected E. coli concentrations were 4 (=1/0.24) times lower when a fee is collected irregularly and 14 (=1/.07) times lower when a fee is collected on a regular schedule. Expected
E. coli concentrations were also significantly higher when there was an untrained person responsible for repairs, in comparison to when no person was responsible for repairs.
Unexpectedly, E. coli concentrations were significantly higher when there was a committee present with or without at least one woman serving as a member. Among the five countries,
3.3 Sanitary Inspection Score Correlation Analysis
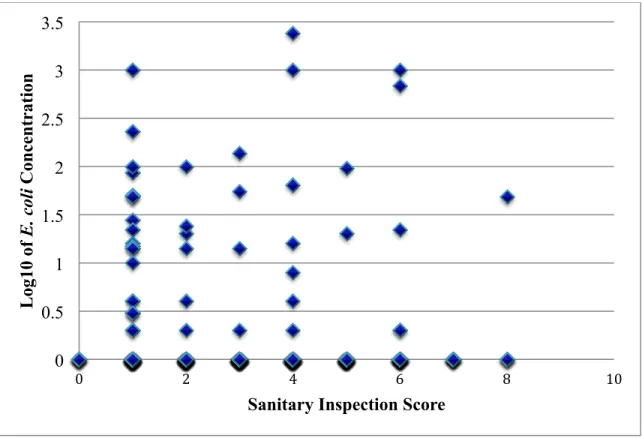
A correlation analysis was performed to determine the relationship between borehole
sanitary inspection scores and E. coli concentrations (Figure 3). Sanitary inspection score for boreholes and E. coli concentration were found to be uncorrelated (Kendall’s tau=-0.063, p=0.11).
Figure 5. Sanitary inspection score vs. log10 of E. coli concentration
0 0.5 1 1.5 2 2.5 3 3.5
0 2 4 6 8 10
Log10 of
E. c
ol
i
C
on
ce
n
tr
ati
on
16
CHAPTER 4: DISCUSSION
Our results suggest that the presence of certain management characteristics at rural water points influences the odds of detecting E. coli and the expected E. coli concentration at these water points. Many of the characteristics indicated as factors of interest were found to be
predictors of E. coli presence and concentration. These characteristics included the type of water point, distance from technical support, having a fee collected on a regular schedule, having a person responsible for O&M, having a sufficient amount of water supplied by the water point, water point age, and the presence of a water committee. Country was also a significant factor.
Water sources piped on the premises of a household were significantly less likely to have
E. coli present when compared to boreholes, public taps, protected dug wells and springs, and unprotected dug wells and springs. This finding is consistent with a study that found that on-plot piped water was able to provide safer water to connected households over other available
sources, including those sources meeting the definition of improved (Brown 2013).
Access to effective technical support, both within and outside of the community also significantly influences detection of E. coli and expected E. coli concentrations at water points. Water points that are closer to technical support have lower expected E. coli concentrations and
Cost recovery for water systems is also an important contributor to improved water quality. Water points that had a fee collected had significantly lower expected E. coli
concentrations than those that had no fee collection system in place. This finding is consistent with studies that have determined that cost recovery is necessary for effective O&M of rural water supplies to take place (Carter 1999, Harvey 2007, Carter 2010, Foster 2013). Water points that are effectively maintained experience improved water quality.
Some of our water point characteristics of interest were found to not significantly influence detection of E. coli and expected E. coli concentration. Proximity of water points to spare parts was found to be a significant predictor of handpump functionality in Sierra Leone (Sara 1998, Foster 2013). However, we did not find that distance to spare parts was a significant predictor of contamination.
Additionally, we did not find that sanitary inspection scores were correlated with E. coli
concentrations. This finding suggests that sanitary inspections cannot be used to predict water quality and should not be used alone in assessing water safety. Several previous studies have supported the use of sanitary inspections and microbiological analysis together to assess water safety and move forward with interventions due to the overall similarities in the results found when both methods are used (Lloyd and Bartram 1991, Etang 2001, Cronin 2006, Rawat 2007, Patrick 2011). However, other studies (for example, a study by Luby et al. in Bangladesh) also have found hat the sanitary inspection score is uncorrelated with measured water quality.
18
which has been linked to piped systems. When systems operate intermittently, they are at risk for microbial contamination due to loss of positive pressure causing back siphonage and infiltration (Basualdo 2000, Cotruvo 2000, Agard 2002, Lee 2005, Shaheed 2014). Brown et al. (2013) found that 100 percent of respondents whose household was connected to a piped water supply reported that intermittent service occurred regularly.
Water points located closer to technical support were also more likely to have E. coli
present. A possible explanation for this observation is that increasing distance of support may mean fewer local sources of fecal contamination due to decreased population density. Haque et al. (2013) found that increased population density was associated with groundwater pollution.
Finally, water points that had a committee present, with or without at least one woman serving as a member, were found to have significantly higher E. coli concentrations. This finding is inconsistent with studies that have suggested that having women in key positions on water committees contributes to higher rates of functionality for water points (Gross 2001, Foster 2013).
CHAPTER 5: CONCLUSIONS
The objective of this study was tostudy the factors associated with improved
20
APPENDIX 1: WATER POINT QUESTIONNAIRE FOR WORLD VISION EVALUATION
WV-‐UNC Water Point Evaluation Form
Instructions: A sample of functioning and non-‐functioning water points in the communities will be selected and questions asked to the water/WaSH committee president. Each water point within a community should be assigned a gps point.
FIELD OFFICE
Interviewer’s code & name
……… ………
Completed Date: dd/mm
Team Leader ’s code & name
…… ……….
Checked Date: dd/mm
General Supervisor
………....
Checked Date: dd/mm
Data Entry Supervisor
………..
Entry Date: dd/mm
SECTION 1: IDENTIFICATION
1.01: SURVEY ZONE 1=WaSH ADP; 2=Non-‐WaSH ADP; 3=Control
zone
1.02: COUNTRY
1.03: REGION 1=Northern Region; 2=Upper East Region
(This is an example for Ghana. Alter these choices for each country.) 1.04: PROVINCE, STATE, OR ZONE
1.05: DISTRICT
1.06: AREA DEVELOPMENT PROGRAM (ADP)
1.07: COMMUNITY
1.08: GPS NUMBER
1.09: LANGUAGE 1=Dagbanli 2=Mampruli; 3=Kusal; 4=Frafra/Kasim 5=Likpakpaln/Basare; 6=Talen; 7=Nabt; 8=Other (specify)
(This is an example for Ghana. Alter these choices for each country.)
Water point number_______________ (list the number water point surveyed in the community)
Position of the interviewee__________________________________________
Who financed the construction of this water point (list organizations)?-‐ _______________________________-‐___________________________________________ -‐ _____________________________________
3. ACCESS TO SAFE WATER
3.01
What is drinking water point of drinking water? (Check box next to the appropriate category.)
Piped water into dwelling
Piped water into yard
Public tap
Borehole (with handpump/pump)
Protected dug well (closed)
Unprotected dug well (open)
Protected spring (closed)
Unprotected spring (open)
Rainwater
Water-‐selling cart or truck
Surface water
Bottled water or sachet
Other: ______________________
3.02 Has this water point had its water quality tested for levels (microbiological water quality)? E. coli Yes No Don’t know
3.03 Has this water point had its water quality tested for arsenic levels? Yes No Don’t know
3.04 Has this water point had its water quality tested for fluoride levels? Yes No Don’t know
3.08 Does the water point have continuous water service? Yes No Don’t know
3.09 Does the water point have a scheduled water service? Yes No Don’t know
3.10 Is the water point functioning? Yes No Don’t know
3.11.
If no to 3.10, what are the main reasons why the water
point is non-‐functional?
Financial
Fee Collection
Technical
Administrative
Other: ________________________
__
3.12 If no to 3.10, functional? how long has the water point been non-‐
_______-‐______ [days]
3.13 For what length of time was the water point nonfunctional during its last breakdown? _______________[days]
3.14 Has the water point broken down in the past year? Yes No Don’t know
3.15 If yes to 3.14, breakdown in the past two weeks? has your community water point had a Yes No Don’t know
22
to or cannot afford to use this water point? know
3.18 box next to the appropriate category.) If yes to 3.17, what do these people do to get water? (Check
Get water from a neighbor
Use an unimproved water source
Other: _______________________
4. WATER SYSTEM SUSTAINABILITY
4.01 What is the age of the water point?
4.02 What is the distance from your community to the district
capital? [________________] km
4.03 How many households use (d) this water point?
(If not functioning , questions are in parentheses for this
and subsequent quesitions) [________________] households
4.04 How many households are (were) registered users of the
drinking water point ? [________________] households
4.05 What type of hand pump is present? (Check box next to the appropriate category.)
Afridev
India Mark II
Kardia
Inkar
Other: ____________________________
4.06 Does (did) the water point have a water committee?
Yes No
4.07 If yes to 4.06, does (did) the water/WaSH committee
contain at least one woman? Yes No Don’t know
4.08 If yes to 4.06, how many meetings does (did) the
committee hold each month? [_______________] meetings
4.09 Does (did) the water point have a fee collection system?
Yes No Know Don’t
4.10 How many households in the community paid a water fee
the last time it was collected? [_______________] households Don’t know
4.11 What is (was) the price of water? (ex. USD per jerrycan,
USD per liter, USD per month, etc.) ______________USD ______________USD per month per liter
______________USD ____________ Other:
4.12 If there is (was) a technical problem that cannot be fixed on this water point, how far away is the support for the water system? (Check box next to the appropriate category.)
0-‐5 km away
5-‐20 km away
20-‐50 km away
>50 km away
4.13 Does (did) your community have a plan for operation and
maintenance of the water system? Yes No know Don’t
4.14 Does (did) your community have sufficient funds to support operation and maintenance or upgrades and
replacement materials for the water system in the future? Yes No
Don’t know
4.15 How far away are (were) the materials you use for water point repairs (ex. spare parts, tools, etc.)? (Check box next to the appropriate category.)
Accessible within the community
0-‐20 km away
4.16 Does (did) your water point have at least one person responsible for repairing and maintaining the water point and distribution system?
Yes No know Don’t
4.17 Does (did) your water point include at least one person who has been trained in operation and maintenance of the
water point and distribution system? Yes No
Don’t know
4.19 Is (was) there a sufficient amount of water from the water point available to your community throughout the entire year?
Yes No know Don’t
4.29a Were water or WaSH committee members (as indicated in
3.01) elected or appointed? Elected Apointed
No Committ
ee
4.30a Is (was) there an operator or caretaker of the water point?
Yes No Know Don’t
4.31a If yes to 4.30a, is (was) the operator/caretaker paid?
Yes No Know Don’t
4.32a If yes to 4.31a, how much is (was) she/he paid per
month? [_____________] USD
4.33a If yes to 4.30a, how many hours does (did) the operator
or caretaker work each month? [_______________] hours
4.34a What is (was)the minimum monthly wage in the country?
[_____________] USD
4.35a What are (were) the responsibilities of the water or WaSH committee ?
(Do not prompt. Check boxes next to all categories mentioned by respondent.)
Financial
Fee Collection
Technical
Administrative
Other: __________________________
4.36a Is (was)the water fee collected on a regular schedule?
Yes No know Don’t
DIRECT OBSERVATION FOR SUBSEQUENT QUESTIONS (see diagram below)
4.37a Is there a latrine within 10 m of the water point?
Yes No know Don’t
4.38a Is there a latrine uphill of the water point?
Yes No know Don’t
4.39a Are there any other sources of pollution within 10 m of the water point (ex. waste from animal breeding, cultivation, roads, industry, etc.)?
Yes No know Don’t
4.40a At the water point, is drainage allowing ponding within 2
m of the borehole? Yes No know Don’t
4.41a At the water point, is the drainage channel cracked, broken
or unclean? Yes No know Don’t
4.42a Is the fence around the water point missing or faulty?
Yes No know Don’t
4.43a At the water point, is the cement floor slab (cement floor
24
4.44a At the water point, does spilt water collect in the cement
floor area? Yes No know Don’t
4.45a At the water point, is the cement floor slab cracked or
damaged? Yes No know Don’t
4.46a At the water point, is the hand pump loose at the point of
attachment to the cement floor slab? Yes No know Don’t
LAST WATER QUESTION
4.23
Are there any other water points (hand pumps) in your community? (If surveys have not been facilitated around these water points, move to these water points when the interview is over).
Yes No Know Don’t
5. WATER SAMPLE
INSTRUCTIONS: Ask if you may obtain a water sample from the water point. Refer to the Water Testing Quality Protocol sheet for more information on methods for collection, labeling, etc.
5.01 What is the GPS waypoint for the primary community water point?
Lat: N _________ ° __________________’ (degrees,) Long: E _________ ° __________________’ (degrees,!)
Altitude: [_______________________] meters
5.02
Take a sample of the water from the water point. What is the concentration
of E. coli in a 100 mL water sample? [________________] cfu / 100 mL
5.03 What is the arsenic level in the water sample?
[_______________] mg/L
5.04
What is the fluoride level in the water sample?
[_______________] mg/L
Now, ask the water/WaSH committee respondent if they would be willing to answer a few questions about sanitation in their community?. . . .
6. ACCESS TO SANITATION
How are children's feces disposed of in this
community? (check all that apply) Child used toilet/latrine ____ ______
Put/rinsed into toilet or latrine______
Put/rinsed into drain or ditch______
Thrown into garbage bin or pile______
Left in the open______
Not applicable______
Don't know
Decline to state.__
6.01 On what date was the first community-‐led total
sanitation (CLTS) trigger activity performed here?
|____|____|/|____|____|/|____|____|____|____|
6.02 Who performed the first CLTS activity here? (Check
box next to the appropriate category.) Government World Vision
Other NGO
Other: ___________________________
6.03 Has your community been declared open defecation free (ODF)?
Yes No
6.04 If yes to 6.03, on what day was the community
declared ODF? (dd/mm/yyyy)
|____|____|/|____|____|/|____|____|____|____|
THE BELOW QUESTIONS ARE FOR THE ENUMERATOR.
10.01. Did the person answering the questions seem irritated or nervous during the interview?
Yes No
10.02. Did you feel that the respondent was being truthful?
Yes No
10.03. How would you rate the quality of this interview?
Good Fair Poor
10.04. How many people were present when you conducted this interview?
Number of family members: _________________________________________________
Number of non-‐family members: ____________________________________________
Total number: _________________________________________________________________
10.06. Other comments:
______________________________________________________________________________________________________________________________ ________________________________________________________________________________________________________
______________________________________________________________________________________________________________________________ _______________
26
APPENDIX 2: PROTOCOL FOR WATER SAMPLE COLLECTION
NOTE: The following protocol is taken from the Water Institute’s “Draft WaSH MEL Water Quality Testing Protocol” (Fisher, 2013).
5.1 Materials
Be sure you have the following materials for water sample collection before carrying out your surveys.
• Sterile Whirlpak® bags (or sterilized autoclavable bottles)
• Cooler with ice packs
• Permanent markers
• Latex or nitrile gloves
• Alcohol-based hand sanitizer
• Sterile distilled water (at least one fresh bottle per sample collector per day)
• Cold chain indicator strips such as 3M Monitor Mark® or similar
5.2 Procedure for Collection of Samples
1. Label each collected sample or field blank with sample ID, date and time using permanent marker.
2. For water point samples: use Water point ID as sample ID and add S for source water sample. For
household water samples, use community ID + H + Household number. When more than one sample of the same type is collected from a given source or household, label them using
sequential letters. Thus, the 2rd source water sample collected from source #1 in the community of Makalondi in Niger on July 1, 2013 at 1:15 PM would be labeled as follows:
MAK.N12.833.E001.686-001-S-B / 01.07.2013 / 13:15. The first household sample collected from household # 5 in the same community on July 1, 2013 at 1:15 PM would be labeled as follows: MAK.N12.833.E001.686-H-005-B / 01.07.2013 / 13:15.
3. Apply a fresh pair of gloves and sterilize hands with hand sanitizer.
4. For water samples for microbiological analysis:
a. Open labeled sterile 500-mL Whirlpak® bag (or other sterile sampling container) without
touching the lip or the inside of the bag/container.
b. For source samples: take sample directly from pipe, hose, or other source outlet; for
household samples, ask the female head of household to bring you a glass of water just as she would normally drink or serve it, and collect the sample in the sterile sample
container.
c. Fill container with sample without touching anything to the lip or the inside of the
container (no hands, pipes, glasses, or other objects of any kind).
d. If using a Whirlpak bag:
i. Whirl the bag quickly three times and pinch the sides closed.
ii. Twist the yellow tabs together to seal the bag shut.
e. Place sample container upright in cooler with ice.
5. For physical or chemical analysis of samples (ex. arsenic and fluoride testing):
a. For on-site analysis: collect as described above and test immediately.
b. For off-site analysis: collect samples not requiring acidification (fluoride, etc.) as
described above.
c. For samples needing to be acidified (arsenic, etc. if not to be tested immediately on-site),
d. Seal the containers.
e. Place upright in cooler with ice.
6. After collecting the last sample of the day, collect a field blank as follows:
a. Label sample container with Community or Household ID, BL for blank, and the date
and time using a permanent marker.
b. Open a fresh bottle of sterile distilled water without touching the mouth of the bottle.
c. Fill the sample container with sterile distilled water using the same procedure as rest of
samples.
5.3 Sample Storage and Transport (For off-‐site analysis only)
1. All samples should be analyzed immediately or stored inside secondary containers (clean and
sterile plastic bags) in a cooler with ice packs within 15 minutes of collection. The cooler temperature should not exceed 5 degrees C. Cooler temperature should be monitored with cold chain indicator strips such as 3M Monitor Mark® or similar.
2. Transport samples in cooler to laboratory for analysis within 12 hours.
3. The cold chain must remain unbroken during transport to the laboratory. If the temperature of a
batch of samples exceeds 5˚ C for a cumulative total of one hour or more, discard the batch of samples.
5.4 Chain of Custody (For central laboratory analysis only)
1. Every day, each field team transporting samples to a central laboratory for testing must obtain a
fresh chain of custody (COC) form when they check out their cooler.
2. The top portion of the COC form must be completed by the field team and transported with all
samples to the lab.
3. Any transfer of samples between field teams or between a field team and other workers must be
documented on the COC form.
4. No samples can be processed until the lab technicians verify that the cold chain has not been
broken and that the contents of the cooler match the COC form. Once these details have been verified, the lab technicians can sign off on the COC form to accept custody of the samples.
5. Once received by the laboratory, samples and cold chain indicators must be immediately
transferred to a refrigerator and must not exceed 5 degrees C. All samples must be processed within 12 hours of the time they are received by the laboratory.
6. If the total time between collection and analysis exceeds 24 hours, or the temperature of the
samples exceeds 5 degrees C for a cumulative total of one hour or more, all samples in the batch must be discarded, along with all analytical results for those samples.
28 REFERENCES
Abebe, L. S., Smith, J. a., Narkiewicz, S., Oyanedel-Craver, V., Conaway, M., Singo, A., … Dillingham, R. (2014). Ceramic water filters impregnated with silver nanoparticles as a point-of-use water-treatment intervention for HIV-positive individuals in Limpopo Province, South Africa: A pilot study of technological performance and human health benefits. Journal of Water and Health, 12, 288–300. doi:10.2166/wh.2013.185
Bain, R., Cronk, R., Hossain, R., Bonjour, S., Onda, K., Wright, J., … Bartram, J. (2014). Global assessment of exposure to faecal contamination through drinking water based on a
systematic review. Tropical Medicine & International Health : TM & IH, 19(8), 917–27. doi:10.1111/tmi.12334
Bain, R., Wright, J., Yang, H., Pedley, S., Gundry, S., & Bartram, J. (2012). Improved but not necessarily safe: water access and the Millennium Development Goals, (Harmon), 89–95. Retrieved from http://www.globalwaterforum.org/wp-content/uploads/2012/07/Improved-
but-not-necessarily-safe_Water-access-and-the-Millennium-Development-Goals_GWF1225.pdf?9d7bd4
Barzilay, E. J., Aghoghovbia, T. S., Blanton, E. M., Akinpelumi, A. a, Coldiron, M. E., Akinfolayan, O., … Quick, R. (2011). Diarrhea prevention in people living with HIV: an evaluation of a point-of-use water quality intervention in Lagos, Nigeria. AIDS Care, 23(3), 330–339. doi:10.1080/09540121.2010.507749
Carter, R. C., Harvey, E., & Casey, V. (2010). User financing of rural handpump water services.
In IRC Symposium 2010: Pumps, Pipes and Promises. IRC International Water and
Sanitation Centre The Hague.
Carter, R. C., Tyrrel, S. F., & Howsam, P. (1999). The Impact and Sustainability of Community Water Supply and Sanitation Programmes in Developing Countries. Water and
Environment Journal, 13(4), 292–296. doi:10.1111/j.1747-6593.1999.tb01050.x
Cronin, A. A., Breslin, N., Gibson, J., & Pedley, S. (2006). Monitoring source and domestic water quality in parallel with sanitary risk identification in Northern Mozambique to prioritise protection interventions. Journal of Water and Health, 4(3), 333–345. Retrieved from
https://auth.lib.unc.edu/ezproxy_auth.php?url=http://search.ebscohost.com/login.aspx?direc t=true&db=lhh&AN=20063190976&site=ehost-live&scope=site
Etang, B. B. (2001). Applicability and reliability of World Health Organisation Sanitary Survey (SS) method in borehole water quality analysis in Uyo. Global Journal of Pure and Applied Sciences, 7(3), 513–515. Retrieved from
Foster, T. (2013). Predictors of sustainability for community-Managed handpumps in sub-Saharan Africa: evidence from Liberia, Sierra Leone, and Uganda. Environmental Science & Technology, 47(21), 12037.
Gross, B., Wijk, C. van, Mukherjee, N., & Mundial, B. (2006). Linking sustainability with demand, gender and poverty: A study in community-managed water supply projects in 15 countries. In Knowledge management for change: a compilation of WSP publications (pp. 1–42). WSP.
Haque, S. J., Onodera, S. I., & Shimizu, Y. (2013). An overview of the effects of urbanization on the quantity and quality of groundwater in South Asian megacities. Limnology, 14, 135– 145. doi:10.1007/s10201-012-0392-6
Harvey, P. A. (2007). Cost determination and sustainable financing for rural water services in sub-Saharan Africa. Water Policy, 9(4), 373–391.
Kayser, G. L., Moomaw, W., Miguel, J., Portillo, O., & Grif, J. K. (2014). Circuit Rider post-construction support: improvements in domestic water quality and system sustainability in El Salvador. Journal of Water, Sanitation and Hygiene for Development, in press, 1–11. doi:10.2166/washdev.2014.136
Lloyd, B. J. (1991). Surveillance solutions to microbiological problems in water quality control in Developing Countries. Water Science and Technology, 24(2), 61.
Luby, S. P. (2008). Tubewell water quality and predictors of contamination in three flood-prone areas in Bangladesh. Journal of Applied Microbiology, 105(4), 1002.
Rawat, M., & Jakher, G. R. (2007). Assessment of water quality by sanitary inspection in Sikar District, Rajasthan. Flora and Fauna (Jhansi). Mamta Rawat: Department of Zoology, J. N. V. University, Jodhpur - 342 005 (Rajasthan), India.: Flora and Fauna. Retrieved from https://auth.lib.unc.edu/ezproxy_auth.php?url=http://search.ebscohost.com/login.aspx?direc t=true&db=lhh&AN=20083107683&site=ehost-live&scope=site
Sara, J., & Katz, T. (2005). Making Rural Water Supply Sustainable, Report on the Impact of Project Rules (UNDP-World Bank Water Sanitation Programme). Available on Http://www. Wsp. Org.
Shaheed, A. (2014). Water quality risks of “improved” water sources: evidence from Cambodia.
Tropical Medicine & International Health, 19(2), 186.
Stevens, W. L. (1958). Sampling Without Replacement With Probability Proportional to Size.
30
Whittington, D., Davis, J., Prokopy, L., Komives, K., Thorsten, R., Lukacs, H., … Wakeman, W. (2008). How well is the demand-driven, community management model for rural water supply systems doing? Brooks World Poverty Institute Working Paper, (22).
Who, & Unicef. (2014). Progress on sanitation and drinking-water - 2014 update. … Monitoring
Programme for Water Supply and Sanitation …, 1–78. doi:978 92 4 150724 0
WHO/Unicef (JMP). (2010). Report JMP Technical Task Force Meeting on Monitoring Drinking-water Quality, (November), 46. doi:10.1002/biot.201000346