Gene-Expression Profiling Suggests Impaired
Signaling via the Interferon Pathway in
Cstb
-/-
Microglia
Inken Körber1,2,3, Shintaro Katayama4, Elisabet Einarsdottir1,2,4, Kaarel Krjutškov4,5,
Paula Hakala1,2,3, Juha Kere1,2,4, Anna-Elina Lehesjoki1,2,3, Tarja Joensuu1,2,3*
1Folkhälsan Institute of Genetics, Helsinki, Finland,2Research Program’s Unit, Molecular Neurology, University of Helsinki, Helsinki, Finland,3Neuroscience Center, University of Helsinki, Helsinki, Finland, 4Department of Biosciences and Nutrition, Karolinska Institutet, Stockholm, Sweden,5Competence Centre on Health Technologies, Tartu, Estonia
Abstract
Progressive myoclonus epilepsy of Unverricht-Lundborg type (EPM1, OMIM254800) is an autosomal recessive neurodegenerative disorder characterized by stimulus-sensitive and action-activated myoclonus, tonic-clonic epileptic seizures, and ataxia. Loss-of-function mutations in the gene encoding the cysteine protease inhibitor cystatin B (CSTB) underlie EPM1. The deficiency of CSTB in mice (Cstb-/-mice) generates a phenotype resembling the symptoms of EPM1 patients and is accompanied by microglial activation at two weeks of age and an upregulation of immune system-associated genes in the cerebellum at one month of age. To shed light on molecular pathways and processes linked to CSTB defi-ciency in microglia we characterized the transcriptome of culturedCstb-/-mouse microglia using microarray hybridization and RNA sequencing (RNA-seq). The gene expression pro-files obtained with these two techniques were in good accordance and not polarized to either pro- or anti-inflammatory status. InCstb-/-microglia, altogether 184 genes were differ-entially expressed. Of these, 33 genes were identified by both methods. Several interferon-regulated genes were weaker expressed inCstb-/-microglia compared to control. This was confirmed by quantitative real-time PCR of the transcriptsIrf7andStat1. Subsequently, we explored the biological context of CSTB deficiency in microglia more deeply by functional enrichment and canonical pathway analysis. This uncovered a potential role for CSTB in chemotaxis, antigen-presentation, and in immune- and defense response-associated pro-cesses by altering JAK-STAT pathway signaling. These data support and expand the previ-ously suggested involvement of inflammatory processes to the disease pathogenesis of EPM1 and connect CSTB deficiency in microglia to altered expression of interferon-regu-lated genes.
a11111
OPEN ACCESS
Citation:Körber I, Katayama S, Einarsdottir E, Krjutškov K, Hakala P, Kere J, et al. (2016) Gene-Expression Profiling Suggests Impaired Signaling via the Interferon Pathway inCstb-/-Microglia. PLoS ONE 11(6): e0158195. doi:10.1371/journal. pone.0158195
Editor:Coro Paisan-Ruiz, Icahn School of Medicine at Mount Sinai, UNITED STATES
Received:February 18, 2016
Accepted:June 13, 2016
Published:June 29, 2016
Copyright:© 2016 Körber et al. This is an open access article distributed under the terms of the
Creative Commons Attribution License, which permits unrestricted use, distribution, and reproduction in any medium, provided the original author and source are credited.
Data Availability Statement:The microarray gene expression data are accessible in the Gene Expression Omnibus (GEO, NCBI,www.ncbi.nlm.nih. gov/geo/) repository (ID: GSE64823).
Funding:This study was funded by the Folkhälsan Research Foundation, the Sigrid Jusélius Foundation (http://www.sigridjuselius.fi/foundation), and Academy of Finland (project 137950) (http://www.aka.fi/en); and Epilepsiatutkimussäätiö (www.epilepsia.fi) and the Doctoral Programme in Biomedicine (http://www. helsinki.fi/dpbm) to I.K. Work in the J.K. laboratory was supported by the Swedish Research Council
Introduction
The neurodegenerative disease progressive myoclonus epilepsy of Unverricht-Lundborg type (EPM1, OMIM254800) is an autosomal recessive disease with onset between 6 and 16 years of age. It is characterized by progressive, stimulus-sensitive, and action-activated myoclonus, which is resistant to medication and severely impairs patients’everyday life [1]. In addition, the patients have tonic-clonic epileptic seizures and develop ataxia. Loss-of-function mutations in the cystatin B (CSTB) gene that encodes the cysteine protease inhibitor CSTB [2] underlie
EPM1. The mutations are associated with reducedCSTBmRNA as well as protein expression
[3,4]. CSTB is a cytoplasmic protein, enriched around lysosomes, and in undifferentiated cells, it has been detected also in nuclei [5]. The increased proteolytic activity of cathepsin B identi-fied in CSTB-deficient cerebellar granule neurons and of cathepsin B, L, and S in EPM1 patient lymphoblastoid cells implies that CSTB functions as a cathepsin inhibitiorin vivo[6,7]. CSTB has been linked to the protection of neurons from apoptosis [8] and oxidative stress [6], as well as regulation of cell cycle entry [9]. However, the underlying molecular mechanisms and how the loss of CSTB causes the phenotype of EPM1 remain unknown.
The CSTB-deficient (Cstb-/-) mouse [8] is a widely used model to study EPM1 disease path-ogenesis [10–14]. Its phenotype includes the characteristic symptoms of EPM1 patients: the mice develop myoclonus by one month and progressive ataxia by six months of age [8]. Con-sistent with findings in human patients [15–17], there is progressive atrophy, cortical thinning, and neuron and white matter loss in the brain ofCstb-/-mice affecting particularly the cerebel-lum and the thalamocortical system [8,14,16]. The earliest neuropathological finding in Cstb-/-mice is the activation of microglia, the resident tissue macrophages of the CNS, at two weeks of age. This is followed by the activation of astrocytes, myoclonus, and progressive neu-ronal degeneration from one month onwards [14]. Gene-expression profiling has revealed an
upregulation of genes associated with immune-system processes in the cerebellum ofCstb
-/-mice at one month, and led to the discovery of alterations in GABAergic signaling already at one week of age [18]. In detail, findings implying a diminished number of GABAergic pre- and postsynaptic terminals, decreased inhibition, and reduced ligand binding to theα6
-subunit-containing GABAAreceptors were identified in the cerebellum ofCstb-/-mice [18].
Interestingly, the morphology of activated microglia in youngCstb-/-mice resembles that of phagocytic brain macrophages and they develop thickened, branched processes at six months of age [14]. Moreover, the activation of microglia inCstb-/-mouse brain is dysfunctional, which manifests as an imbalance between pro-inflammatory and anti-inflammatory microglial polar-ization and as increased chemokine release and chemotactic activity, but possibly reduced anti-gen presentation and phagocytic capacity [19]. In order to gain insight into the molecular mechanisms underlying the abnormal microglial activation, we studied the transcriptional pro-file ofCstb-/-mouse microglia. Our data link CSTB deficiency to downregulation of the inter-feron-signaling pathway in microglia.
Materials and Methods
Ethics statement
The animal research protocols were approved by the Animal Ethics Committee of the State Provincial Office of Southern Finland (decision no. STU376A, STH660A, and STH524A).
Mice
Cstb-/-mice were obtained from The Jackson Laboratory (Bar Harbor, ME; 129-Cstbtm1Rm/J;
stock no. 003486) [8]. Age-matched wild-type mice of the same background were used as (http://www.vr.se/inenglish), the Karolinska Institutet
Distinguished Professor Award, Strategic Research Program funding on Diabetes to Karolinska Institutet (http://www.ki.se/en/srp-diabetes), and EU FP7-PEOPLE-2012-IAPP grant SARM (324509) (http:// www.ec.europa.eu/research). The funders had no role in study design, data collection and analysis, decision to publish, or preparation of the manuscript. Competing Interests:The co-author of this study Kaarel Krjutškov (KK) is an employee of Competence Centre on Health Technologies (CCHT), Tartu, Estonia and has worked as a guest researcher at Karolinska Institutet, Sweden. CCHT is a biotechnology company focused on research and product development in personal medicine, drug development and both human and veterinary reproductive medicine. CCHT supported in the author’s salary by using only money from the EU FP7-PEOPLE-2012-IAPP grant SARM (324509). Karolinska Institutet purchased every item at the catalogue price and none of the items were provided by CCHT as a gift. Thus, KK does not have any conflicts of interest to declare. This does not alter the authors’adherence to PLOS ONE policies on sharing data and materials.
controls. The mice were housed in the Center for laboratory animals at the University of Hel-sinki with a 12 h / 12 h light-dark cycle and access to food and water ad libitum.
Primary microglial cultures
Cultures of mixed glia cells were extracted from postnatal day 5 (P5) mice as described earlier [20] with slight modifications. Briefly, the P5 mice were euthanized carefully and without delay by decapitation and after the removal of meninges, the cortices were triturated and incubated
with 20% trypsin (TrypLE Express, Life technologies, Carlsbad, CA) and 20μg DNase (Roche
Diagnostics, Basel, Switzerland) for 20 min at 37°C, 5% CO2. Next, the cells were triturated 20
times, centrifuged (5 min at 1000 rpm), and, after resuspension, plated in fresh growth medium (DMEM / 2 mM L-glutamine / 10% FCS / 1% penicillin-streptomycin) to 1% poly-D-lysine (PDL) (Sigma-Aldrich, St. Louis, MO) coated T-75 tissue culture flasks. After shaking off the primary microglia from the mixed glia cells at confluency (225 rpm, 37°C for 2.5 h), the cells
were re-plated and the growth medium was changed after 1 h at 37°C, 5% CO2to fresh
medium containing 5 ng/ml mouse macrophage-colony stimulating factor (M-CSF, R&D Sys-tems, Minneapolis, MN). The purity of microglial cultures was assessed by indirect immuno-fluorescence with antibodies raised against the microglial marker F4/80 (AbD Serotec, Hercules, CA) and the astrocytic marker glial fibrillary acidic protein (GFAP) (DakoCytoma-tion, Santa Clara, CA).
RNA sample preparation for gene-expression profiling
Total RNA was extracted from cultured microglia of ten control and tenCstb-/-mice using the
PerfectPure RNA Cultured Cell kit (5 PRIME, Hilden, Germany). For each sample (five control and fiveCstb-/-total RNA samples) the microglia cells of two mice of the same genotype were pooled and the extracted RNA quality was controlled by chip-based capillary electrophoresis (Bioanalyzer 2100, Agilent, Santa Clara, CA). All samples had an RNA integrity number (RIN)
>7.5.
Transcriptome analysis by microarrays
Synthesis of cRNA from 100 ng total RNA per each of the fiveCstb-/-and control microglial samples and its hybridization to GeneChip Mouse Exon 1.0 ST arrays (Affymetrix Inc., Santa Clara, CA, USA) were performed at the Helsinki Biomedicum Biochip Center (Finland). The quality of each microarray was assessed by the Affymetrix GeneChip Operating Software (GCOS) (Affymetrix Inc.) and the raw data were imported into GeneSpring GX software Ver-sion 12 (Silicon Genetics, Incorporated, Redwood City, CA, USA) as an exon expresVer-sion exper-iment. The raw data were pre-processed by the RMA16 algorithm [21] considering only probes with the highest confidence level (‘core’), which are based on Reference Sequence (RefSeq) and full-length Genbank mRNAs as annotation sources. Probe summarization of the data was per-formed by the RMA algorithm, which includes background correction, normalization, and gene-level summarization. Shortly, the background was adjusted on a per-chip basis and the normalization on probe level was performed by quantile normalization. The probe level data of the perfect match (PM) values are summarized to exon-level probe sets and further to gene-level transcript clusters, resulting in one expression value for each gene covered by the array. Replicate samples of the same genotype were analysed in groups. Quality control on sample level was performed by principal component analysis (PCA) and two arrays (one control and
oneCstb-/-array), which were outliers, were removed from downstream analysis. The
expres-sion values of the genes were filtered based on the summarized expresexpres-sion data; the lowest 20th percentile of expression values was excluded from the analysis. For genes that had multiple
entries in the gene list, only the list entry with the highest expression in control samples was used for further analysis.
Expression values with an absolute fold change (FC)1.3 between control andCstb-/-were
considered differentially expressed. Statistical testing was done using T-test with unpaired unequal variance corrected with Benjamini-Hochberg multiple testing correction and an adjusted p-value<0.05 was considered significant. The microarray gene expression data are
accessible in the Gene Expression Omnibus (GEO, NCBI,www.ncbi.nlm.nih.gov/geo/)
reposi-tory (ID: GSE64823).
Transcriptome analysis by RNA-seq
Bulk-RNA transcriptome analysis of four technical replicates per each of the fiveCstb-/-and control microglial RNA samples was performed by the RNA-seq method, followed by the sin-gle-cell tagged reverse transcription (STRT) [22] protocol with modifications [23]. 10 ng of total RNA was converted to cDNA and amplified to form an Illumina-compatible library.
Arti-ficial ERCC RNA Spike-In Mix 1 (Life Technologies, USA) was diluted to 1:1000 and 1μl was
used to enable data normalization. In total, 25 PCR cycles were used, but as four base-pair unique molecular identifiers were applied, only the absolute number of unique reads was calcu-lated per analysed sample. The library was sequenced on one lane of Illumina HiSeq2000, fur-ther processed to fastq files by Casava 1.8.2 (both Illumina, San Diego, CA, USA), and quality control was performed using the STRTprep pipeline (https://github.com/shka/STRTprep) [23]. Briefly, the filtered sequence reads were aligned to the mouse UCSC genome mm9 [24],
the mouse ribosomal DNA repetitive unit (GenBank: BK000964), theE.coliynbA (GenBank:
EF011072 as negative control), and the ERCC spike-in RNAs by TopHat [25] with UCSC Known Genes (version from 23.06.15) [26] as transcriptome reference. In the data analysis, we
excluded the same two RNA samples (oneCstb-/-and one control sample) that were excluded
in the microarray analysis. The raw read frequencies are counts of the STRT reads, which
aligned within the 5’-UTR or up to 500 bp upstream of each protein-coding gene in the sample.
The normalized expression level is the raw read frequency divided by total read counts, which aligned to the ERCC spike-ins in the sample, as spike-in normalization. From all identified genes, a gene was considered expressed if more than two of the normalized expression values from all the technical repeats of the control andCstb-/-samples were greater than zero. The
genes differentially expressed between control andCstb-/-RNA samples were identified by
SAMstrt, with spike-in based normalization [27] and by their degree of fluctuation or variation [23]. We considered genes with a FDR q-value<0.01 and a significant fluctuation (adjusted p-value<0.01) as differentially expressed between control andCstb-/-samples.
Platform comparison
The platform comparison was performed between the expression data obtained by microarray and RNA-seq approach. The microarray gene expression values summarized by RMA16 were filtered for protein-coding genes using the current, protein-coding mouse (taxon ID: 10090) genes from NCBI Gene (version from 13.11.15) [28] and were compared to the normalized
gene expression values obtained by RNA-seq. Correlation was determined by Spearman’s rank
correlation coefficient.
Functional annotation of the transcriptome
Gene ontology (GO) terms enriched in the differentially expressed genes inCstb-/-microglia were identified using the web-based gene ontology enrichment analysis and visualization tool GOrilla (www.cbl-gorilla.cs.technicon.ac.il, version from 22.07.2015) [29,30]. A p-value
threshold of 0.001 was considered significant. Canonical pathways and upstream regulators enriched in the differentially expressed genes were identified using QIAGEN´s Ingenuity
Path-way Analysis (IPA, QIAGEN, Redwood City, US,www.qiagen.com/ingenuity, version from
22.07.15) in a Core analysis using the Fisher´s Exact test and a p-value<0.05 cutoff. In the core analysis, identified upstream regulators were ranked by a z-score, which reflected the probability that the regulator underlay the observed expression changes. The protein network was generated with the protein-protein interaction database Search Tool for the Retrieval of Interacting Genes/Proteins (STRING) 10 (www.string-db.org, version from 18.09.2015) [31] and illustrated with Cytoscape 3.2 [32].
Quantitative real-time PCR (qPCR)
Isolation of total RNA from cultured control andCstb-/-mouse microglia was performed using
the RNeasy Mini kit (Qiagen, Hilden, Germany) according to the manufacturer’s instructions.
For each sample, the RNA of 2–4 mice per genotype was pooled. The concentration and purity
of the RNA was assessed spectrophotometrically (ND-1000, NanoDrop Technologies, Wil-mington, DE) and RNA was transcribed to cDNA using the iScript cDNA Synthesis Kit (Bio-Rad Laboratories, Hercules, CA) according to the manufacturer’s instructions. Absence of genomic DNA in the RNA samples was determined by amplification of the ribosomal protein S15 by PCR. TaqMan Gene Expression assays (Applied Biosystems, Foster City, CA) were used for quantitative real-time PCR (qPCR), which was performed on an ABI Prism 7000
Sequence Detection System according to the manufacturer’s instructions. These TaqMan
Gene Expression Assays were used:mStat1(Mm00439531_m1),mIrf7(Mm00516793_g1),
mIrf9(Mm00492679_m1), andmTbp(Mm00446973_m1). DataAssist software Version 3.01 (Applied Biosystems) was used to perform relative quantification of the data using the compar-ative Ct (ddCt) method [33]. The Tata-binding protein (Tbp) transcript expression was used as endogenous control and statistical tests were performed using GraphPad Prism version 6.02
for Windows (GraphPad Software, La Jolla, California, USA,www.graphpad.com). Statistical
significance between control andCstb-/-samples was determined using the unpaired t-test with Welch’s correction and a significance level of p<0.05 was considered statistically significant.
JAK-STAT signaling pathway PCR assay
Total RNA was extracted from primary cultured microglia cells from control andCstb-/-mice
using the RNeasy Mini kit (Qiagen, Hilden, Germany) according to the manufacturer’s
instruc-tions. For each sample, the RNA of 3 mice per genotype was pooled. RNA concentration and purity was determined spectrophotometrically (ND-1000) and the mouse JAK/STAT Signaling
Pathway RT2Profiler PCR Array (Qiagen) was performed according to the manufacturer’s
instructions using the ABI Prism 7000 Sequence Detection System (Applied Biosystems).
Results
The majority of differentially expressed genes in
Cstb
-/-microglia are
downregulated
To generate a comprehensive transcript profile of CSTB-deficient microglia, we assessed gene expression changes betweenCstb-/-and control microglia with two different expression profil-ing methods, microarray analysis and RNA-seq.
First, we analyzed the microglia RNA samples by microarray using the Affymetrix Mouse Exon 1.0 ST arrays and identified 14 147 expressed transcript clusters. To pinpoint the relevant expression changes inCstb-/-microglia, we then focused on the transcript clusters with an
absolute FC of at least 1.3 and a corrected p<0.05, and detected 155 differentially expressed genes (DEGs;S1 Table). Of these, only four genes were upregulated (FC range: 1.3 to 1.8; high-est FC: lysophosphatidylcholine acetyltransferase 4 (Lpcat4)), and the majority, 151 genes, were downregulated (FC range: -9.3 to -1.3). The downregulated genes included several inter-feron-regulated genes, such as interferon-induced protein with tetratricopeptide repeats 1 (Ifit1, FC: -8.1), 2’-5’oligoadenylate synthetase-like 2 (Oasl2, FC: -6.6), and interferon regula-tory factor 7 (Irf7, FC: -5.3).
Second, we performed RNA-seq of the microglia RNA samples using the single-cell tagged reverse transcription (STRT) protocol [22]. After removal of redundant reads, which are gener-ated during PCR amplification, we obtained on average 2 129 122 (± 7.1%) total reads per sam-ple sequenced on one Illumina HiSeq2000 lane. Of these total reads, 1 884 590 (± 7%) per sample were mapped to the genome (mapped rate), 1 654 282 (± 7.1%) per sample were
mapped to coding sequence and 1 337 991 (± 7.5%) per sample were mapped to coding 5’
regions (S2 Table). In this analysis, we detected 11 222 genes with altered expression inCstb -/-microglia based on the variation in the number of sequence reads obtained from added RNA spike-ins by SAMstrt [27], which has been utilized to assess differential expression previously [34,35]. To focus on the significant differences, we considered only genes with a false discovery rate (FDR)<0.01 and a significant fluctuation (adjusted p-value<0.01), and 62 genes passed this criteria (S1 Table). Of these, four genes were upregulated (FC range: 1.8 to 4.8; highest FC:
serine peptidase inhibitor, clade B, member 10 (Serpinb10-ps)), and 58 genes were
downregu-lated (FC range: -200 to -2.2). Among the most downregudownregu-lated genes, a few were interferon-regulated genes, e.g.Oasl2(FC: -17.9), ISG15 ubiquitin-like modifier (Isg15) (FC: -11.9),Ifit3 (FC: -11.8), andIfit1(FC: -11.2).
Microarray and RNA-seq results are concordant
To investigate theCstb-/-microglia transcriptome, we examined the expression data in more
detail. In this analysis, we restricted the genes detected by microarray to protein-coding genes, because the standard procedure of STRTprep for differential expression and pathway analysis specifically targets protein-coding genes.
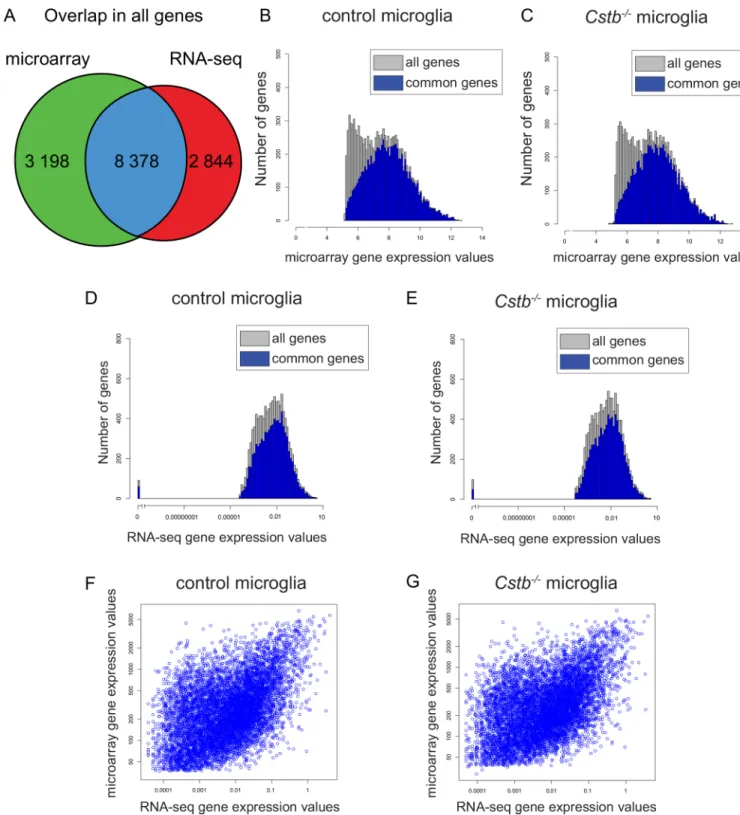
Overall, the total transcription profiling ofCstb-/-microglia provided expression data of 14 420 genes. Of these, 2 844 (20%) were identified only by RNA-seq, 3 198 (22%) were uniquely identified by microarray, and 8 378 (58%) were detected by both techniques (Fig 1A). Interest-ingly, genes that were identified to be differentially expressed only by one of the methods showed weaker expression than genes identified by both techniques (Fig 1B–1E). To explore the consis-tency between the microarray and the RNA-seq data, we determined the accordance between gene expression values, and found a moderate correlation both in control (Spearman´s rank cor-relation coefficient, SCC: 0.47) and inCstb-/-microglia (SCC: 0.45) (Fig 1F and 1G). To evaluate this further, we investigated, as a measure less dependent on the normalization method, also the correlation between the fold changes obtained by microarray and by RNA-seq (SCC: 0.51), which was comparable to the correlation between expression values.
Altogether, 184 genes are differentially expressed inCstb-/-microglia (S1 Table). We observed good accordance in DEGs identified by both methods, which was expected as the
number of polyadenylated transcripts in control andCstb-/-RNA samples was similar (589 and
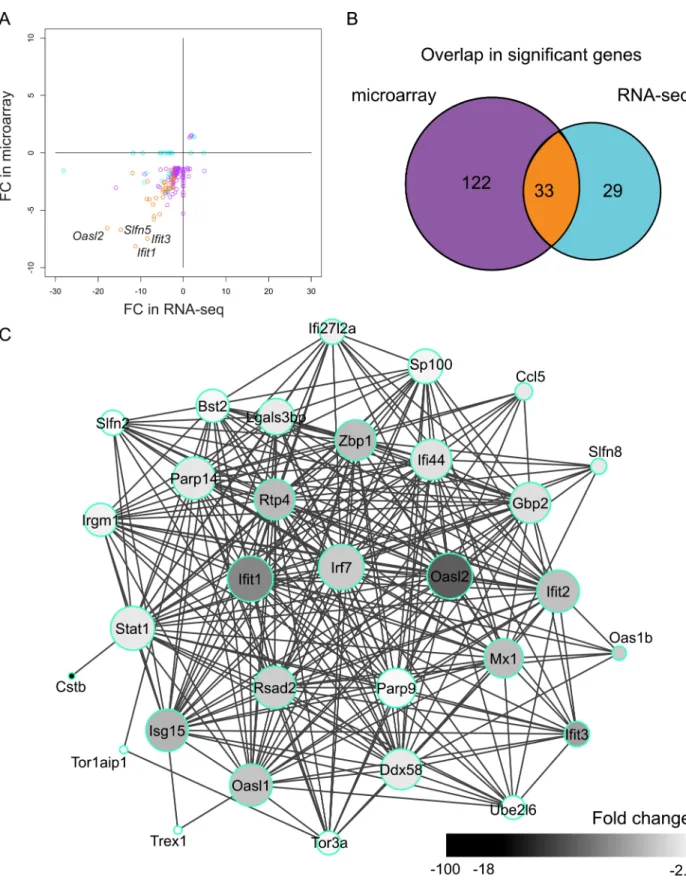
598 for 10 ng RNA, respectively). In addition, we observed good correlation between the fold changes of these genes (SCC: 0.73) (Fig 2A). Only six DEGs (3.2%) had different fold change directions. They were altered only in the microarray-based data, and were therefore probably false positive discoveries. Of the 184 DEGs inCstb-/-microglia, 33 (18%) genes were shared by
Fig 1. Gene expression values identified by microarray- and sequencing-based transcriptome profiling ofCstb-/-microglia.(A) Venn diagram illustrating the overlap in the number of genes identified by both methods (blue), only by microarray (green), or only by RNA-seq (red). (B– E) Distribution of microarray and RNA-seq gene expression values in control andCstb-/-microglia. The expression values of genes identified also
in the other method (blue bars) are higher than the expression values identified only by the microarray or the RNA-seq (grey bars). The number of genes with a specific gene expression value is depicted for (B) control and (C)Cstb-/-microglia in the microarray and for (D) control and (E)Cstb -/-microglia in the RNA-seq data. Scatter plot of the mean expression values for each gene of (F) control and (G)Cstb-/-samples identified by both
methods.
Fig 2. DEGs identified by microarray- and sequencing-based expression profiling ofCstb-/-microglia.(A) Scatter plot of the FCs of the differentially expressed genes (DEGs) identified by microarray and RNA-seq. DEGs common to both methods are depicted in orange, RNA-seq-specific DEGs in light blue, and microarray-specific DEGs in purple. (B) Venn diagram showing the overlap in the number of DEGs. The colors correspond to the colors in A. (C) Protein-protein interaction network of the 33 genes differentially expressed in microarray and RNA-seq. The size of each node is proportional to the number of its connections to other nodes and the color of each node illustrates the fold change of the gene it represents.
small, the overlap was significantly higher than expected (odds ratio = 132.2, p<2.2e-16 by Fisher’s Exact test for Count Data,S3 Table), and their gene expression levels were not lower than the levels of the non-overlapping DEGs (S1 Fig). They showed good accordance in their fold changes (SCC: 0.75) and formed a highly interconnected network (Fig 2C), in which for exampleIrf7,Ifit1,Oasl2, andStat1had central positions. In addition, 122 DEGs were altered uniquely in the microarray profiling. Of these, 98 (80%) were identified, but not altered, in the RNA-seq profiling. Moreover, 29 genes were changed only in the RNA-seq data and of these 13 (45%) were detected, but not altered, in the microarray profiling.
In summary, the analysis demonstrated good concordance between both technologies and provided a detailed and solid signature of CSTB deficiency in microglia.
RNA expression profiles indicate that microglia are neither pro- nor
anti-inflammatory polarized
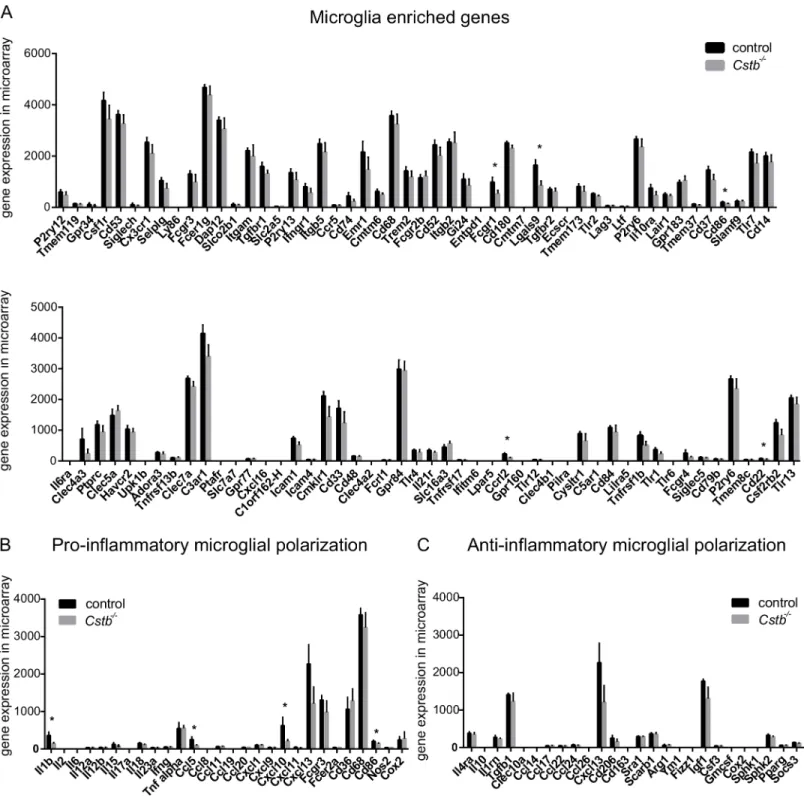
In order to assess how microglia-specific the transcription profiles of the control andCstb-/- sam-ples were compared to known microglial transcript expression profiles, we extracted from the microarray and the RNA-seq data the expression values of 100 genes that have been reported to be highly expressed in microglia [36]. In control andCstb-/-microglia, 81 of these genes were detected by microarray (Fig 3A) and 93 by RNA-seq profiling (S2A Fig). Of these genes, Fc gamma receptor 1 (Fcgr1), lectin, galactose binding, soluble 9 (Lgals9), CD86 antigen (Cd86), CD22 antigen (Cd22), and chemokine (C-C-motif) receptor-like 2 (Ccrl2) were downregulated in Cstb-/-microglia in the microarray data (marked with an asterisk inFig 3A) and C-type lectin domain family 4, member a3 (Clec4a3) in the RNA-seq data (marked with an asterisk inS2A Fig).
In general, microglia are very sensitive to disturbances, and react with morphological and gene expression changes to alterations in their environment. We therefore also evaluated the expression of markers for activation of control andCstb-/-microglia in the microarray and RNA-seq data. To achieve this, we focused on the expression levels of transcripts previously associated with pro-inflammatory or anti-inflammatory microglial polarization [37]. In control andCstb-/-microglia, genes linked to pro- and anti-inflammatory function were expressed, but the microglia were not polarized to either state (Fig 3B and 3C). The expression of only four
pro-inflammatory genes, namelyCd86, Interleukin 1β(Il1b), and chemokine (C-C motif)
ligand 5 (Ccl5) and chemokine (C-X-C motif) ligand 10 (Cxcl10), was significantly altered betweenCstb-/-and control microglia (marked with an asterisk inFig 2B) in the microarray andCcl5andCxcl13in the RNA-seq data (marked with an asterisk () inS2B and S2C Fig).
In conclusion, these data suggest that CSTB deficiency did not substantially alter the expres-sion of genes that were considered central for the transcriptional signature defining microglia cells or for the regulation of microglial activation.
Functional enrichment analysis indicates impaired immune-system
related functions in
Cstb
-/-microglia
To explore more deeply the biological context of the DEGs inCstb-/-microglia, we determined
their associated biological processes, molecular functions, and cellular locations using Gene Ontology (GO) enrichment analysis, which we performed separately for the microarray (S4 Table) and the RNA-seq data (S5 Table).
The most significantly enrichedbiological processesinCstb-/-microglia in both analyses included GO terms associated with immune and defense response, as well as interferon (INF) signaling. In addition, theCstb-/-microglia DEGs were implicated in processing and presenta-tion of antigens. This category comprised genes that are involved in generapresenta-tion of antigenic
translocation from cytoplasm into the endoplasmic reticulum (transporter 1, ATP-binding
cas-sette, sub-family B (MDR/TAP) (Tap1) and Tap binding protein (Tapbp)). Furthermore, we
identified GO terms linked to migration and chemotaxis exclusively in the RNA-seq results. Fig 3. Microarray expression values of genes associated with microglia or microglial activation in control andCstb-/-microglia.Microarray gene expression level of transcripts (A) reportedly enriched in microglia, (B) associated with pro-inflammatory, and (C) with anti-inflammatory activation of microglia determined in control (black bars) andCstb-/-(grey bars) microglia. The asterisk (*) marks genes significantly altered inCstb-/-microglia
compared to control microglia. Error bars represent standard deviation (SD). doi:10.1371/journal.pone.0158195.g003
This category included e.g. the cytokinesCxcl3,Il16, andCcl2, as well as the complement
recep-tors integrin alpha M (Itgam) and complement component 5a receptor 1 (C5ar1).
Themolecular functionsenriched inCstb-/-microglia included nucleotide binding, GTPase activity as well as chemotaxis. The microarray DEGs were involved in nucleotide binding, which comprised several oligoadenylate synthases (Oas) (Oas1a/g,Oas1b, andOas2) that syn-thesize 2´-5´-linked oligoadenylates in an ATP-dependent manner, as well as the OAS-like proteins 1 and 2 (Oasl1,Oasl2). In addition, this category contained genes encoding schlafen (SLFN) proteins (Slfn2,Slfn5,Slfn8/9) and several helicases (DEXH box polypeptide 58 (Dhx58), activating signal cointegrator 1 complex subunit 3 (Ascc3), DEAD box polypeptide 58 (Ddx58), interferon induced with helicase C domain 1 (Ifih1), and Moloney leukemia virus 10 (Mov10)). The genes possessing GTPase activity were interferon-inducible GTPases. This
cate-gory included genes such as Mx dynamin-like GTPase 1 (Mx1),Mx2, guanylate binding
pro-tein 2/1 (Gbp2/1),Gbp6/3, immunity-related GTPase family M member 1 (Irgm1),Irgm2, and
very large interferon inducible GTPase 1 (Gvin1). The RNA-seq-based molecular functions
highlighted the association of CSTB deficiency with chemotaxis, including genes such asCcl2, Cxcl13,Cxcl2,Cxcl3, andCxcl10.
The GO terms describingcellular componentsinCstb-/-microglia were associated with cell membranes and the extracellular space in both methods.
Interferon signaling pathway is downregulated in
Cstb
-/-microglia
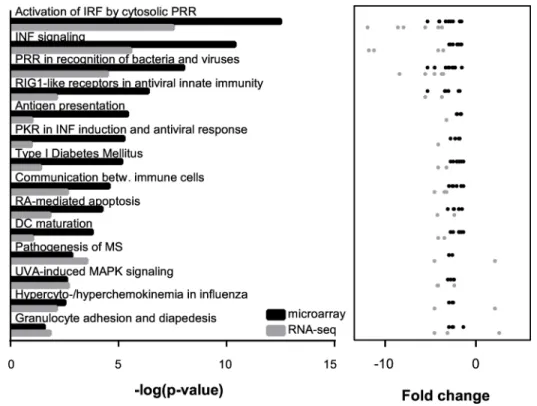
Next, we asked whether the DEGs shared common regulators potentially mediating the gene expression changes inCstb-/-microglia and if these genes were part of the same biological way. Therefore, we examined the microarray and the RNA-seq findings for molecular path-ways (Fig 4, detailed results inS6 Table) and potential upstream regulators (Fig 5, detailed results inS7 Table) linked to CSTB deficiency in microglia.
The molecular pathways over-represented inCstb-/-microglia in both methods were
involved in regulation of the innate immune system and interferon signaling (Fig 4). They included for example the recognition of pathogens and cellular damage by pattern recognition receptors (PRRs), the activation of interferon-regulated factors (IRFs), and signaling via the
interferon pathway. The upstream regulators enriched inCstb-/-microglia comprised the
mito-chondrial antiviral signaling protein (MAVS), the transcription factors IRF7, IRF3, and Signal transducer and activator of transcription 1 (STAT1), as well as several interferons (IFNλ1, IFNα2, IFNβ1, and IFNγ), and the interferon-α/βreceptor (INFαR) (Fig 5). The majority of these regulators act either upstream of the JAK-STAT signaling pathway or control the signal transduction of this pathway [38], suggesting that it might mediate the altered expression of interferon regulated genes inCstb-/-microglia.
To further investigate this, we performed qPCR of interferon-pathway regulatorsIrf7,Irf9,
and the transcription factorStat1and a qPCR-based JAK-STAT pathway assay from control
andCstb-/-microglia RNA samples. The qPCR confirmed the downregulation ofIrf7andStat1
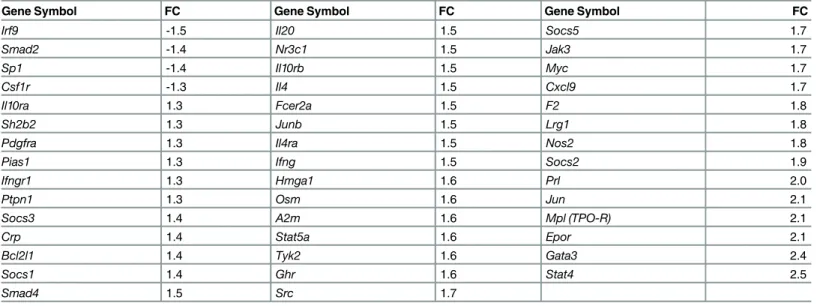
(S3 Fig). However, expression of the interferon-regulated geneIrf9, which was only slightly downregulated on the microarray (FC: -1.6), was reduced, but did not reach statistical signifi-cance. The JAK-STAT pathway assay, which determines transcript levels of 84 genes previously associated with this pathway, revealed only modest gene expression changes inCstb-/- micro-glia. We utilized a FC cut off of 1.3 and identified four downregulated genes (FC range: -1.3 to -1.5) and 40 upregulated genes (FC: 1.3 to 2.5) (Table 1). Using this assay, we were able to pin-point the downregulation ofIrf9.
In summary, our results showed a reduced expression of interferon-regulated genes in Cstb-/-microglia and implied a putative role for CSTB in regulation of interferon signaling.
Fig 4. Canonical pathways enriched inCstb-/-microglia identified by microarray and RNA-seq analyses.The 14 canonical pathways most highly ranked based on their p-value in the microarray (black color) and the RNA-seq approach (grey color) are depicted. The p-values and the fold changes of the microglia genes linked to each pathway are illustrated for both methods results.
doi:10.1371/journal.pone.0158195.g004
Fig 5. Upstream regulators enriched inCstb-/-microglia identified by microarray and RNA-seq analyses.The 12 upstream regulators most highly ranked based on their p-value in the microarray (black color) and the RNA-seq approach (grey color) are depicted. The z-scores and the fold changes of all genes potentially controlled by this regulator are illustrated for both methods.
Discussion
Our previous findings of an early activation and dysfunction ofCstb-/-microglia with
conse-quent neuroinflammation [14,19] and an upregulation of genes linked to immune system
pro-cesses in cerebella of one-month-oldCstb-/-mice [18] strongly supported a contribution of microglial dysfunction and inflammatory processes in the pathogenesis of EPM1. To scrutinize especially the microglial dysfunction associated with CSTB deficiency in more depth, we here focused on global gene expression profiling of culturedCstb-/-and control microglia by apply-ing a combination of two widely used gene expression profilapply-ing methods, microarray and RNA-seq, to the same RNA samples. Transcriptome profiling is a useful method to pinpoint altered cellular pathways. For example in neural stem cells, Notch signaling has been shown to be regulated by sirtuin 1(SIRT1) using this technique [39]. InCstb-/-mice, we have successfully utilized this method previously and found altered expression of synaptic genes in the cerebel-lum, which led to the finding of reduced GABAergic inhibition ofCstb-/-cerebellar Purkinje
cells [18]. Our comparison of theCstb-/-microglia microarray and RNA-seq results revealed
good concordance between both techniques, which was expected due to the similarities in the
amounts of polyadenylated transcripts inCstb-/-and control samples. For example, more than
half of all identified genes were detected by both methods, and their gene expression values as well as fold changes correlated reasonably well. The correlation in gene expression values was slightly less strong, but comparable with earlier reports comparing RNA-seq and microarrays [40–42]. Moreover, we found good concordance between the functional enrichment analyses, although the number of DEGs shared by both methods was small. This might be due to the dif-ferent normalization methods used in both studies. The RNA-seq data are normalized to spike-in RNAs with known sequence and concentration that are added to the samples and the microarray data are normalized between arrays by quantile normalization, although Gene-Chips can also be normalized by spike-in RNAs, e.g. [43]. In addition, the probe selection on the microarray might underlie the differences. The microarray probes are spread over different exons in the genes, whereas the STRT RNA-seq protocol only counts mapped reads within the Table 1. JAK-STAT pathway-associated transcripts differentially expressed inCstb-/-microglia.
Gene Symbol FC Gene Symbol FC Gene Symbol FC
Irf9 -1.5 Il20 1.5 Socs5 1.7
Smad2 -1.4 Nr3c1 1.5 Jak3 1.7
Sp1 -1.4 Il10rb 1.5 Myc 1.7
Csf1r -1.3 Il4 1.5 Cxcl9 1.7
Il10ra 1.3 Fcer2a 1.5 F2 1.8
Sh2b2 1.3 Junb 1.5 Lrg1 1.8
Pdgfra 1.3 Il4ra 1.5 Nos2 1.8
Pias1 1.3 Ifng 1.5 Socs2 1.9
Ifngr1 1.3 Hmga1 1.6 Prl 2.0
Ptpn1 1.3 Osm 1.6 Jun 2.1
Socs3 1.4 A2m 1.6 Mpl (TPO-R) 2.1
Crp 1.4 Stat5a 1.6 Epor 2.1
Bcl2l1 1.4 Tyk2 1.6 Gata3 2.4
Socs1 1.4 Ghr 1.6 Stat4 2.5
Smad4 1.5 Src 1.7
Relative gene expression levels were determined by JAK-STAT pathway array and the fold change (FC) between control andCstb-/-microglia was calculated. All genes with an absolute FC1.3 are considered differentially expressed.
5’-UTR or up to 500 bp upstream of known protein-coding genes. Moreover, the STRT RNA-seq detects only intact mRNAs, which are used as templates for protein translation, but it is not ideal for the detection of some longer mRNAs, because it uses oligo-dT primer for the first-strand cDNA synthesis. In contrast, the microarray uses random primer and therefore mea-sures degrading mRNAs as well, but it is better for long mRNAs. Sequencing depth for the RNA-seq analysis is another factor, the optimal sequencing depth depends on the aim of the study and on the transcriptome complexity of the target sample. In addition, the amount of input RNA influences the detection power. In this first STRT study, we used 10 ng total RNA for each replica (equivalent to 40 ng for each sample; while 100 ng for the microarray), and sequenced one STRT library containing all replicas of all samples on one HiSeq2000 lane. Although this setup identified dominant gene expression changes, which were also detected by microarray, a much deeper sequencing might also reveal more subtle expression changes [44]. Although there were many possibilities, one consistent result was that in both approaches the majority of genes showing significantly altered expression inCstb-/-microglia were
downregulated.
The adult mouse microglia transcriptome has been determined by RNA-seq [36] and the 100 genes with highest expression were linked to the detection of molecules, such as pattern recognition receptors, and purinergic receptors, and thus have been called the microglial‘ sen-some’. The evaluation of the sensome gene expression inCstb-/-and control microglia revealed that the majority of these genes are also expressed in primary microglia, although both studies differed in extraction and culturing of the cells. In addition, the expression of microglial
sen-some genes was not altered considerably inCstb-/-microglia compared to control microglia. To
characterize not only the sensome ofCstb-/-microglia, but also their activation, the expression of pro- and anti-inflammatory phenotypic markers can be analyzed [37]. Our previous study
showed that inCstb-/-mice, the balance between pro-inflammatory and anti-inflammatory
activated microglia was, compared to controls, shifted towards anti-inflammatory type at P14 and towards pro-inflammatory type in P30. We also described upregulated protein expression of both the pro-inflammatory marker iNOS and the anti-inflammatory marker Arginase1 in P30Cstb-/-mouse brain [19]. However, the primary culturedCstb-/-microglia in this study were neither pro- nor anti-inflammatory activatedin vitro. We noted a down-regulation of five pro-inflammatory genes (Cd86,Il1b,Ccl5,Cxcl10,Cxcl13), which, however, might be due to the altered interferon signaling, because most of these genes were interferon regulated accord-ing to the database Interferome 2.0 [45].
The GO enrichment analysis indicated that CSTB deficiency in microglia altered immune system- and defense response-related functions. More specifically, GO terms associated with antigen presentation and chemotaxis were over-represented inCstb-/-microglia. These data are in line with previousin vitrostudies inCstb-/-microglia and bone marrow-derived macro-phages (BMDM), which have shown altered immune cell functions, suggesting e.g. changes in
antigen presentation and chemotaxis [11,19,46]. Further analyses of the altered pathways and
their upstream regulators indicated that the mechanism underlying the dysfunction ofCstb -/-microglia might be associated with interferon signaling and the JAK-STAT pathway. Interferon signaling is an important regulator of the innate immune response mediating the defense against viral infections [38]. However, in recent years also other functions for interferon signal-ing have been emergsignal-ing, e.g. the regulation of autophagy [47]. Both enhanced and impaired interferon signaling has been linked to pathological conditions [48]. For example, enhanced IFN signaling has been associated with autoimmune diseases, such as rheumatoid arthritis and
systemic lupus erythematosus [49]. In contrast, IFNβ-mediated signaling ameliorated
pathol-ogy in ischemic stroke and cerebral ischemia [50,51], suggesting a beneficial role for interferon signaling. Moreover, STAT1 and IRF9 are protective against neuropathology mediated by
chronic astrocytic IFNαexpression, which induces e.g. neurodegeneration, inflammation, and glial activation [52,53]. Our results indicating altered interferon regulated JAK-STAT signaling in microglia are in line with previous studies analyzingCstb-/-BMDMs of adult mice. These showed reduced activation or expression of proteins on this pathway in response to pro-inflammatory stimulation, e.g. reduced STAT1 activation by tyrosine phosphorylation and Ifnb1mRNA expression [11,46]. InCstb-/-microglia,Stat1mRNA abundance was reduced,
however,Ifnb1expression was not altered, which might be due to a cell type specific
downregu-lation ofIfnb1inCstb-/-BMDMs. In addition, we might not be able to detect the downregula-tion ofIfnb1, because of its weak constitutive expression level [54].
Reduced signaling via the interferon pathway inCstb-/-microglia might also have implica-tions for other cellular processes. For example, IFNβ-induced IFNAR signaling inhibits reactive oxygen species production and inflammasome activation [55]. Thus, reduced IFN signaling in
Cstb-/-mice might elevate inflammasome activation and induce the activation of the
pro-inflammatory cytokines IL1βand IL18, which have been shown at high levels in the serum of
LPS-injectedCstb-/-mice [11] and have been linked to the pathogenesis of several neurodegen-erative diseases, such as Alzheimer’s disease and multiple sclerosis [56]. We observed a
decreasedIl1bmRNA expression inCstb-/-microglia, however, the microglia samples in our
study were not pro-inflammatory activated.
In addition to affecting the immunological functions, altered interferon signaling inCstb -/-immune cells might have a more direct impact on neuronal signaling and/or viability. For
example, IFNγhas been reported to suppress the differentiation of GABAergic neurons from
neuronal progenitor cells, and to induce the generation of glutamatergic neurons [57]. Although we were not able to pinpoint alteredIfngexpression inCstb-/-microglia, it is, in light of our previous electrophysiological recordings of P7Cstb-/-Purkinje cells, which have revealed an imbalance between excitation and inhibition inCstb-/-mouse brain [18], tempting to specu-late that impaired interferon signaling inCstb-/-microglia could modify the excitability and via-bility ofCstb-/-neurons.
Conclusion
Collectively, the integration of data from microarray and RNA-seq technologies strengthened and expanded the previously reported indications of impaired interferon-signaling pathway in Cstb-/-mice to a general downregulation of interferon-regulated genes [11,46]. Moreover, our results supported previous findings suggesting that modified inflammatory processes of micro-glia contribute to the pathogenesis of EPM1.
Supporting Information
S1 Fig. DEG expression level.The DEG expression level in (A) microarray and (B) RNA-seq. Microarray specific DEGs are depicted in violet, RNA-seq specific DEGs in light blue, and DEGs common to both methods in orange.
(PDF)
S2 Fig. RNA-seq expression values of genes associated with microglia or microglial activa-tion in control andCstb-/-microglia.RNA-seq gene expression level of transcripts (A) report-edly enriched in microglia, (B) associated with pro-inflammatory, and (C) with
anti-inflammatory activation of microglia determined in control (black bars) andCstb-/-microglia (grey bars). The asterisk () marks genes significantly altered inCstb-/-microglia compared to control microglia. Error bars represent standard deviation (SD).
S3 Fig. RNA expression level of transcriptsIrf7,Stat1, andIrf9inCstb-/-and control micro-glia measured by qPCR.Transcript levels ofIrf7andStat1are significantly reduced inCstb
-/-microglia. RNA expression fromCstb-/-and control microglia measured by qPCR and
normal-ized toTbptranscript level. The average mRNA expression (± standard deviation) of three or
four independent samples is depicted (0.05,0.01).
(PDF)
S1 Table. Transcripts differentially expressed inCstb-/-microglia.In the microarray experi-ment, genes with an absolute fold change (FC)1.3 and a p-value<0.05 were considered dif-ferentially expressed and in the RNA-seq analysis a local false discovery rate (FDR)<0.01 was used as cutoff. Genes are sorted by FC identified in the microarray analysis and asterisks () mark genes differentially expressed in the results of both methods.
(PDF)
S2 Table. Sequencing reads obtained by RNA-seq for control andCstb-/-microglia samples.
(PDF)
S3 Table. Expected numbers of overlapping DEGs.The overlap is significantly higher than the expectation (odds ratio = 132.2, p<2.2e-16 by Fisher’s Exact test for count data, expected numbers are given in parenthesis).
(PDF)
S4 Table. Gene ontology terms enriched in differentially expressed genes inCstb-/- micro-glia identified by microarray.N = total number of genes, B = Genes associated with GO term, n = Genes in the target set, b = Genes in target set associated with GO term.
(PDF)
S5 Table. Gene ontology terms enriched in differentially expressed genes inCstb-/- micro-glia identified by RNA-seq.N = total number of genes, B = Genes associated with GO term, n = Genes at the top of the list, b = Genes at the top associated with GO term.
(PDF)
S6 Table. Pathways enriched in differentially expressed genes inCstb-/-microglia.
(PDF)
S7 Table. Regulators enriched in differentially expressed genes inCstb-/-microglia.
(PDF)
Acknowledgments
The computations were performed on resources provided by SNIC through Uppsala Multidis-ciplinary Center for Advanced Computational Science (UPPMAX) under Project b2014069. We would like to thank Per Harald Jonson, PhD, for commenting on the manuscript.
Author Contributions
Conceived and designed the experiments: IK SK EE JK A-EL TJ. Performed the experiments: IK KK PH. Analyzed the data: IK SK EE. Wrote the paper: IK SK EE JK A-EL TJ.
References
1. Kälviäinen R, Khyuppenen J, Koskenkorva P, Eriksson K, Vanninen R, Mervaala E. Clinical picture of EPM1-Unverricht-Lundborg disease. Epilepsia. 2008; 49(4):549–56. doi:10.1111/j.1528-1167.2008.
2. Ritonja A, Machleidt W, Barrett AJ. Amino acid sequence of the intracellular cysteine proteinase inhibi-tor cystatin B from human liver. Biochem Biophys Res Commun. 1985; 131(3):1187–92. PMID:
3902020
3. Joensuu T, Kuronen M, Alakurtti K, Tegelberg S, Hakala P, Aalto A, et al. Cystatin B: mutation detec-tion, alternative splicing and expression in progressive myclonus epilepsy of Unverricht-Lundborg type (EPM1) patients. Eur J Hum Genet. 2007; 15(2):185–93. PMID:17003839
4. Lalioti MD, Scott HS, Buresi C, Rossier C, Bottani A, Morris MA, et al. Dodecamer repeat expansion in cystatin B gene in progressive myoclonus epilepsy. Nature. 1997; 386(6627):847–51. PMID:9126745
5. Alakurtti K, Weber E, Rinne R, Theil G, de Haan GJ, Lindhout D, et al. Loss of lysosomal association of cystatin B proteins representing progressive myoclonus epilepsy, EPM1, mutations. Eur J Hum Genet. 2005; 13(2):208–15. PMID:15483648
6. Lehtinen MK, Tegelberg S, Schipper H, Su H, Zukor H, Manninen O, et al. Cystatin B deficiency sensi-tizes neurons to oxidative stress in progressive myoclonus epilepsy, EPM1. J Neurosci. 2009; 29 (18):5910–5. doi:10.1523/JNEUROSCI.0682-09.2009PMID:19420257
7. Rinne R, Saukko P, Jarvinen M, Lehesjoki AE. Reduced cystatin B activity correlates with enhanced cathepsin activity in progressive myoclonus epilepsy. Ann Med. 2002; 34(5):380–5. PMID:12452481
8. Pennacchio LA, Bouley DM, Higgins KM, Scott MP, Noebels JL, Myers RM. Progressive ataxia, myo-clonic epilepsy and cerebellar apoptosis in cystatin B-deficient mice. Nat Genet. 1998; 20(3):251–8. PMID:9806543
9. Ceru S, Konjar S, Maher K, Repnik U, Krizaj I, Bencina M, et al. Stefin B interacts with histones and cathepsin L in the nucleus. J Biol Chem. 2010; 285(13):10078–86. doi:10.1074/jbc.M109.034793
PMID:20075068
10. Franceschetti S, Sancini G, Buzzi A, Zucchini S, Paradiso B, Magnaghi G, et al. A pathogenetic hypoth-esis of Unverricht-Lundborg disease onset and progression. Neurobiol Dis. 2007; 25(3):675–85. PMID:
17188503
11. Maher K, Jeric Kokelj B, Butinar M, Mikhaylov G, Mancek-Keber M, Stoka V, et al. A role for stefin B (cystatin B) in inflammation and endotoxemia. J Biol Chem. 2014; 289(46):31736–50. doi:10.1074/jbc.
M114.609396PMID:25288807
12. Manninen O, Laitinen T, Lehtimäki KK, Tegelberg S, Lehesjoki AE, Gröhn O, et al. Progressive volume loss and white matter degeneration in cstb-deficient mice: a diffusion tensor and longitudinal volumetry MRI study. PLoS One. 2014; 9(3):e90709.
13. Shannon P, Pennacchio LA, Houseweart MK, Minassian BA, Myers RM. Neuropathological changes in a mouse model of progressive myoclonus epilepsy: cystatin B deficiency and Unverricht-Lundborg dis-ease. J Neuropathol Exp Neurol. 2002; 61(12):1085–91. PMID:12484571
14. Tegelberg S, Kopra O, Joensuu T, Cooper JD, Lehesjoki AE. Early microglial activation precedes neu-ronal loss in the brain of the Cstb-/- mouse model of progressive myoclonus epilepsy, EPM1. J Neuro-pathol Exp Neurol. 2012; 71(1):40–53. doi:10.1097/NEN.0b013e31823e68e1PMID:22157618
15. Koskenkorva P, Niskanen E, Hyppönen J, Könönen M, Mervaala E, Soininen H, et al. Sensorimotor, visual, and auditory cortical atrophy in Unverricht-Lundborg disease mapped with cortical thickness analysis. AJNR Am J Neuroradiol. 2012; 33(5):878–83. doi:10.3174/ajnr.A2882PMID:22268086
16. Manninen O, Koskenkorva P, Lehtimäki KK, Hyppönen J, Könönen M, Laitinen T, et al. White matter degeneration with Unverricht-Lundborg progressive myoclonus epilepsy: a translational diffusion-ten-sor imaging study in patients and cystatin B-deficient mice. Radiology. 2013; 269(1):232–9. doi:10.
1148/radiol.13122458PMID:23788720
17. Mascalchi M, Michelucci R, Cosottini M, Tessa C, Lolli F, Riguzzi P, et al. Brainstem involvement in Unverricht-Lundborg disease (EPM1): An MRI and (1)H MRS study. Neurology. 2002; 58(11):1686–9. PMID:12058102
18. Joensuu T, Tegelberg S, Reinmaa E, Segerstråle M, Hakala P, Pehkonen H, et al. Gene expression alterations in the cerebellum and granule neurons of Cstb(-/-) mouse are associated with early synaptic changes and inflammation. PLoS One. 2014; 9(2):e89321. doi:10.1371/journal.pone.0089321PMID:
24586687
19. Okuneva O, Körber I, Li Z, Tian L, Joensuu T, Kopra O, et al. Abnormal microglial activation in the Cstb (-/-) mouse, a model for progressive myoclonus epilepsy, EPM1. Glia. 2015; 63(3):400–11. doi:10.
1002/glia.22760PMID:25327891
20. Giulian D, Baker TJ. Characterization of ameboid microglia isolated from developing mammalian brain. J Neurosci. 1986; 6(8):2163–78. PMID:3018187
21. Irizarry RA, Hobbs B, Collin F, Beazer-Barclay YD, Antonellis KJ, Scherf U, et al. Exploration, normali-zation, and summaries of high density oligonucleotide array probe level data. Biostatistics. 2003; 4 (2):249–64. PMID:12925520
22. Islam S, Kjällquist U, Moliner A, Zajac P, Fan JB, Lönnerberg P, et al. Highly multiplexed and strand-specific single-cell RNA 5' end sequencing. Nat Protoc. 2012; 7(5):813–28. doi:10.1038/nprot.2012. 022PMID:22481528
23. Krjutškov K, Katayama S, Saare M, Vera-Rodriguez M, Lubenets D, Samuel K, et al. Single-cell tran-scriptome analysis of endometrial tissue. Hum Reprod. 2016; doi:10.1093/humrep/dew008
24. Waterston RH, Lindblad-Toh K, Birney E, Rogers J, Abril JF, Agarwal P, et al. Initial sequencing and comparative analysis of the mouse genome. Nature. 2002; 420(6915):520–62. PMID:12466850
25. Kim D, Pertea G, Trapnell C, Pimentel H, Kelley R, Salzberg SL. TopHat2: accurate alignment of tran-scriptomes in the presence of insertions, deletions and gene fusions. Genome biology. 2013; 14(4): R36. doi:10.1186/gb-2013-14-4-r36PMID:23618408
26. Hsu F, Kent WJ, Clawson H, Kuhn RM, Diekhans M, Haussler D. The UCSC Known Genes. Bioinfor-matics. 2006; 22(9):1036–46. PMID:16500937
27. Katayama S, Töhönen V, Linnarsson S, Kere J. SAMstrt: statistical test for differential expression in sin-gle-cell transcriptome with spike-in normalization. Bioinformatics. 2013; 29(22):2943–5. doi:10.1093/ bioinformatics/btt511PMID:23995393
28. Brown GR, Hem V, Katz KS, Ovetsky M, Wallin C, Ermolaeva O, et al. Gene: a gene-centered informa-tion resource at NCBI. Nucleic Acids Res. 2015; 43(Database issue):D36–42. doi:10.1093/nar/
gku1055PMID:25355515
29. Eden E, Lipson D, Yogev S, Yakhini Z. Discovering motifs in ranked lists of DNA sequences. PLoS Comput Biol. 2007; 3(3):e39. PMID:17381235
30. Eden E, Navon R, Steinfeld I, Lipson D, Yakhini Z. GOrilla: a tool for discovery and visualization of enriched GO terms in ranked gene lists. BMC Bioinformatics. 2009; 10:48. doi: 10.1186/1471-2105-10-48PMID:19192299
31. Jensen LJ, Kuhn M, Stark M, Chaffron S, Creevey C, Muller J, et al. STRING 8-a global view on pro-teins and their functional interactions in 630 organisms. Nucleic Acids Res. 2009; 37:D412–D6. doi:10.
1093/nar/gkn760PMID:18940858
32. Shannon P, Markiel A, Ozier O, Baliga NS, Wang JT, Ramage D, et al. Cytoscape: a software environ-ment for integrated models of biomolecular interaction networks. Genome Res. 2003; 13(11):2498– 504. PMID:14597658
33. Livak KJ, Schmittgen TD. Analysis of relative gene expression data using real-time quantitative PCR and the 2(-Delta Delta C(T)) Method. Methods. 2001; 25(4):402–8. PMID:11846609
34. Katayama S, Skoog T, Jouhilahti EM, Siitonen HA, Nuutila K, Tervaniemi MH, et al. Gene expression analysis of skin grafts and cultured keratinocytes using synthetic RNA normalization reveals insights into differentiation and growth control. BMC Genomics. 2015; 16:476. doi:10.1186/s12864-015-1671-5
PMID:26108968
35. Töhönen V, Katayama S, Vesterlund L, Jouhilahti EM, Sheikhi M, Madissoon E, et al. Novel PRD-like homeodomain transcription factors and retrotransposon elements in early human development. Nat Commun. 2015; 6:8207. doi:10.1038/ncomms9207PMID:26360614
36. Hickman SE, Kingery ND, Ohsumi TK, Borowsky ML, Wang LC, Means TK, et al. The microglial sen-some revealed by direct RNA sequencing. Nat Neurosci. 2013; 16(12):1896–905. doi:10.1038/nn. 3554PMID:24162652
37. Franco R, Fernández-Suárez D. Alternatively activated microglia and macrophages in the central ner-vous system. Prog Neurobiol. 2015; 131:65–86. doi:10.1016/j.pneurobio.2015.05.003PMID:
26067058
38. McNab F, Mayer-Barber K, Sher A, Wack A, O'Garra A. Type I interferons in infectious disease. Nat Rev Immunol. 2015; 15(2):87–103. doi:10.1038/nri3787PMID:25614319
39. Ma CY, Yao MJ, Zhai QW, Jiao JW, Yuan XB, Poo MM. SIRT1 suppresses self-renewal of adult hippo-campal neural stem cells. Development. 2014; 141(24):4697–709. doi:10.1242/dev.117937PMID:
25468938
40. Bradford JR, Hey Y, Yates T, Li Y, Pepper SD, Miller CJ. A comparison of massively parallel nucleotide sequencing with oligonucleotide microarrays for global transcription profiling. BMC Genomics. 2010; 11:282. doi:10.1186/1471-2164-11-282PMID:20444259
41. Guo Y, Sheng Q, Li J, Ye F, Samuels DC, Shyr Y. Large scale comparison of gene expression levels by microarrays and RNAseq using TCGA data. PLoS One. 2013; 8(8):e71462. doi:10.1371/journal.
pone.0071462PMID:23977046
42. Toung JM, Morley M, Li M, Cheung VG. RNA-sequence analysis of human B-cells. Genome Res. 2011; 21(6):991–8. doi:10.1101/gr.116335.110PMID:21536721
43. Lovén J, Orlando DA, Sigova AA, Lin CY, Rahl PB, Burge CB, et al. Revisiting global gene expression analysis. Cell. 2012; 151(3):476–82. doi:10.1016/j.cell.2012.10.012PMID:23101621
44. Heimberg G, Bhatnagar R, El-Samad H, Thomson M. Low Dimensionality in Gene Expression Data Enables the Accurate Extraction of Transcriptional Programs from Shallow Sequencing. Cell Syst. 2016; 2(4):239–50. doi:10.1016/j.cels.2016.04.001PMID:27135536
45. Rusinova I, Forster S, Yu S, Kannan A, Masse M, Cumming H, et al. Interferome v2.0: an updated data-base of annotated interferon-regulated genes. Nucleic Acids Res. 2013; 41(Datadata-base issue):D1040–6. doi:10.1093/nar/gks1215PMID:23203888
46. Maher K, Zavrsnik J, Jeric-Kokelj B, Vasiljeva O, Turk B, Kopitar-Jerala N. Decreased IL-10 expression in stefin B-deficient macrophages is regulated by the MAP kinase and STAT-3 signaling pathways. FEBS Lett. 2014; 588(5):720–6. doi:10.1016/j.febslet.2014.01.015PMID:24462687
47. Schmeisser H, Bekisz J, Zoon KC. New function of type I IFN: induction of autophagy. J Interferon Cyto-kine Res. 2014; 34(2):71–8. doi:10.1089/jir.2013.0128PMID:24428799
48. Prinz M, Knobeloch KP. Type I interferons as ambiguous modulators of chronic inflammation in the cen-tral nervous system. Front Immunol. 2012; 3:67. doi:10.3389/fimmu.2012.00067PMID:22566948
49. Nallar SC, Kalvakolanu DV. Interferons, signal transduction pathways, and the central nervous system. J Interferon Cytokine Res. 2014; 34(8):559–76. doi:10.1089/jir.2014.0021PMID:25084173
50. Inácio AR, Liu Y, Clausen BH, Svensson M, Kucharz K, Yang Y, et al. Endogenous IFN-beta signaling exerts anti-inflammatory actions in experimentally induced focal cerebral ischemia. J Neuroinflamma-tion. 2015; 12:211. doi:10.1186/s12974-015-0427-0PMID:26581581
51. Kuo PC, Scofield BA, Yu IC, Chang FL, Ganea D, Yen JH. Interferon-beta Modulates Inflammatory Response in Cerebral Ischemia. J Am Heart Assoc. 2016; 5(1):e002610. doi:10.1161/JAHA.115.
002610PMID:26747000
52. Hofer MJ, Li W, Lim SL, Campbell IL. The type I interferon-alpha mediates a more severe neurological disease in the absence of the canonical signaling molecule interferon regulatory factor 9. J Neurosci. 2010; 30(3):1149–57. doi:10.1523/JNEUROSCI.3711-09.2010PMID:20089923
53. Wang J, Schreiber RD, Campbell IL. STAT1 deficiency unexpectedly and markedly exacerbates the pathophysiological actions of IFN-alpha in the central nervous system. Proc Natl Acad Sci U S A. 2002; 99(25):16209–14. PMID:12461178
54. Taniguchi T, Takaoka A. A weak signal for strong responses: interferon-alpha/beta revisited. Nat Rev Mol Cell Biol. 2001; 2(5):378–86. PMID:11331912
55. Inoue M, Williams KL, Oliver T, Vandenabeele P, Rajan JV, Miao EA, et al. Interferon-beta therapy against EAE is effective only when development of the disease depends on the NLRP3 inflammasome. Sci Signal. 2012; 5(225):ra38. doi:10.1126/scisignal.2002767PMID:22623753
56. Freeman LC, Ting JP. The pathogenic role of the inflammasome in neurodegenerative diseases. J Neurochem. 2015; 136 Suppl 1:29–38. doi:10.1111/jnc.13217PMID:26119245
57. Ahn J, Lee J, Kim S. Interferon-gamma inhibits the neuronal differentiation of neural progenitor cells by inhibiting the expression of Neurogenin2 via the JAK/STAT1 pathway. Biochem Biophys Res Commun. 2015; 466(1):52–9. doi:10.1016/j.bbrc.2015.08.104PMID:26325468