Energy Saving Potential of Different Setpoint Control Algorithms in Mixed-Mode Buildings
Charalampos Angelopoulos
1*, Malcolm J Cook
1,Efi Spentzou
1, Yashkumar Shukla
21
School of Architecture, Building and Civil Engineering, Loughborough University, United Kingdom
2CEPT University, Ahmedabad, India
*[email protected]
Abstract
Mixed-mode buildings can combine the use of natural and mechanical systems to achieve the desirable internal conditions. However, it is essential to effectively control a mixed-mode building to minimize the energy consumption without compromising the thermal comfort of the occupants. The aim of this research is to develop different setpoint control algorithms for mixed-mode buildings, by using a variety of adaptive methodologies such as ASHRAE Standard 55, IMAC model and EN15251, and evaluate their energy saving potential for Bangalore and Mumbai, India and Gatwick,UK. Co-simulations were used for this research. EnergyPlus was used to develop the building geometry and coupled with Modelica, where the control algorithms were developed. This is a novel simulation approach to assess control algorithms in buildings and provides great flexibility for future use of the control algorithms. The results showed that the effective control of mixed-mode building can result approximately in 40% energy saving in Indian cities compared to fully mechanical conditioned buildings whilst maintaining comfortable internal conditions for 90% of the year.
Introduction
Recent studies have shown that the building sector is responsible for approximately 20% of the world’s total energy consumption (EIA, 2017). The energy that is used for space heating and cooling in residential buildings is 43% in USA (Levine et al., 2012), 50% in India (Kapoor
et al., 2011) and almost 30% in the UK (DECC, 2016) of the total energy consumption in buildings for each country respectively. The increasing population and urbanization, the decline of air quality and at the same time the higher living standards expectations are all characteristics of the majority of the developed and developing countries. Hence, the way in which our society will overcome all these challenges will shape the future of our planet.
In the past 50 years, mechanical cooling systems were introduced to the buildings to meet the indoor environmental needs of the occupants (Terkildsen, 2013). In recent years, the increased awareness of sustainability in the building sector, both in industry and academia have resulted in a growing interest in naturally ventilated buildings (Wang & Greenberg, 2015). Natural ventilated or free running buildings are of great interest to designers, architects and building owners, especially due to their
potential to consume considerably less energy compared to mechanical conditioned builings, throughout the life span of a building (Dhaka et al., 2015). Both natural and mechanical systems have developed with the focus of delivering thermally comfortable internal environments and adequate indoor air quality (IAQ) with the minimum energy consumption. However, in cases with very warm and humid climates, natural ventilation systems often have been found to be unable to provide acceptable IAQ and thermally comfortable internal environments alone (Heiselberg, 2002; Delsante & Vik, 2000).
Mixed-mode ventilation systems combine natural ventilation and mechanical heating and cooling systems. By operating the windows, mixed-mode buildings utilize the use of natural ventilation to minimize the operation hours of the mechanical systems without compromising the internal thermal conditions. The Center for the Built Environment (CBE) at the University of California developed a summary report to describe the different mixed-mode ventilation systems that are available (CBE, 2007) as: “concurrent mixed-mode” where both systems operate at the same space at the same time; “change-over mixed-mode” where the mechanical systems and natural ventilation operate at the same space but in different periods of time; and “zoned mixed-mode” where the mechanical cooling and natural ventilation operate at the same time but in different spaces of the building. Mixed-mode buildings, fundamentally provide a flexibility and reduction in the space conditioning systems of buildings. This could result in lower maintenance cost of the mechanical cooling units and potentially smaller HVAC units compared to purely mechanical ventilated buildings with the same floor area (Brager, 2006). Previous studies have shown that the occupants continuously adapt to their thermal environment by controlling the passive (windows) or mechanical systems, until they “reach” their desirable thermal conditions (Brager & de Dear, 1998; Nicol & Humphreys, 2002). A recent study showed that by operating the windows during the summer months for a mixed-mode office building in the USA, the energy consumption of the mechanical systems could be reduced by 17-47% (Wang & Greenberg, 2015). In addition, Babich et al., (2017) examined the effects of using ceiling fans at a typical Indian apartment. The air movement due to the ceiling fans, favours the use to higher setpoint temperatures which could lead up to 70% energy savings.
The adaptation that a mixed-mode building provides, sometimes results to uncertainties in the energy performance calculations. Hoes et al., (2009) in their research showed that by neglecting occupants' behaviour at mixed-mode buildings during the calculations of the energy and thermal performance of the building might be a big source of error at the final results. Following this, an occupant survey study in a mixed-mode building in Cyprus showed that 66% of the occupants operate the windows regularly during summer periods. This had a negative impact on the energy consumption of the building since higher cooling loads were needed to compensate of the added heat loads due to the warm outdoor air the entered to the building (Nisiforou et al.,2012).
Therefore, it is important to include the adaptation approach while designing control strategies of mixed-mode buildings to reduce the uncertainties in the energy predictions. Also, as previous studies showed, the selection of the most appropriate setpoint temperature could have a significant impact on the energy performance of a mixed-mode building. The aim of the research reported in this paper was to develop control algorithms for mixed-mode buildings and quantify their energy-saving potential. To examine this, the following objectives were used: i) optimum selection of cooling/heating setpoints (static and dynamic setpoints) for mechanical systems and ii) optimum window operation to utilize natural ventilation.
Methods
In this study, computer simulations were performed to evaluate the suitability of the setpoint control algorithms. EnergyPlus is used as the dynamic thermal performance (DTM) simulation tool to model the building envelope, while Modelica is used to develop the setpoint control algorithms. For rigorous research, new concepts must first be tested in a controlled environment. Only then can the principles be applied to full-scale buildings. In this study, a single thermal zone residential building will be used. To reduce the uncertainties in the model (internal loads, constructions etc) the BESTEST Case 600 (Henninger & Witte, 2011) has been used as the single thermal zone residential building. The floor area of the house is 48 m2,
with two windows 3 m2 each facing south (Figure 1). It is
assumed that the occupancy density is 0.0625 occupant/m2 and the total internal electrical gains
19.3W/m2. Table 1 summarizes the envelope
characteristics that were used.
Table 1: Envelope characteristics
Element U-value [𝑾 𝒎𝟐𝑲] Wall 0.514 Roof 0.318 Floor 0.039 Window 2.721
Three cities, Mumbai and Bangalore in India and London-Gatwick in the UK have been selected for this study to represent different climates in India and UK. The weather
files provided by EnergyPlus where used for this study (EnergyPlus WeatherData, 2018).
Figure 1: Layout of the single thermal zone residential building
For the mechanical systems, and since the purpose of this research reported here is not to accurately model a mechanical system, an ideal load HVAC system is used.
Coupling technique
Energy performance simulation tools, such as EnergyPlus, are designed to evaluate the annual building energy performance, rather than to examine the performance of different control strategies for mechanical cooling or passive systems (Nouidui et al., 2014). There are various software tools to address these tasks. Hence, to extend the capability of the DTM simulation tools they have linked through co-simulations to a variety of software such Modelica (Nouidui et al., 2014).
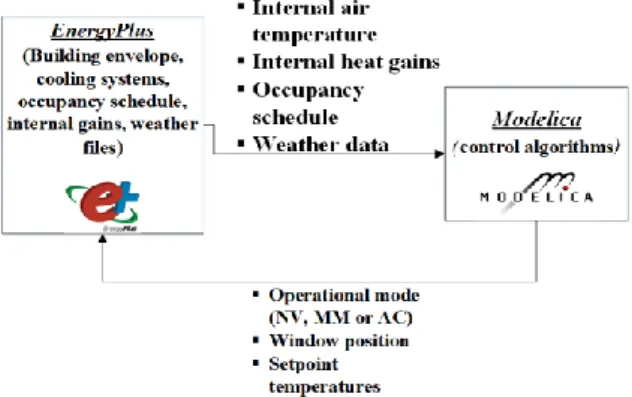
The coupling of the two software tools was implemented using the functional mock-up interface (FMI) standard, which is a standardized method to link different software (MODELISAR, 2017). The building envelope, the ideal HVAC system as well as the internal gains and occupancy schedule were developed in EnergyPlus and exported as a functional mock-up unit (FMU) and imported in Modelica where the control algorithms were developed. In this study, information was sent through Modelica to EnergyPlus regarding the operation mode, (natural ventilation or mechanical system), setpoint temperatures and window position (Figure 2).
Figure 2: Variable exchange between the two simulation tools
EnergyPlus send to Modelica information regarding the internal temperatures, internal heat gains and occupancy schedule. The exchange of information occurred automatically between the two simulation tools at each simulation timestep (600 sec) and throughout the
“Master Control Algorith “Natural ventilation for cooling control algorithm
for occupied periods”
”
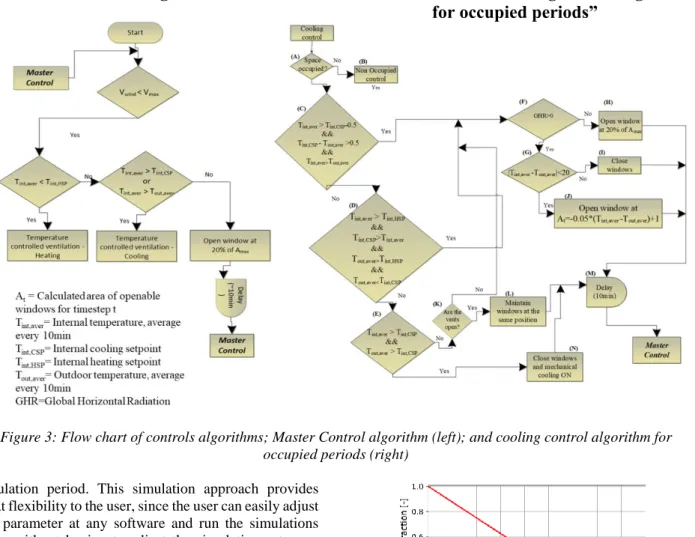
Figure 3: Flow chart of controls algorithms; Master Control algorithm (left); and cooling control algorithm for occupied periods (right)
simulation period. This simulation approach provides great flexibility to the user, since the user can easily adjust any parameter at any software and run the simulations again without having to adjust the simulation setup up each time. Additionally, the same control algorithms could be used in any building type by simply importing the new geometry to Modelica as an FMU.
Control algorithms
To thoroughly examine the impact of different methodologies to determine the cooling setpoint temperatures for a mixed-mode building, the following “master” control algorithm was developed for all the cases, regardless of the setpoint temperatures (Figure 3). In this algorithm, when cooling or ventilation is required during occupied hours, natural ventilation is preferred over the mechanical systems and when the there is no cooling/heating potential from natural ventilation, mechanical system is switched on. It is assumed that the “change-over” mixed-mode strategy is used. An additional check, by the control algorithms, against the outdoor temperature is made to examine whether it is thermodynamically favourable to increase the ventilation rates by increasing the opening of the windows. If the zone’s internal air temperature rises above the cooling setpoint, then mechanical cooling is operating. The natural ventilation is preferred as long as the internal air temperature is higher than the external, the cooling setpoint is higher than the outdoor air temperature to ensure that there is thermodynamic advantage for additional ventilation (Figure 3).
Figure 4: Modulation of window opening according to the temperature difference
When natural ventilation is required, the opening of the windows will be modulated according to the indoor and outdoor conditions based on a linear relationship, see Figure 4 (DOE, 2017). Windows will be closed when the difference between the internal and external temperature is greater or equal to 20°C and will be fully open when the difference is zero (Wang & Greenberg, 2015). It is assumed that the difference between the internal and external air temperatures as well the internal air temperature and the internal cooling setpoint should be higher than or equal to 0.5K in order to avoid any unnecessary use of the mechanical cooling systems (DesignBuilder, 2017). The majority of the existing simulation tools require the user to pre-define the window opening modulation based on the temperature difference. As shown in Figure 3, the control algorithms used in this research, calculate the window opening area requirements for the building based on instantaneous indoor and
outdoor temperatures. Hence, the proposed control algorithms will provide an improvement to the existing control algorithms in the literature. Additionally, the control algorithms proposed here, will operate the windows optimally and will minimize any waste of energy due to inaccurate position of the openings due to pre-defined position of the windows. For unoccupied periods, the minimum ventilation is provided to maintain as low as possible the internal air temperature and avoid using the mechanical system for longer periods which would result in higher energy consumption. Night ventilation is achieved when the internal temperature is within the acceptable limits for natural ventilation. Due to safety reasons, a restriction of the window opening has been to set to be equal to 20% of the maximum allowable opening area for night ventilation.
For this study both the air drybulb and operative air temperatures will be used to control the systems. In the literature there is not a clear guide whether to use the air drybulb or operative temperature to control the windows and mechanical systems. Although in practise it is more common to use the drybulb temperature to control a system, especially because, most of the sensors are measuring drybulb temperatures, all the standards refer to operative temperature as an index to assess thermal comfort. For all the cases, the airflow network model was set up in EnergyPlus to simulate air movement and hence evaluate the effect of the windows.
Simulation scenarios
The simulations are divided into the base case scenario, where only mechanical systems were used and the mixed-mode operation where different methodologies to determine the setpoint temperatures were used.
1. Base case scenario–mechanical mode only
For the base case scenario, it is assumed that the building operates in fully mechanical mode, windows will be remained closed, throughout the year. This case, will be used to quantify the energy saving potential or the different methodologies to determine the setpoints. For the base case scenario static and dynamic setpoint temperatures will be used for all the locations. More specifically, for Bangalore and Mumbai, India the static heating and cooling setpoints were assumed to be 𝑇ℎ𝑠𝑝= 22 °𝐶 and 𝑇𝑐𝑠𝑝= 27 °𝐶 respectively (Ghawghawe et al.,
2014), whilst for Gatwick, UK 𝑇ℎ𝑠𝑝= 20 °𝐶 and 𝑇𝑐𝑠𝑝= 24 °𝐶. For the dynamic setpoints, the same methodology has been used as described in the subsection “Adaptive setpoints for mixed-mode buildings”.
2. Mixed-mode operation
Static setpoints for mixed-mode buildings
The most common approach to operate a mixed-mode building with mechanical cooling/heating systems, is to set static setpoint temperatures thought the year as it has been used in previous research (Ezzeldin & Rees, 2013; Malkawi et al., 2016). A fixed setpoint temperature was selected because most of the international standards, such as ASHRAE, considers the mixed-mode buildings as fully mechanical buildings, and thus suggest the use of the
Predictive Mean Vote (PMV) model to assess the thermal comfort (Fanger, 1970).
For the base case a dual setpoint thermostat was used with static heating setpoint of 𝑇ℎ𝑠𝑝= 22 ° and cooling setpoint
of 𝑇𝑐𝑠𝑝= 27 °𝐶 for Bangalore and New Delhi, India
while for the UK 𝑇ℎ𝑠𝑝 = 20 °𝐶 and 𝑇ℎ𝑠𝑝= 24 °𝐶 for
heating and cooling respectively. When the internal air temperature is in between the two setpoints, natural ventilation is being used (Figure 3).
Adaptive setpoints for mixed-mode building
The use of a static setpoint can limit the flexibility that a mixed-mode building can provide. More importantly, windows should be operated according to the variation of the outside temperatures, rather than a fixed value. Dynamic setpoints, that vary hourly throughout the year, are optimized for every climate throughout the year and hence it is more likely that the use of dynamic setpoints will lead to higher energy savings. For this study, three different adaptive methodologies were used to calculate the dynamic cooling/heating setpoints for all the cities examined.
• ASHRAE standard 55
Although ASHRAE-Standard-55 (2013) limits the applicability of the model only to free running buildings, previous studies on occupants’ thermal sensation in mixed-mode buildings found that the ASHRAE-Standard-55 is a more appropriate comfort standard to use compared to the traditional PMV model (Deuble & de Dear, 2012). The heating and cooling setpoints are based on equations (1) & (2) respectively, for a 30-day running mean outside air temperature (𝑇𝑜𝑢𝑡) according to 90%
acceptability limits for mean monthly outdoor temperatures ranging from 10-33.5°C (ASHRAE-Standard-55, 2013). When the outdoor air temperature is outside the limits, static setpoint values are used.
𝑇𝐻𝑆𝑃 = 0.31 ∗ 𝑇𝑜𝑢𝑡+ 15.3 (1)
𝑇𝐶𝑆𝑃= 0.31 ∗ 𝑇𝑜𝑢𝑡+ 20.3 (2)
• India Model for Adaptive Comfort (IMAC)
A recent study across several Indian cities, which represent all the climatic zones in India, showed that occupants in natural and mixed-mode ventilated building are more adaptive to the indoor conditions than the ASHRAE or EN15251 would suggest (Manu et al., 2016). Again, for this study the 30-day running mean outside air temperature was used to determine the heating and cooling setpoint temperatures for mixed-mode buildings as described in formulae (3) & (4) respectively. As in the ASHRAE model, the 90% acceptability limits were used. This model is valid for monthly outdoor temperatures ranging from 13-38.5°C (Manu et al., 2016).
𝑇𝐻𝑆𝑃 = 0.28 ∗ 𝑇𝑜𝑢𝑡+ 14.4 (3)
𝑇𝐶𝑆𝑃= 0.28 ∗ 𝑇𝑜𝑢𝑡+ 21.4 (4)
• BS EN15251:2007
For the UK climate, the most appropriate adaptive model to use is the European Standard to determine the setpoint
temperatures for heating and cooling. For the purpose of this study the “Category I” from the BS EN15251 CEN (2007) was used to set the lower and upper limits for the internal air temperature as shown in equations (5) & (6) respectively.
𝑇𝐻𝑆𝑃 = 0.33 ∗ 𝑇𝑜𝑢𝑡+ 16.8 (5)
𝑇𝐶𝑆𝑃= 0.33 ∗ 𝑇𝑜𝑢𝑡+ 20.8 (6)
The 30-day running mean outdoor temperature should be between 10-30°C (BS EN15251 CEN, 2007), which limits the applicability of this model mainly during summer months. When the outdoor temperature is out of these limits, static values for the setpoints are used.
Table 2: Different methodologies to determine the setpoint temperatures Bangalore, India Mumbai, India Gatwick, UK STATIC X X X IMAC X X - ASHRAE X X X EN15251 - - X
Table 2 summarizes which adaptive model was used for each location. All the adaptive models were applicable throughout the year for both Indian cities, whilst in Gatwick the EN15251 and ASHRAE Standard 55 were applicable from May to October due to the low outdoor monthly air temperatures at the other months.
Results analysis and Discussion
This section focuses on the effect of selecting different methodologies to determine the setpoint temperatures on the window operation and on the energy prediction. Additionally, it highlights the discrepancies in the results
from the selection of the drybulb or the operative air temperature as the control parameter of the natural and mechanical systems.
Setpoint temperatures prediction through window operation
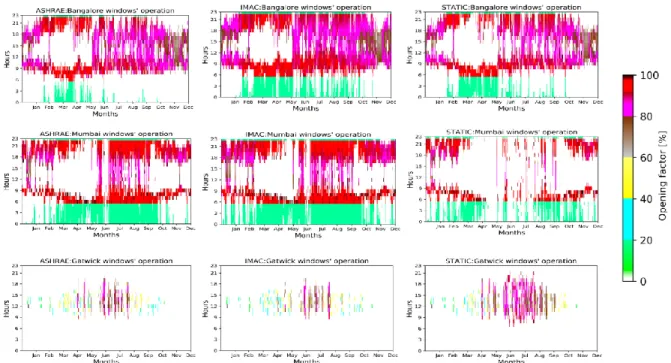
Figure 5 illustrates the annual window operation for all the locations using static and dynamic setpoints. It is noticeable that the selection of static setpoint temperatures for mixed-mode buildings, limits the use of passive cooling during day and night time for both Indian cities. For instance, it was predicted that the use of the proposed control algorithms with the selection of static setpoints resulted in 2278h of natural ventilation, whilst the selection of the adaptive approaches, ASHRAE 55 and IMAC resulted in 4083h and 4840h respectively for Mumbai throughout a year. Similar results were obtained in Bangalore too. The IMAC model favours more the use of windows during night hours and early morning compared to ASHRAE. These differences are explained from the wide range of temperatures, upper to lower limits, that the IMAC model uses (Figure 5). The simulations predicted that natural ventilation solely cannot maintain acceptable indoor conditions for the Indian cities, especially during daytimes, and hence for this period mechanical systems should be used.
The effects on the windows operation is greater for more extreme weather conditions such as in Mumbai compared to moderate climatic conditions of Bangalore.
For the UK, due to the limited applicability of the adaptive theories, mainly because of the low outside air temperatures especially during winter time, the use of dynamic setpoints resulted in less frequent window operation compared to the static setpoints. The models predicted the operation of windows during day-time and mostly during summer months (Figure 5).
Figure 5:Window operation for all the locations using different methodologies to determine the setpoint temperatures. Drybuld air temperature was used as the control temperature. Legend refers to all the graphs.
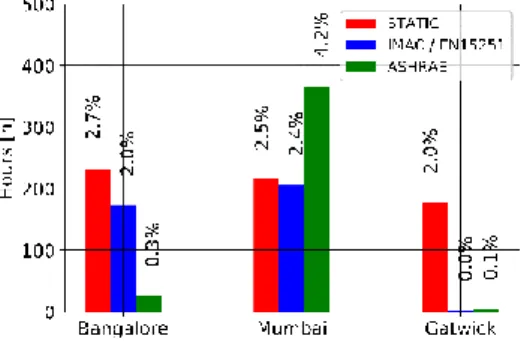
Figure 6 shows the hours of the year during which the internal air temperature was outside the limits. In all the adaptive models, 90% acceptability was considered. For all the cases where dynamic setpoints were used, it was predicted that the percentage of hours that the internal air temperature would be outside the limits is within the 90% acceptability range. The periods of time that the internal air temperature was outside the limits occurred mainly due to the thermal mass of the building as it absorbed more heat due to the high external air temperature and hence it needed more time to reach the upper temperature setpoint, as well as due to the internal heating and solar gains. Hence, although the selection of adaptive models utilizes the use of natural ventilation over a longer period, there are some unavoidable energy penalties since more energy is needed to cool the space at those moments. However, these energy penalties are offset, as Figure 7 shows, throughout the year compared to purely mechanical mode.
Figure 6:Hours of the year the internal temperature was outside the setpoints.
Comparison of energy saving potentials
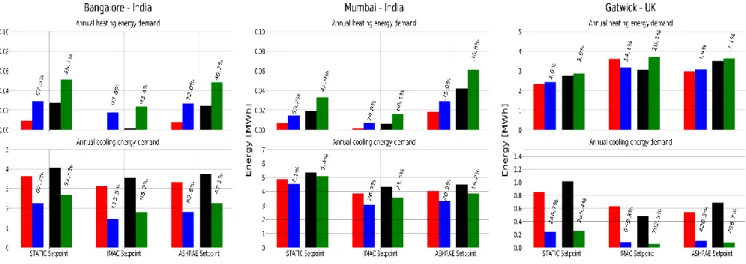
Significant differences were predicted of the energy saving potential during mixed-mode compared to fully mechanical systems. As expected, the energy demand of the building was considerably lower when it was operating in mixed-mode compared to purely mechanical mode (Figure 7). To capture a wider range of cases, and to examine whether the use of drybulb or operative air temperature has an impact on the total energy performance of the building, both control approaches were examined. As previous studies have highlighted in Indian office, the use of drybulb air temperature, for controlling the mechanical systems and windows, resulted in almost 29% less cooling energy demand compared to operative air temperature control (Jain et al., 2011). These results are in line with the outcomes of the research presented in this paper. The simulations predicted the energy cooling demand to be higher, approximately 20% when operative air temperature was used to control the systems compared to drybulb air temperature for the Indian cities. For Gatwick, drybulb air temperature control resulted in almost 10% less cooling energy demand and approximately 20% less heating energy demand.
Figure 7 illustrates the differences in the energy demand predictions for all the cases under all the scenarios. The percentages show the reduction of energy demand between the base case (mechanical systems) and the
mixed-mode operation. For both Indian cities, annual heating demand is negligible compared to the cooling demand. For the cooling demand, as it is highlighted from the graph, for the same conditions it is possible to save up to 100% energy simply by switching from mechanical to mixed-mode. Especially for moderate climates such as Bangalore, mixed-mode operation with the use of dynamic cooling setpoints could result to halve the cooling energy demand. Similarly, in Mumbai, mixed-mode and utilisation of natural ventilation for cooling purposes resulted in almost 30% less demand for cooling. For Gatwick climatic conditions, the operation of the building in mixed-mode did not resulted in energy savings in all cases. This could be explained by the fact that when the windows were open, colder air entered the room and cooled the internal air and hence the heating system had to operate for longer periods to reach the setpoint temperatures. However, the analysis showed that it is feasible to achieve almost 15% reduction in heating demand by operating in mixed-mode by using EN15251 adaptive model to determine the heating and cooling setpoint temperatures.
For most of the cases, the selection of the operative temperature to control the systems resulted in lower energy saving potentials. However, the effective control of a system, and hence the maximum energy saving potential is a complex task. When a system is automatically controlled then it is favourable to use the drybulb air temperature and maximize the saving potentials. When occupants have the control of the systems, then it is more likely that they will sense both the radiant and drybulb component of the temperature and hence it is most likely that they will use the operative temperature to control the system.
Conclusions
The research presented in this paper aims to develop and test control algorithms for mixed-mode buildings in different climatic conditions and quantify their energy saving potential. The most important findings are:
• Operating a building in mixed-mode can achieve savings in the demand for cooling between 7%-40% and at the same time maintain acceptable internal conditions for the occupants for almost 90% of the hours throughout the year compared to fully mechanical conditioned buildings.
• The selection of dynamic setpoint temperatures over static setpoints can result in higher cooling energy saving potential between approximately 7% to 35% in Bangalore and Mumbai respectively. In Gatwick although the saving is higher due to relatively small demand for cooling, the selection of dynamic or static cooling setpoints has less effect. Furthermore, the use of dynamic cooling setpoints can maximize the use of the windows by approximately 2500 more hours per year for Mumbai and Bangalore compared to the static setpoints.
Figure 7:Energy Demand for all the locations under different scenarios • The use of the IMAC model resulted in higher
energy savings for the Indian cities by approximately 8%-24% compared to ASHRAE Adaptive model, while the European EN15251 for Gatwick can reduce the demand for heating by approximately 5% compared to ASHRAE Standard 55 model.
• The use of operative or drybulb temperature as a control variable could have an effect on the window operation and hence the energy demand of a building. The use of operative temperature as the control parameter resulted in 7%-25% reduction in the energy saving potential compared to the drybulb temperature.
Future work and limitations
The following opportunities were identified for future research:
• Optimize the control of natural and mixed-mode ventilation. The proposed control algorithms are based on temperature based control. It would be beneficial to examine more advanced control approaches. For instance, to operate the windows based on the cooling demands of the space rather than on the temperature difference.
• In this study, an ideal load HVAC system was used, which means that it could meet always the demand for cooling/heating. It would be interesting to include different cooling technologies (split AC units, evaporative cooling) and examine whether they have an effect of the performance of the control strategies.
• Include more climatic zones to examine which control strategy and cooling technology is the most appropriate based on the external conditions.
• Implement the control algorithms at an environment chamber to validate the proposed and future control algorithms.
Acknowledgement
This research was financially supported by the Engineering and Physical Sciences Research Council (EPSRC) via the London-Loughborough Centre for Doctoral Training in Energy Demand (LoLo) (grant EP/L01517X/1) and via the research project Low Energy Cooling and Ventilation for Indian Residences (LECaVIR) (grant EP/P029450/1).
References
ASHRAE-Standard-55 (2013) Thermal Environmental Conditions for human occupancy.
Babich, F., Cook, M.J., Loveday, D., Rawal, R., et al. (2017) A new methodological approach for estimating energy savings due to air movement in mixed mode buildings. In: 3rd IBPSA-Italy Conference. 2017 Bolzano, Italy, Proceedings of Building Simulation Applications 2017: 3rd IBPSA-Italy Conference. p.
Brager, G. (2006) Mixed-Mode Cooling. ASHRAE Journal. 48 (August).
Brager, G.S. & de Dear, R.J. (1998) Thermal adaptation in the built environment : a literature review.
Energy and Buildings. [Online] 27, 83–96. Available from: doi:10.1016/S0378-7788(97)00053-4.
BS EN15251 CEN (2007) Indoor Environmental Input Parameters for Design and Assessment of Energy Performance of Buildings Addressing Indoor Air Quality, Thermal Environment, Lighting and Acoustics.
CBE (2007) About Mixed-Mode. [Online]. 2007. Center for the Built Environment (CBE) | University of California, Berkeley. Available from:
http://www.cbe.berkeley.edu/mixedmode/aboutm m.html [Accessed: 20 May 2017].
DECC (2016) Energy Consumption in the UK. Delsante, A. & Vik, T.A. (2000) Hybrid Ventilation:
state of the art review. International Energy Agency, Annex. [Online] 1–135. Available from: http://www.hybvent.civil.aau.dk/puplications/sotar .pdf.
DesignBuilder (2017) Mixed mode. [Online]. 2017. Available from:
http://www.designbuilder.co.uk/helpv1/Content/M ixed_mode.htm [Accessed: 30 June 2017]. Deuble, M.P. & de Dear, R.J. (2012) Mixed-mode
buildings: A double standard in occupants’ comfort expectations. Building and Environment. [Online] 54, 53–60. Available from:
doi:10.1016/j.buildenv.2012.01.021. Dhaka, S., Mathur, J., Brager, G. & Honnekeri, A.
(2015) Assessment of thermal environmental conditions and quantification of thermal adaptation in naturally ventilated buildings in composite climate of India. Building and Environment. [Online] 86, 17–28. Available from: doi:10.1016/j.buildenv.2014.11.024.
DOE (2017) EnergyPlus | EnergyPlus. [Online]. 2017. U.S. Department of Energy’s. Available from: https://energyplus.net/ [Accessed: 30 April 2017]. EIA (2017) Independant Statistics & Analysis. [Online]. 2017. INTERNATIONAL ENERGY OUTLOOK 2016. Available from:
https://www.eia.gov/outlooks/ieo/buildings.cfm [Accessed: 30 March 2017].
EnergyPlus WeatherData (2018) Weather Data by Region | EnergyPlus. [Online]. 2018. EnergyPlus. Available from: https://energyplus.net/weather-region/asia_wmo_region_2/IND [Accessed: 21 February 2018].
Ezzeldin, S. & Rees, S.J. (2013) The potential for office buildings with mixed-mode ventilation and low energy cooling systems in arid climates. Energy and Buildings. [Online] 65, 368–381. Available from: doi:10.1016/j.enbuild.2013.06.004. Fanger, P.. (1970) Thermal comfort: analysis and
application in environmental engineering. Copenhagen: Danish Technical Press. Ghawghawe, K., Manu, S. & Shukla, Y. (2014)
Determining the Trade-offs between Thermal Comfort and Cooling Consumption in Indian Office Buildings. [Online] (December), 1–8. Available from: doi:10.13140/RG.2.1.1061.1288. Heiselberg, P. (2002) Principles of hybrid ventilation.
IEA Annex 35: Hybrid ventilation in new and retrofitted office buildings.803.
Henninger, R.H. & Witte, M.J. (2011) EnergyPlus Testing with Building Thermal Envelope and Fabric Load Tests from ANSI/ASHRAE Standard 140-2011. 1–58.
Jain, V., Garg, V., Mathur, J. & Dhaka, S. (2011) Effect of operative temperature based thermostat control as compared to air temperature based control on energy consumption in highly glazed buildings. In:
Proceedings of Building Simulation 2011: 12th Conference of International Building Performance Simulation Association, 14-16 November. .
[Online]. 2011 Sydney,Australia. p. Available from:
http://www.ibpsa.org/proceedings/BS2011/P_1835 .pdf [Accessed: 22 February 2018].
Kapoor, R., Deshmukh, A. & Lal, S. (2011) Strategy Roadmap for Net Zero Energy Building in India. USAID ECO-III Report.
Levine, M., De la Rue de Can, S., Zheng, N. & Williams, C. (2012) Building Energy Efficiency Best Practice Policies and Policy Packages. Malkawi, A., Yan, B., Chen, Y. & Tong, Z. (2016)
Predicting thermal and energy performance of mixed-mode ventilation using an integrated simulation approach. Building Simulation. [Online] 9 (3), 335–346. Available from: doi:10.1007/s12273-016-0271-x.
Manu, S., Shukla, Y., Rawal, R., Thomas, L.E., et al. (2016) Field studies of thermal comfort across multiple climate zones for the subcontinent: India Model for Adaptive Comfort (IMAC). Building and Environment. [Online] 98, 55–70. Available from: doi:10.1016/j.buildenv.2015.12.019. MODELISAR (2017) FMI [Start]. [Online]. 2017.
Available from: https://www.fmi-standard.org/start [Accessed: 10 May 2017].
Nicol, J.F. & Humphreys, M.A. (2002) Adaptive thermal comfort and sustainable thermal standards for buildings. Energy and Buildings. [Online] 34 (6), 563–572. Available from: doi:10.1016/S0378-7788(02)00006-3.
Nisiforou, O.A., Poullis, S. & Charalambides, A.G. (2012) Behaviour, attitudes and opinion of large enterprise employees with regard to their energy usage habits and adoption of energy saving measures. Energy and Buildings. [Online] 55, 299–311. Available from:
doi:10.1016/j.enbuild.2012.08.034.
Nouidui, T., Wetter, M. & Zuo, W. (2014) Functional mock-up unit for co-simulation import in EnergyPlus. Journal of Building Performance Simulation. [Online] 7 (3), 192–202. Available from: doi:10.1080/19401493.2013.808265. Terkildsen, S. (2013) Development of mechanical
ventilation system with low energy consumption for renovation of buildings PhD thesis.
Wang, L. & Greenberg, S. (2015) Window operation and impacts on building energy consumption. Energy and Buildings. [Online] 92, 313–321. Available from: doi:10.1016/j.enbuild.2015.01.060.