Abstract—This research paper was about comparison between two groups of companies with different characteristics of production system on their supply chain operational performance and potential factors that constitute efficient supply chain operational performance. Data collection was conducted in the Thai manufacturing sector where 407 participants evaluated themselves using an SCM Logistics Scorecard (LSC). The LSC focused on four decisive areas, namely, (i) corporate and inter-organization alignment, (ii) planning and execution capability (iii) logistics performance and (iv) IT implementation and management. The LSC score was compared between assembly production and continuous production groups to identify their strengths and weaknesses. Attempt was made to identify the potential factors leading to improvement of supply chain management for both groups in Thailand.
Index Terms—Production system characteristics, Assembly production, Continuous production, Supply chain operational performance, Factor analysis
I. INTRODUCTION
With the rise of global competition in business sector, individual company may no longer compete solely as independent entity but must do so as supply chain. In keeping with the supply chain management (SCM) perspective, the focal company must develop and manage the information flows, physical flows and relationships that link upstream and downstream partners together. Managing the supply chain, therefore, is obviously a backbreaking mission, and most practitioners would agree that a supply chain is a complicated system. If the system could be managed efficiently, SCM could be a major force in building sustainable competitive edge for the company in highly competitive market.
Previous research [1], [2] have noted that measurement of
Manuscript received July 15, 2010. This work was supported by the Thailand Research Fund and the Commission on Higher Education, contract no. MRG5180337.
K. Y. Tippayawong is with the Industrial Engineering Department, Faculty of Engineering, Chiang Mai University, Chiang Mai 50200 Thailand, phone: 66-53-944126; fax: 66-53-944185; e-mail: [email protected]
A. Sopadang is an assistant professor at the Industrial Engineering Department, Faculty of Engineering, Chiang Mai University, Chiang Mai 50200 Thailand, phone: 66-53-944126; fax: 66-53-944185; e-mail: [email protected]
T. Enkawa is a professor at the Department of Industrial Engineering and Management, Graduate School of Decision Science and Technology, Tokyo Institute of Technology, Tokyo 152-8552, Japan, e-mail: [email protected]
supply chain performance can provide an important foundation in improving efficiency of the entire supply chain. Performance measures can be used not only for driving continuous improvement of the business, but also for setting direction for the future strategies of the firms. Thus, appropriate and accurate performance measurement has been considered to be beneficial in improvement of SCM.
Supply chain performance and practices have been found to be different among companies with different supply chain characteristics. Previous report by Chan [3] compared supply chain performance in three different industries and found that in the electronic industry, achievement of quality, on-time delivery and cost were found to have the highest priority, whereas the logistics service industry concentrated on service accuracy and flexibility. Meanwhile, cost and visibility were found to be the main concerns in the textile industry. Similar findings were reported [4], [5]. It was observed that SCM performance and practices may be influenced by firms’ characteristics. It can be concluded, herein, that one operational practice could not fit all supply chain characteristics. A beneficial practice in assembly production group may no longer contribute significance towards performance improvement in continuous production group
.
Thailand and other newly industrialized countries are now looking for efficient SCM as a means to enhance their competitiveness because their historical advantages of lower labor and raw material costs have faded away with progressive economic development. Accordingly, the aim of this research is to empirically measure supply chain operational performance in the Thailand manufacturing sector and to identify contextual factors which influence operational performance. In particular, the effect of production system characteristic on its supply chain operational performance and its SCM approach will be examined. This study will mainly focus on the comparison between two groups of industry (i) assembly production and (ii) continuous production groups.The managerial approach or orientation to SCM may differ between the two groups of companies.
This finding may provide insight into possible solutions for the firms who attempt to increase their operational performance via implementing SCM in their operations. Appropriate management model will be, therefore, introduced to the firms of different characteristics so as to accomplish their ambitions in improving their supply chain operational performance.
The rest of this paper is organized in the following order. The related previous literatures are reviewed and research
Effect of Production System Characteristic on
Supply Chain Operational Performance of
Thai Manufacturing Companies
hypotheses are proposed and formulated in section II. In section III, data collection with the LSC in Thailand is clarified. Section IV describes the data analysis including a comparative analysis between firms in assembly and continuous production groups. Results from factor analysis which determine orientation to SCM of both groups are further revealed in this section. The conclusion and implication of findings are given in the final section of this paper.
II. BACKGROUND AND RESEARCH HYPOTHESES
In this paper, attempt has been made to analyze the level of operational performance and the performance structure which lead to improved supply chain performance in two groups of companies with different production system characteristics.
Production system characteristic could simply be divided into two main types; continuous (process) production and assembly production. Process production deals with the continuous production of a product in bulk, often by a chemical rather than mechanical process. This system is always operated for make-to-stock product. Since the shortage in raw materials could affect the whole manufacturing process, supplier relationship is considered to be crucial for process production as the input of material must be assured. Meanwhile, assembly production is a line of production in which a number of assembly operations are performed in a set sequence. Speed of movement of an assembly line has to be matched with skills and abilities of the workforce and the complexity of the assembly process to be performed.
From previous studies on Japanese manufacturing sector [6], it was realized that nonstop operations are even more difficult in discrete assembly industries than in process industries. To cope with the demands of nonstop operations, engineers must address problems of part feeding and orientation, line balancing, cleaning, and parts ejection and dislodging. Although machines are not absent from the work, their reliability suffers from parts variations and defects.
From difference in characteristics, it can be observed that assembly production requires high level of integrated internal supply chain with intensive information sharing to simplify its operation, which engages with many decisive factors. Technical training is continuously required in order to match the employees’ skills with the complication of the assembly process. However, it was suggested that higher level of internal manufacturing complexity as detected in assembly production will negatively impact plant schedule attainment and manufacturing cost [7]. Accordingly, the observation of previous works on assembly and continuous production indicated that they require different supply chain operational practices to upgrade their supply chain performance [6], [7]. Similar conclusion was given [3], [4], [5] that supply chain performance and practices have been found to be different among companies with different supply chain characteristics and SCM performance and practices may be influenced by firms’ characteristics.
From previous studies, two hypotheses are derived.
Hypothesis 1: The LSC score from assembly production group is higher than that obtained from continuous production group in terms of average total score and four assessment area score.
Hypothesis 2: Performance structures in building successful SCM are expected to differ betweenassembly and continuous production groups due to their characteristic dissimilarity.
III. RESEARCH METHODOLOGY
A. Data Collection Process and Tools
The SCM logistics scorecard (LSC) was employed in this research as a data collection tool. The scorecard was developed by the Tokyo Institute of Technology in collaboration with the Japan Institute of Logistics Systems [8], [9]. The element of LSC and its superiority over other scorecard were previously discussed [8]. The LSC involves 22 assessment items based on four fundamental areas: (1) Corporate strategy and inter-organization arrangement (2) Planning and execution capability (3) Logistics performance and (4) IT implementation and management. Each assessment item is allocated into five-level rating from 1-5. A detailed description of each level is given, with the 5th level indicated the best practice for each item. This approach could reduce bias among survey respondent and simplify self-assessment process to be more precise, since clear information has been provided at each level in the scorecard.
The LSC was adopted in many researches; (i) to compare supply chain operational performance and influential factors for manufacturing sectors in Japan, China and Thailand [8], (ii) to analyze the impact of institutional environment towards the development of supply chain management [10], and (iii) to identify impact of information technology and SCM organization strategy on corporate financial performance [11]. The context of previous published reports only offer the general idea of the Thai manufacturing sector but not for the detailed classification of the company using production system characteristics like this work.
The LSC has been introduced to the Thai manufacturing sector and to logistics service providers since 2006, as a result of expanding LSC research to international comparison [8]. Since then, data collection has been carried out and continuously updated on a yearly basis to detect changes and improvement of participants.
Two approaches of data collection were conducted; direct interview of high leveled managers by the research team and self-assessment by each company. Therefore, the total score with a maximum of 110 from 22 assessment items were collected. In using the LSC, feedback reports were conveyed back to the companies as an incentive for data provision. The report was used to inform company’s status of competitiveness over its rivals. This process could possibly maintain the reliability level of the data achieved.
B. Data Analysis
companies were divided into two groups; assembly and continuous production systems.
Reliability analysis was then conducted to verify the reliability of the LSC as a data collection tool for this research. After that, initial comparison was made on total score, area score and assessment item score. This approach could identify the level of operational performance and indicate the strengths and weaknesses of each group.
A factor analysis was subsequently undertaken to clarify performance structure of both groups. The result from this analysis could indicate the significant operations required for each group to increase their supply chain operational performance.
IV. RESULTS AND DISCUSSION
A. Continuous and Assembly Production Category The initial comparison in this section was performed in this section with the purpose of verifying hypothesis 1, that the LSC score from assembly production group is higher than that obtained from continuous production group in terms of average total score and four assessment area score.
In this research, 407 participating companies have been classified into two main groups, based on their production system characteristics, namely, process production and assembly production. The classification was conducted in accord with the definition of industry classification [6], [12], [13]. Continuous production category consisted of food, beverage, cloth and apparel, paper, chemicals, pharmaceuticals, household goods, and steel industry. Assembly production included machinery for general and business use, electrical machinery, automobile and motorcycle, precision machinery and appliances, electronic parts and devices for automotive industry and others, machinery parts for automotive industry.
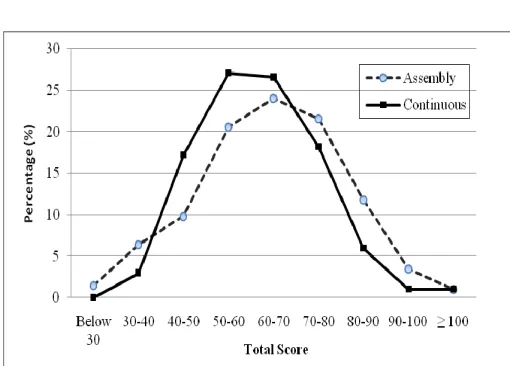
According to the classification, 204 companies were categorized as assembly production and 203 companies were in the category of continuous production. This signified equally classification of participants in the research. The data attributed of total score between assembly and continuous groups are given in Table 1 and Fig. 1. The result indicated that the total score of both groups are not markedly different. However, the data of assembly group showed higher degree of variation. Reliability analysis of the LSC was conducted after company classification. The results are shown in term of Cronbach’s coefficient alpha for 22 items at 0.942 and 0.915 from assemble and continuous groups, respectively. These results indicate high reliability of the LSC as a data collection tool for this research.
Initial comparison of four assessment areas between assembly and continuous production groups revealed that assembly group performed better than continuous production group in most areas, where significant level could be found in area 3) logistics performance and area 4) IT implementation and management. The results of assessment area comparison are again displayed in Table 2.
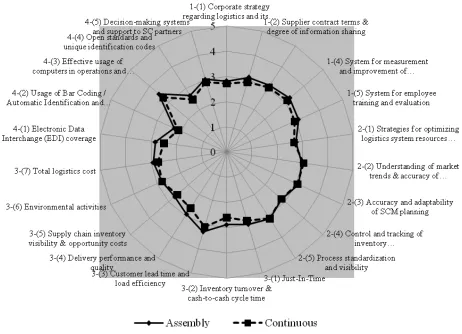
[image:3.595.301.547.74.184.2]Further analysis has been conducted to investigate assessment items which affected the overall area scores, which could be seen in Figure 2. Considering logistics performance (area 3), items which made score significantly
Table 1 Data attributes of total score between continuous and assembly production category
Assembly P. Continuous P.
Number of Data 204 203
Mean 64.99 61.94
Standard Deviation 15.88 13.07
Variance 252.1 170.9
Median 66.63 61.00
Mode 52.00 72.00
Range 75.00 69.00
Maximum 103.0 101.0
[image:3.595.300.549.233.318.2]Minimum 28.00 32.00
Table 2 The average scores of four areas between Assembly and Continuous Production group
Assessment Area Assembly P. Continuous P. t-value1 Ave. SD Ave. SD
1) Corporate and
Inter-organization alignment 3.077 0.792 2.907 0.705 1.803* 2) Planning and execution
capability 2.965 0.833 2.946 0.689 0.318 3) Logistics performance 2.929 0.779 2.748 0.676 2.579**
4) IT implementation and
management 2.856 0.852 2.651 0.730 2.646**
1 *= 5% significant, **= 1% significant
Figure 1 The distribution chart of total score between Continuous and Assembly production category
different between the two groups were found to be inventory turnover and cash to cash cycle time (Item 3-2), customer lead time (Item 3-3) and delivery performance (Item 3-4). Assembly group outperformed continuous group in all previously identified items. In view of area 4, assembly group focuses better on the electronic data interchange coverage (Item 4-1) and the effective use of IT and related software to simplify supply chain operations and decision making (Item 4-3). However, continuous production group performed better but not at a significant level in only two operations, which are understanding of market trends and accuracy of demand forecasting (Item 2-2) and the action taken on environmental activities (Item 3-6).
[image:3.595.304.559.334.517.2]complexity as detected in assembly production will negatively impact plant schedule attainment which is one of the assessment indicators (Item 2-3) in area 2 of the LSC.
B. Performance Structures
A factor analysis was carried out during this study in order to verify hypothesis 2, that different type of production system characteristic should have different factor structure that constitute efficient supply chain operational performance. The factor analysis was conducted separately with the data from two groups categorized by production system characteristics, 203 samples from assembly production and 204 from continuous production firms.
The initial solution was determined using principal axis factoring with the constraint of an eigen-value of more than one. Result from the first group signified that five factors were extracted with the cumulative contribution rate of 47.20% while three factors were obtained from assembly production group with the cumulative contribution rate at 49.62%. In order to simplify the factor for comparisons between the two groups, the number of extracted factor from the continuous production group was limited to three during the principal axis factoring analysis. Therefore, the contribution rate of this group was reduced to 42.00% and three factors were obtained, being equally with the result from assembly production group.
Promax rotation was then employed because the correlations among three factors were assumed and this method was capable of simplifying the factor analysis. As a result, the pattern matrixes of continuous and assembly production group are given in Table 3. The larger factor loading of more than 0.4 indicated strong relationship between each item and factors as highlighted in the pattern matrix table.
From the continuous production group, three factors were determined:
Factor 1: Inter-organization alignment and IT utilization Factor 2: Responsiveness and flexibility
Factor3: Process standardization and customer satisfaction
With respect to the results from assembly production group, three factors were also discovered:
Factor 1: Corporate strategy and inter-organization alignment
Factor 2: Responsiveness and flexibility
Factor 3: IT implementation and inventory turnover The factor analysis result appeared to support Hypothesis 2 that the performance structures of companies with different production system characteristics were different. The observation from continuous production group implied that they considered inter-organization issue and IT utilization (technical issue) simultaneously. On the other hand, assembly group agreed that the inter-organization issue and IT implementation can be concerned separately. Explanation could be made here that assembly production companies may implement the efficient system that collaborates upstream suppliers before the emerging of extensive IT utilization. Once the IT became crucial in supply chain management, it only plays a role separately as an enabler to achieve better SCM performance. However, high and low technology groups have similar concern that supply chain responsiveness
and flexibility should be considered simultaneously as can be noticed from the second factor of both groups.
Further observation has been placed on the third factor of continuous group that the customer satisfaction can be improved through well-trained employees with the achievement of visible process standardization. The efficient usage of IT in assembly process group seemed to allow positive impact on inventory turnover and cash to cash cycle time, as can be detected from the third factor extracted from this group.
V. CONCLUSIONS
In this work, two groups of firms with different level of production system characteristics have been compared in the aspect of supply chain operational performance. The LSC has been utilized as a data collection tool. Accumulated data from both assembly and continuous production groups were compared for each assessment item. It was found that the average score were not markedly different in area 2) Planning and execution capability. However, it was clearly seen that assembly group performed significantly better than continuous production group in terms of logistics performance (Area 3) and the implementation of IT (Area 4).
The “performance structure” of assembly production group and continuous production group were determined from factor analysis. The finding revealed that potential factors which constitute the efficient supply chain operational performance in the two systems of production characteristics considered were different, owning to the complexity of upstream members, and the complication of production system.
More findings from the factor analysis denoted that the assembly production group considered the usage of decision making system and support to supply chain partner together with inter-organization alignment. This implied that win-win solution with supply chain partner could increase the credibility and reliability from both upstream and downstream members. Moreover, extensive usage of IT was found to have positive correlation with inventory turnover and cash to cash cycle time for the assembly production group. However, the results related to some financial indices were derived solely from factor analysis. Further in-depth study should be performed to verify this finding by collecting financial data and conducting regression analysis with factor score extracted from the factor analysis.
With respect to continuous production group, they believed that the visibility of process standardization could strengthen the system for improving customer satisfaction and system for employee training and evaluation. The elucidation could be made that when the standard is put along the supply chain operations, the related system such as customer satisfaction measurement and employee evaluation is also established to complete the supply chain system. From the observation of both groups, it was conclusive that assembly and continuous production companies may develop different practices to achieve what they aim for.
Table 3 Pattern Matrix of 203 Continuous Production and 204 Assembly Production Company (after Promax rotation)
Assessment Item Assembly P. (204) Continuous P. (203)
1 2 3 1 2 3
1-(1) Corporate strategy regarding logistics and its importance 0.490 0.089 0.196 0.440 -0.029 0.307
1-(2) Definition of supplier contract terms & degree of information sharing 0.725 -0.073 0.097 0.486 -0.172 0.350
1-(3) Definition of customer contract terms & degree of information sharing 0.654 0.012 -0.058 0.524 -0.108 0.213
1-(4) System for measurement and improvement of customer satisfaction 0.630 0.073 -0.021 -0.122 0.045 0.644
1-(5) System for employee training and evaluation 0.480 0.063 0.069 0.050 0.016 0.685
2-(1) Strategies for optimizing logistics system resources based on design for
logistics 0.559 0.081 0.126 0.205 0.225 0.318
2-(2) Understanding of market trends & accuracy of demand forecasting 0.322 0.493 -0.087 -0.014 0.485 0.237
2-(3) Accuracy and adaptability of SCM planning 0.310 0.692 -0.189 -0.236 0.756 0.136
2-(4) Control and tracking of inventory (product/parts/WIP): accuracy and
visibility 0.231 0.563 -0.017 -0.036 0.539 0.228
2-(5) Process standardization and visibility 0.548 0.280 -0.023 -0.021 0.150 0.635
3-(1) Just-In-Time 0.175 0.612 0.014 0.045 0.580 -0.021
3-(2) Inventory turnover & cash-to-cash cycle time -0.148 0.399 0.419 0.123 0.620 -0.038
3-(3) Customer lead time (from order placement to receipt) and load
efficiency -0.123 0.647 0.206 0.149 0.143 0.283
3-(4) Delivery performance and quality -0.059 0.652 0.132 0.067 0.423 0.221
3-(5) Supply chain inventory visibility & opportunity costs 0.106 0.380 0.260 0.420 0.434 -0.181
3-(6) Environmental Activities 0.160 0.463 0.126 0.150 0.267 0.230
3-(7) Total Logistics Cost -0.083 0.513 0.422 0.493 0.332 -0.146
4-(1) Electronic data interchange (EDI) coverage -0.167 0.267 0.614 0.729 0.067 -0.057
4-(2) Usage of bar coding / automatic identification and data capture (AIDC) 0.301 -0.013 0.462 0.709 -0.090 -0.068
4-(3) Effective usage of computers in operations and decision-making 0.274 0.045 0.381 0.577 -0.056 0.109
4-(4) Open standards and unique identification codes 0.307 -0.172 0.628 0.513 0.089 -0.045
4-(5) Decision-making systems and support to supply chain partners 0.400 0.036 0.373 0.361 0.314 -0.057
[image:5.595.69.531.387.721.2]analysis to identify which SCM factors have positive contribution on the financial indicators. This may provide implication to different industry classification such as product complexity or technology intensity where two groups of companies with different levels of technology intensity are compared. Companies with different business characteristics may wish to implement appropriate supply chain practices to improve their financial performance. The findings from this research potentially have implications for the extensive manufacturing sector in a developing country, where improvements on supply chain operational performance are targeted. It can be further concluded from this research that similar operational practice in one company may result in different outcome in other companies where business characteristic is detected to be different.
ACKNOWLEDGMENT
The authors would like to thank research staff of the SCEM Research Unit, Faculty of Engineering, Chiang Mai University for their assistance with data collection.
We wish to declare that the TRF and CHE do not have to agree with opinions expressed in this article.
REFERENCES
[1] A. Gunasekaran, C. Patel, R. E. McGauhey, “A framework for supply chain performance measurement”, International Journal of
Productions Economics 2004, vol. 87, pp. 333-347.
[2] M. E. Kuwaiti, J. M. Kay, “The role of performance measurement in business process re-engineering”, International Journal of
Operations and Production Management 2000, vol. 20, pp.
1411-1426.
[3] F. T. S. Chan, “Performance Measurement in a supply chain”,
International Journal of Advance Manufacturing Technology 2003,
vol. 21, pp. 534-548.
[4] S. Li, B. Ragu-Nathan, T. S. Ragu-Nathan, S. S. Rao, “The impact of supply chain management practice on competitive advantage and organizational performance”, OMEGA: The International Journal
of Management Science 2006, vol. 34, pp. 107-124.
[5] K. Yaibuathet, T. Enkawa, S. Sadami, “Effect of industrial type and ownership status on supply chain operational performance in a developing country”, International Journal of Integrated Supply
Management 2008,vol. 4, pp. 322-354.
[6] J. A. Kukowski, W. R. Boulton, “Electronics manufacturing and assembly in Japan”, Panel report. Japan Technology Evaluation Center. pp. 97-114. Available: http://www.wtec.org/loyola/ep/c5s1. htm
[7] C. C. Bozarth, D. P. Warsing, B. B. Flynn, E. J. Flynn, “The impact of supply chain complexity on manufacturing plant performance”,
Journal of Operations Management 2009, vol. 27, pp. 78-93.
[8] K. Yaibuathet, T. Enkawa, S. Sadami, “Supply chain operational performance and its influential factors: cross national analysis”,
Journal of Japan Industrial Management Association 2007, vol. 57,
pp. 473-482.
[9] K. Arashida, T. Enkawa, A. Hamasaki, S. Suzuki, “Developing the SCM logistics scorecard and analyzing its relation to the managerial performance”, Journal of Japan Industrial Management
Association 2004, vol. 55, pp. 95-103.
[10] K. Yaibuathet, T. Enkawa, S. Sadami “Influences of institutional environment toward the development of supply chain management”, International Journal of Production Economics
2008, vol. 115, pp.262-271.
[11] K. Yaibuathet, T. Enkawa, T. Yoshika, “Impact of information technology and SCM organizational strategy on corporate financial performance and its cross national comparison”, International Journal of Information Systems for Logistics and Management
2007, vol. 3, pp.13-24.
[12] OECD, OECD Science, Technology and Industry Scoreboard
2001: Towards a Knowledge-based Economy. Paris: OECD
Publishing 2001, ch.2.