ORIGINAL ARTICLE
Comparative study of the optimal ratio of biogas
production from various organic wastes and weeds
for digester/restarted digester
Ugochukwu C. Okonkwo
a,*, Ejiroghene Onokpite
a, Anthony O. Onokwai
ba
Nnamdi Azikiwe University, Awka, Anambra State, Nigeria
b
Landmark University, Omu-Aran, Kwara State, Nigeria
Received 5 August 2015; accepted 8 February 2016 Available online 13 February 2016
KEYWORDS Digester; Optimal ratio; Biogas production; Organic wastes; C/N ratio
Abstract This study carried out a comparative analysis of the rates of production of biogas from various organic wastes and weeds which enabled the determination of optimal ratio of poultry droppings to domestic wastes. Digester was prepared for the anaerobic fermentation of the domes-tic wastes and weeds. The gas production did not begin until the 7th day and increased steadily at first, and then increased sharply until it reached its peak on the 18th day before declining. The total gas produced within the 22 days of experimentation was 1771 cm3. The maximum volume of gas
amounting to 809 cm3was produced by the sample containing 50% poultry dropping and 50% weeds. This indicates that this sample possesses the best C/N ratio of all the samples prepared. For restarted digester, gas production began on the 2nd day as against the 7th day with no restarted digester and the gas production peaked earlier.
Ó2016 The Authors. Production and hosting by Elsevier B.V. on behalf of King Saud University. This is an open access article under the CC BY-NC-ND license (http://creativecommons.org/licenses/by-nc-nd/4.0/).
1. Introduction
The process of producing biogas by the anaerobic fermenta-tion of organic matter is a technology which is gaining popu-larity daily and is more widely adopted for use. This development is due to its ability to provide relief to man from two of the problems encountered in the course of living from day to day. They are the problem of how to acquire energy
in sufficient amount for purpose of cooking, heating, lighting and running of machinery, on one hand and the problem of proper disposal of waste in a manner that it will not cause harm to man or damage the environment on the other. The source of energy is grouped into two categories namely renew-able and non-renewrenew-able sources of energy and biogas belongs to the former.
Organic wastes are of plant and animal origin and are bio-degradable, i.e. they can be broken down by micro-organism. Example includes crop residue, animal dropping and animal carcasses. Ye et al. (2008) observed that organic wastes are usually treated by composting, stabilisation ponds, aerobic digestion, and anaerobic digestion. The treatment helps to reduce the harmful microbes present in the waste and make them more stable. Anaerobic digestion serves a dual function
* Corresponding author.
Peer review under responsibility of King Saud University.
Production and hosting by Elsevier
King Saud University
Journal of King Saud University – Engineering Sciences
www.ksu.edu.sawww.sciencedirect.com
http://dx.doi.org/10.1016/j.jksues.2016.02.002
1018-3639Ó2016 The Authors. Production and hosting by Elsevier B.V. on behalf of King Saud University. This is an open access article under the CC BY-NC-ND license (http://creativecommons.org/licenses/by-nc-nd/4.0/).
by treating the waste and obtaining biogas by the anaerobic fermentation of organic waste thus serving a dual function of treating organic waste to make them more stable and less harmful to the environment, and providing energy for cooling, lighting, heating, and running of machinery.
1.1. Organic wastes
Organic wastes are materials, which are of plant and animal origin. They include the remains of dead plants and animals such as stem, leaves, twigs, roots, feathers, hair, blood and opals. As well as waste generated by animals e.g. dung. They are said to be biodegradable i.e. they can be broken down by micro-organisms into smaller molecules.Feijoo et al. (1995)
observed that the bacteria act on the complex molecules such as proteins, fats and carbohydrates and break them down to simpler molecules like ammonia, carbon dioxide and nitrides. They are considered as nuisance due to their effect on the envi-ronment. They are highly unstable due to the gradual degrada-tion (Yan˜ez et al., 2009). This is because as the decomposition occurs, oxygen is used up. They are also considered as nui-sance because of their odours, pH, etc. Treatment of organic waste involves the reducing of the odour level, the quantity and stabilising the organic waste before disposal. Methods used for treatment include composting, stabilisation ponds, aerobic digestion, anaerobic digestion, and incineration. There is an increasing use of anaerobic digestion for the treatment of waste. This is due to the ability to obtain energy from the waste as it is being treated. The process produces a gas known as biogas which can be used for heating, cooking, and running of machinery. Vaclar and William (1980) stated that biogas production has been greatly exploited by China and India, most especially in the rural areas thereby reducing dependence on fossil fuels.
1.2. Biogas
Biogas is the gas obtained when organic matter decomposes in the absence of oxygen. According to Hendriks and Zeeman (2009), it is called biogas because it is obtained from biomass (plant and animal remains). It is produced by the action of anaerobic microorganisms on organic matter. They metabolise the organic matter with the aid of enzymes reducing the large molecules e.g. carbohydrate, proteins and fats to smaller mole-cules e.g. CH4and CO2to H2. The process requires the
com-plete absence of oxygen to take place. The gas produced is a mixture of gases such as methane, carbon (IV) oxide, and hydrogen sulphide.
The gas which is also known as marsh gas, sewage gas, and dun gas is colourless and flammable with a characteristic odour. It contains methane (45–80%), carbon (IV) oxide (27–45%), nitrogen (0.5–3%), hydrogen (1–10%), carbon monoxide (0.1%), oxygen (0.1%), and hydrogen sulphide present in trace amounts. It has a calorific value of 5.5–7.5 kwh/m3. It rises
slowly in air and dissipates due to methane which is slightly lighter than air and carbon (IV) oxide which is heavier than air.Himanen and Ha¨nninen (2011)stated that the composition of the gas is dependent on the nature of the material used as plants tend to produce gas with more amount of carbon (IV) oxide. The amount of gas produced per kg of material also varies with the type of material used. The quality of biogas produced
depends on the carbon to nitrogen (C/N) of the materials used. The gas is difficult to compress as much as 34,000 KN/m2to
liq-uefy it. Biogas can be used for cooking, heating and running of machinery. Most times, special modifications are needed for an efficient use of the gas.
Carbon (IV) oxide and Ammonia are both removed by passing the gas through a solution of calcium hydroxide (Ca (OH)2). They both react with the solution to give calcium
car-bonate and Ammonium Carcar-bonate respectively. Hydrogen sulphide is removed by passing the gas through a desiccant such as calcium chloride, (Kompogas, 2011). The calcium chloride can be regenerated by heating it to drive off the water. For cooking purposes gas may be used without scrubbing or scrubbing will only involve removal of H2S and water. This
is because methane has a flammability limit between 5% and 15% by volume of air. Thus leaving the carbon (IV) oxide enables it to attain this mixing ratio with air easily. When the gas is used for running machinery, H2S, H2O and NH3
are removed to prevent corrosion of metal parts. Carbon (IV) oxide is removed to increase combustibility of gas. Biogas produced may be used directly from the digesters or it may be stored in tanks which may be fixed roof or float roof type. The floating roof type enables compression of gas.
1.3. Methane
The importance attached to biogas is due entirely to the pres-ence of methane in the gas. It is the major constituent of the gas making up (45–80%) of the biogas produced. It is a mem-ber of the alkane or paraffin series of hydrocarbons with a gen-eral formula CnH2n+2.It has a molecular formula of CH4, with
a molecular mass of 16 g. It is also called a marsh gas because it is formed by anaerobic decomposition of vegetable matter in swampy land. Coal miners know it as fire damp because mixtures with air are combustible. It is a major constitute of natural gas and coal gas. Methane is a gas at room tempera-ture with a boiling point of 16°C and a melting point of 180°C. It is a colourless, odourless, and tasteless gas, it has a density of 0.65 g/dm3 at 20°C, and is therefore less dense than air. It has an upper flammability limit of 15% by volume of air, and a lower flammability limit of 50% by volume of air.
1.4. Anaerobic digesters
Anaerobic digesters are containers or enclosures from which oxygen has been restricted with an outlet for gas. They are arti-ficial oxygen-deprived environment for the decomposition of organic matter. Biogas produced during the anaerobic decom-position of the organic matter leave the gas outlet provided on the digester. They can be constructed from drums, tins, con-crete, bottle, etc. The size of the digester depends on the scales of operation. It is basically an air-tight container with an outlet for gas. The gas may be collected with a separated gas collector or used directly from the digester. The digester may be oper-ated as a batch or continuous process, (Dinsdale et al., 2000).
1.5. Anaerobic fermantation
According to Chonker (1983), biomethanation involves the anaerobic fermentation of CO, CO2, and H2 to methane,
anaerobic fermentation is most often considered as the spitting of a substrate into two or more fragments, past oxidised and compound. Overall, anaerobic decomposition of animals and plants is a complex association of much successive fermenta-tion by an array of different organisms.
1.6. Empirical studies
Several studies that analyse and compare the methane produc-tion potential of low number of different crop species already exist (e.g. Amon et al., 2007; Dandikas et al., 2014; Gisse´n et al., 2014; Triolo et al., 2011). However, the optimal ratio of the selected species handled in this study has not been deter-mined before.
Different parameters have been reported to be correlated with the methane production potential of biomasses and sev-eral models have been developed for the prediction of specific methane yields from biomasses. Promising correlations have previously been found for several chemical components such as acid detergent lignin (ADL), cellulose, acid detergent fibre (ADF), hemicellulose and crude fat (Dandikas et al., 2014; Gunaseelan, 2009; Rath et al., 2013; Triolo et al., 2011). How-ever, correlation studies are usually not based on the optimal ratio of the mix as they focus on differences in methane yields within one crop species.
On a larger scale, Herrmann et al. (2016), handled large scale of biogas species. From their study, silage fermentation characteristics affect methane production significantly. They proposed that parameters of silage fermentation be considered for the evaluation of methane formation from ensiled biomass. Besides methane production characteristics, biomass yields, crop rotation effects, site-specific requirements and costs and environmental effects of biomass supply further need to be taken into account for the design of sustainable crop rotations. Also, in a related study byNakisa (2013), he found that when a higher amount of oxygen (lower CH4/O2ratio) is used at the
entrance of the reactor, methane conversion would reach a maximum percent which leads to an increased production of carbon oxides.
2. Materials and methods
2.1. Collection and preparation of materials
Poultry dropping, orange peelings, and groundnut husk were the domestic wastes used. The weeds used were carpet grass (Axonopus compressus) and goose grass (Eleusine indica). The poultry droppings were obtained from a poultry farm in Oghara. The waste was obtained dry. It was packed into sack before being transported to the site of the project work. The orange peelings and groundnut shell were obtained from rooms in the male hostel of the Delta State Polytechnic, Otefe, Oghara. They were obtained fresh and collected in polythene bags before being transported to the site of project work. The weeds were collected fresh. They were harvested within the hostels of the Delta State Polytechnic, Otefe, Oghara. After cutting they were collected in a polythene bag and transferred to the site of project work. The materials used for the project work were not dried before use. No chemical treatment was carried out on the materials before use. The poultry dropping was used as collected. The orange peelings were beaten into
pulp before use. The groundnut husk was beaten before use. The weeds were chopped into small sizes before use.
2.2. Apparatus used for the project
Thermometer (1–110°C).
Delivery tube.
Measuring cylinder (10 ml, 100 ml, 250 ml, and 500 ml).
Weighting balance (triple beam balance model 700).
Bunsen burner.
Digesters.
The digesters were made of transparent plastic containers of capacity 500 cm3and 1250 cm3. They were wrapped in black
polythene bags to keep out light. This was done since it was not known if the bacteria are sensitive to light. The gas pro-duced leaves the digester by means of the delivery tube and is connected into the measuring cylinder which was used as the gas measuring device. The delivery tube has a tap for reg-ulating gas flow. No heat was applied to the setup. But temper-ature was read daily.
2.3. Experimental procedures
SETUP 1: This was done to demonstrate the production of biogas by the anaerobic fermentation of weeds and domes-tic waste.
Procedure: 30 g of poultry droppings, 30 g of weeds, and 30 g of orange peelings and groundnut shell were weighed on the plastic container of capacity 1250 cm3. 950 cm3of tap water was added to the content of the container. It was then stirred after which the content was allowed to stand for a day. The digester was then sealed and the entire setup arranged.
SETUP 2: This was done to determine the ration of poultry droppings to weeds, and poultry droppings to orange peel-ings and groundnut shell which will be required for opti-mum gas production.
Procedure:
SETUP 2A: 25% poultry dropping: 75% weeds.
10 g of poultry dropping and 30 g of weeds were weighed into the plastic container of 500 cm3capacity. 400 cm3of
water was added and the content of the container was then stirred after which the setup was arranged.
SETUP 2B: 50% poultry dropping: 50% weeds.
20 g of poultry dropping and 20 g of weed was weighed into the plastic container of 500 cm3capacity. 400 cm3of water
was added and the content of the container was then stirred after which the setup was arranged.
SETUP 2C: 75% poultry dropping: 25% weeds.
30 g of poultry dropping and 10 g of weed was weighed into the plastic container of 500 cm3capacity. 400 cm3of water was added and the content of the container was then stirred after which the setup was arranged.
SETUP 2D: 25% poultry dropping: 75% groundnut shell. 10 g of poultry dropping and 30 g of groundnut shell was weighed into the plastic container of 500 cm3 capacity. After which 400 cm3 of water was added before it was
stirred.
SETUP 2E: 25% poultry dropping: 75% groundnut shell. 10 g of poultry dropping and 30 g of groundnut shell was
weighed into the plastic container of 500 cm3 capacity.
After which 400 cm3 of water was added before it was stirred.
SETUP 3: This was done to determine the burning charac-teristics of the gas produced.
Procedures: 10 g of poultry dropping and 200 g of weeds were weighed into reagent bottle; 1500 cm3 of water was added. The content of the bottle was agitated; the bottle was then covered and sealed. The setup was arranged with a Bunsen burner in place of the measuring cylinder. SETUP 4: This was done to determine the time taken for digester to start production when it is activated with slurry from an already functioning digester.
Procedure: 30 g of poultry and 70 g of weed was weighed into the plastic container of capacity 1250 cm3. 400 cm3of used slurry was added to the container. 500 cm3 of tap water was added to the content of the digester. The delivery tube was connected into the measuring cylinder which was as the gas measuring device. No heat was applied as the ambient temperature was 29–32°C.
3. Results and discussions
3.1. Results for the production of biogas by the anaerobic fermentation of weeds and domestic waste
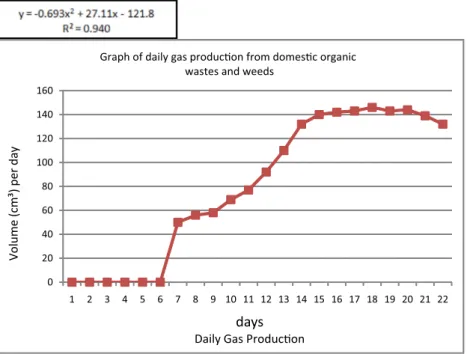
The result obtained from the SETUP 1 which demonstrated the production of biogas by the anaerobic fermentation of weeds and domestic waste is shown inFig. 1.
Fig. 1shows the daily gas production from 30 g of poultry dropping, 30 g of weeds, 30 g of orange peeling and 30 g of groundnut husk. The figure also shows the value of the coeffi-cient of determination (R2) which is 0.94 and the trendline equation for biogas production per day. It is important to state that since the gas production started from day seven,
the trendline only captured the period of gas production (i.e. starting from day seven). TheR2value was close to 1 which
indicates a good measure that future outcomes are likely to be predicted well by the trendlines. In other words, the equa-tion result can come out true to reality up to the above percent-ages when applied.
On the other hand,Fig. 1clearly shows that gas production did not begin until the seventh day. During the period between set-up and initial gas production the microorganism responsi-ble for the process were completely inactive. The aerobic bac-teria present were using up all the oxygen present in the digester during this period. After all oxygen has been used up, the acid forming bacteria became active and gas produc-tion began. But this initial gas will be mostly carbon (IV) oxide. As the fermentation progresses, subtracts required for the second phase will be produce in more quantity. At this point the production of methane will begin. The amount of methane present in the gas will continue to increase until it reaches its maximum percentage by volume of the biogas pro-duced. Gas production increased steadily at first, and then increased sharply until it reacheed its peak on the 18th day. Gas production remained stable around the period of peak production until it started declining gradually.
At the beginning of gas production the anaerobes present in the organic material became active and began increasing in population. When gas production began to rise, they were fully established and were acting on more substrate. At the peak of production, they were acting on the maximum amount of organic matter possible. After this point, gas production began to drop because the excess substrates were being converted to methane. At this point also, there is a steady decline in the amount of substrate available to the bacteria to act on. There is also a decrease in either carbon or nitrogen available for use. When one becomes exhausted, the process slows gradually to a stop. This decline continues until gas production gradually comes to an end. While the process progresses, the condition
0 20 40 60 80 100 120 140 160 1 2 3 4 5 6 7 8 9 10 11 12 13 14 15 16 17 18 19 20 21 22
Volume (cm³) per day
days
Daily Gas ProduconGraph of daily gas producon from domesc organic wastes and weeds
Figure 1 Daily gas production from 30 g of poultry dropping, 30 g of weeds, 30 g of orange peeling and 30 g of groundnut husk as obtained from SETUP 1.
becomes more appropriate for the methane forming bacteria. This led to an increase in the percentage composition of methane in the biogas produced until the maximum level is reached. Thus as fermentation approaches the end, the burning characteristics of the biogas improves.
3.2. Results of ratios required for optimum production
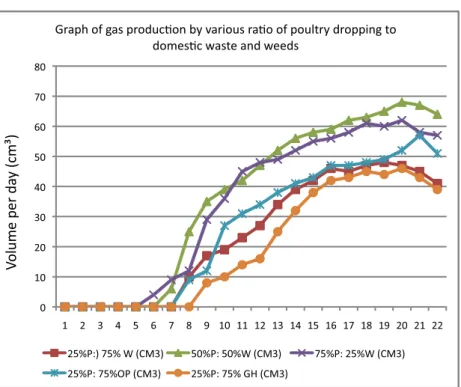
The results obtained from experimental SETUP 2A to 2E which were used to determine the ratio of poultry droppings to weeds and poultry droppings to orange peelings and groundnut shell which will be required for optimum gas pro-duction is shown inFig. 2. Keys used in describing r graph legend in Fig. 2: P – (poultry dropping), W – (weeds), OP – (orange peeling) and GH – (groundnut husk).
Biogas production began last in the sample made up of 25% poultry dropping and 75% groundnut shell. This may be due to the high cellulose content of the groundnut shell. The sample also has a low bacteria digester. The small amount of anaerobic bacteria present will take more time to establish itself and begin biogas production. The sample made of 25% poultry dropping and 75% weed, and those made up of 25% poultry dropping and 75% orange peeling began the produc-tion of gas on day 8. This shows a similarity in chemical com-position of both the weeds and the orange peeling. The maximum volume of gas 809 cm3was produced by the sample
containing 50% poultry dropping and 50% weeds. This indi-cates that this sample possesses the best C/N ratio of all the samples prepared. The C/N ratio, which is fully written as car-bon to nitrogen ratio is regarded as the ratio of the elemental carbon present in the material to the elemental nitrogen pre-sent in the material. Different materials have their C/N ratio, but mixture of different materials can alter the overall C/N ratio of the total feedback. The result shows that this sample
contains the C/N ratio which approaches the optimum C/N ratio of 30:1. Thus the sample containing 25% poultry drop-ping and 75% groundnut shell had the least desirable value of C/N ratio. The bacteria responsible for the anaerobic pro-cess required both elements, as do all living organisms, but they consume carbon roughly 30 times faster than nitrogen. Assuming all other conditions are favourable for biogas pro-duction, a carbon–nitrogen ratio of about 30:1 is ideal for the raw material fed into a biogas plant. A higher ratio will leave carbon still available after the nitrogen has been con-sumed, starving some of the bacteria of this element. These will in turn die, returning nitrogen to the mixture, but slowing the process. Too much nitrogen will cause this to be left over at the end of digestion (which stops when the carbon has been con-sumed). The correct ratio of carbon to nitrogen will prevent the loss of methane content.
3.3. Results for the determination of burning characteristics
During the period of experimentation, of the burning charac-teristics, the gas produced ignited with the aid of match and Bunsen burner each day. The results obtained were as shown inTable 1. 0 10 20 30 40 50 60 70 80 1 2 3 4 5 6 7 8 9 10 11 12 13 14 15 16 17 18 19 20 21 22
V
o
lume per da
y (cm³)
Graph of gas producon by various rao of poultry dropping to domesc waste and weeds
25%P:) 75% W (CM3) 50%P: 50%W (CM3) 75%P: 25%W (CM3) 25%P: 75%OP (CM3) 25%P: 75% GH (CM3)
Figure 2 Volume of gas produced per day from mixtures of various ratios of poultry dropping to orange peeling, groundnut husk, and weeds as obtained from SETUP 2.
Table 1 Burning characteristic of biogas produced, as deter-mined from experimental SETUP 3.
Day of test after gas production
Test by ignition with the aid of match and Bunsen burner
1–5 No burning
6–8 Little burning
The first gas produced did not burn. It also shows that when combustion began, it did not occur smoothly. This was because during the early period of biogas production, the con-tent was mostly carbon (IV) oxide since the methane forming bacteria were not fully active yet. Hence, there was more of the acid phase taking place in the digester. As the fermentation period progresses, the methane forming bacteria starts estab-lishing themselves and more of the methane forming phase begin to occur. This led to increase in the percentage by vol-ume of methane in the gas being produced. As this occurs, the gas tendency to burn when ignited increases. Soon, the methane forming phase occurs at a maximum capacity with the methanogens acting on the substrate produced by the acid forming bacteria for maximum biogas production. This causes the production of methane to occur at its optimum capacity. At this stage, burning of the biogas occurs easily. The flame was observed to be blue and smokeless, which is a characteris-tic of methane gas. There was also no appreciable deposition of soot on the burner.
3.4. Results of volume of gas in a restarted digester
The result obtained from experimental SETUP 4 which enables the determination of volume of gas in a restarted diges-ter to start production when it is activated with slurry from already functioning digester is shown inFig. 3.
From the graph inFig. 3, one can easily observe that gas production began on the second day as against the seventh day it began in experiment 1 which has no restarted digester. Similarly, the gas production peaked earlier. TheFig. 3also shows the values of the coefficient of determination R2 and the trendline equations for biogas production per day in a restarted digester. TheR2value was close to 1 which indicates a good measure that future outcomes are likely to be predicted well by the trendlines. It should also be noted that since the gas production began quite early, the trendline was captured con-sidering the entire period. Hence, when a digester is set up using slurry from a previous digestion, the production of gas begins earlier. This is because the microbes required for the
process to occur are already active but were only deactivated by the introduction of oxygen. The time lag only occurred because the oxygen present within the digester was being used by the aerobic bacteria. As soon as oxygen is used up, biogas production picks up fully. Since the set up is rich in bacteria loading, it also takes lesser time for the oxygen to be used up. Thus, the already established bacteria are simply given substrate to act on. They work with shorter time because of their population and reduce the operating time of digester. The increase in the volume of gas can be explained by the ease with which the population will increase since they were already established. There are thus more bacteria to act on the sub-strate to release more of the gas in the process.
4. Conclusion
Biogas is produced by the anaerobic fermentation of poultry dropping, orange peeling, groundnut shell, and weeds (carpet grass and goose grass). Over a period of 22 days, 177 cm3of biogas was produced from a mixture of 30 g poultry dropping, 30 g of orange peeling and groundnut shell, and 30 g of carpet grass and goose grass. A mixture of 50% poultry dropping and 50% weeds produce the largest volume of gas. The gas pro-duced did not burn on the first day, this is because during the early period of biogas production the content was mostly carbon (IV) oxide since the methane forming bacteria were not fully active yet, but 9 days after the first day of production, the gas produced burnt with a blue smokeless flame. A restarted digester took only two days to begin gas production and produced a higher volume of the total, hence it is sug-gested that disug-gested slurry of previous batch of fermentation should not be emptied completely, but a certain quantity should be mixed with the new feedstock to improve biogas production. Besides, to guarantee continuous production of biogas, two or more digesters should be operated at a set up interval of 2 weeks such that when a particular digester is ducing biogas at its peak, another will just be beginning pro-duction. When production starts declining, there is another digester getting to its peak period of gas production.
y = 0.038x3- 2.178x2+ 37.47x - 49.62 R² = 0.985 0 20 40 60 80 100 120 140 160 180 0 1 2 3 4 5 6 7 8 9 10 11 12 13 14 15 16 17 18 19 20 21 22 Volume of Gas Produced per day (cm3)
Daily Gas Producon (Days)
References
Amon, T., Amon, B., Kryvoruchko, V., Machmu¨ller, A., Hopfner-Sixt, K., Bodiroza, V., Hrbek, R., Friedel, J., Po¨tsch, E., Wagen-tristl, H., Schreiner, M., Zollitsch, W., 2007. Methane production through anaerobic digestion of various energy crops grown in
sustainable crop rotations. Bioresour. Technol. 98, 3204–3212.
Chonker, P.K., 1983. Microbial ecology during anaerobic fermenta-tion of cellulose waste materials. In: Vyas, S.K., Grewal, N.S. (Eds.), Biogas Technology, fifth ed. USG Publisher, Luthiana,
India, pp. 21–26.
Dandikas, V., Heuwinkel, H., Lichti, F., Drewes, J.E., Koch, K., 2014. Correlation between biogas yield and chemical composition of
energy crops. Bioresour. Technol. 174, 316–320.
Dinsdale, R.M., Premier, G.C., Hawkes, F.R., Hawkes, D.L., 2000. Two-stage anaerobic digestion of waste activated sludge and fruit/ vegetable waste using inclined tubular digesters. Bioresour.
Tech-nol. 72, 159–168.
Feijoo, G., Soto, M., Me´ndez, R., Lema, J.M., 1995. Sodium inhibition in the anaerobic digestion process: antagonism and
adaptation phenomena. Enzyme Microb. Technol. 17, 180–188.
Gisse´n, C., Prade, T., Kreuger, E., Nges, I.A., Rosenqvist, H., Svensson, S.-E., Lantz, M., Mattsson, J.E., Bo¨rjesson, P., Bjo¨rnsson, L., 2014. Comparing energy crops for biogas produc-tion – yields, energy input and costs in cultivaproduc-tion using digestate
and mineral fertilization. Biomass Bioenergy 4, 199–2010.
Gunaseelan, V.N., 2009. Predicting ultimate methane yields of Jatropha curcusandMorus indicafrom their chemical composition.
Bioresour. Technol. 100, 3426–3429.
Hendriks, A.T.W., Zeeman, G., 2009. Pretreatments to enhance the digestibility of lingo cellulosic biomass. Bioresour. Technol. 100,
10–18.
Herrmann, C., Idler, C., Heiermann, M., 2016. Biogas crops grown in energy crop rotations: linking chemical composition and methane
production characteristics. Bioresour. Technol. 206, 23–35.
Himanen, M., Ha¨nninen, K., 2011. Composting of bio-waste, aerobic and anaerobic sludges – effect of feedstock on the process and
quality of compost. Bioresour. Technol. 102, 2842–2852.
Kompogas, 2011. Green energy from organic waste. <http://www.
axpo-kompogas.ch/index.php?path=home&lang=en>.
Nakisa, Y., 2013. The role of gas hourly space velocity and feed composition for catalytic oxidative coupling of methane:
experi-mental study. J. King Saud Univ. Eng. Sci. 25 (1), 1–10.
Rath, J., Heuwinkel, H., Herrmann, A., 2013. Specific biogas yield of maize can be predicted by the interaction of four biochemical
constituents. Bioenergy Resour. 6, 939–952.
Triolo, J.M., Sommer, S.G., Møller, H.B., Weisbjerg, M.R., Jiang, X. Y., 2011. A new algorithm to characterize biodegradability of biomass during anaerobic digestion: influence of lignin concentra-tion on methane producconcentra-tion potential. Bioresour. Technol. 102,
9395–9402.
Vaclar, S., William, E.K., 1980. Energy in the Developing World – The
Real Energy Crisis. Oxford University Press, New York, 208.
Yan˜ez, R., Alonso, J.L., Dı´az, M.J., 2009. Influence of bulking agent on sewage sludge composting process. Bioresour. Technol. 100,
5827–5833.
Ye, C., Cheng, J.J., Creamer, K.S., 2008. Inhibition of anaerobic