Conference Proceedings
Volume 16
Bonn, Germany
Article 21
2016
FOSS4G 2016 Proceedings: Academic Program
-selected papers and posters
Franz-Josef Behr
Stuttgart University of Applied Sciences
Follow this and additional works at:
https://scholarworks.umass.edu/foss4g
Part of the
Geographic Information Sciences Commons
,
Nature and Society Relations
Commons
,
Remote Sensing Commons
, and the
Spatial Science Commons
This Full Proceedings is brought to you for free and open access by ScholarWorks@UMass Amherst. It has been accepted for inclusion in Free and Open Source Software for Geospatial (FOSS4G) Conference Proceedings by an authorized editor of ScholarWorks@UMass Amherst. For more information, please [email protected].
Recommended Citation
Behr, Franz-Josef (2016) "FOSS4G 2016 Proceedings: Academic Program - selected papers and posters,"Free and Open Source Software for Geospatial (FOSS4G) Conference Proceedings: Vol. 16 , Article 21.
DOI: https://doi.org/10.7275/R5KP80B7
1
08
Fall
FOSS4G 2016
Franz-Josef Behr (ed.)
International Conference for Free and Open Source Software
for Geospatial (FOSS4G 2016), 24th to 26th August 2016,
Bonn, Germany
FOSS4G 2016: Building Bridges
International Conference for Free and Open Source Software
for Geospatial (FOSS4G 2016), 24th to 26th August 2016,
Bonn, Germany
Academic Program: Selected Papers and Posters
Franz-Josef Behr (Editor)
OSGeo Journal Volume 16, Issue 1
Conference Web Site: http://foss4g.org/
Online version is published at http://scholarworks.umass.edu/foss4g/
Authors retain copyright over their work, while allowing the conference to place their unpublished work under a Creative Commons Attribution License, which allows others to freely access, use, and share the work, with an acknowledgment of the work's authorship and its initial presentation at this conference.
Authors have the sole responsibility concerning all material included in their respective contributions.
The use of general descriptive names, registered names, trademarks, etc. in this publication does not imply, even in the absence of a specific statement, that such names are exempt from the relevant protective laws and regulations and therefore free for general use.
Editor: Prof. Dr. Franz-Josef Behr, Stuttgart University of Applied Sciences, Germany
Cover photo: By Oliver Rudzick, https://www.flickr.com/photos/146261124@N02/28834318314/in/pool-foss4g/, CC BY-SA 2.0 [2018-01-31]
Table of Contents
Volume Introduction Letter
Selected Papers 1
From global observations to local information: The Earth Observation Monitor 3
Jonas Eberle
Analysing the practical feasibility of FOSSGIS in military operations – A Cholera outbreak use case 19
Susanna Jacoba Henrico, Serena Coetzee, Antony Kyle Cooper
OSGeo conference videos as a resource for scientific research: The TIB|AV Portal 34
Peter Löwe, Margret Plank, Kraft Angelina, Britta Dreyer
Identification of SAR Detected Targets on Sea in Near Real Time Applications for Maritime Surveillance 42
Sergey Voinov, Egbert Schwarz, Detmar Krause, Matthias Berg
Is there life in Virtual Globes? 51
Theofilos Papadopoulos, Konstantinos Evangelidis
Mapping WiFi measurements on OpenStreetMap data for Wireless Street Coverage Analysis 58
Andrea Valenzano, Dario Mana, Claudio Borean, Antonio Servett
Semantic Markup for Geographic Web Maps in HTML 73
Malte Reißig
Involving communities in environmental protection by Community Information Systems: the case study of “La
Cuicadora” 84
Domenico Vito
Building applications with FOSS4G bricks: Two examples of the use of GRASS GIS modules as a high-level
“language” for the analyses of continuous space data in economic geography 91
Moritz Lennert
Selected Posters 103
An Open Source Solution for Rapid and Automatic UAV Mapping 105
Martin Landa, Petr Kavka, Ludek Strouha, Ivan Mincik, Marcel Dancak, Jachym Cepicky
GIS.lab: Hydrological Modeling on the Web 107
Martin Landa, Petr Kavka, Ludek Strouha, Ivan Mincik, Marcel Dancak, Jachym Cepicky
Modelling Population Interactions: the PySAL and Open Source Way 109
Lorraine Barry
Modelling concrete and abstract geoprocessing workflows with ILWIS 4 111
Rob Lemmens
How to cross a square? 113
Jakob Miksch, Stefan Hahmann
Cocobot: An Efficient Road Change Detection System using GPS Trajectory Data Set 115
Sungmun Chung, Geunho Kim
GeoTools Extension for 3D Geometry 117
Taehoon Kim, Joonseok Kim, Hyung-gyu Ryoo, Donguk Seo, Ki-joune Li
Volume Introduction Letter
This Conference Proceedings is a collection of selected papers and posters submitted to the Academic Program of the International Conference for Free and Open Source Software for Geospatial (FOSS4G 2016), 24th to 26th August 2016 in Bonn, Germany. Again geospatial open source software was the focus of a well-attended international conference flanked by presentations on open standards and the open data movement, a meeting place for open communities.
Similar to previous FOSS4G conferences at the national and international level, the academic papers and posters cover an extensive wide range of topics reflecting the contribution of the academia to this field by the development of open source software components, in the design of open standards, in the proliferation of web-based solutions, in the dissemination of the open principles important in science and education, and in the collection and the hosting of freely available geo-data.
This volume follows a 10-year tradition of FOSS4G Academic Proceedings that with many published on the former “OSGeo Journal” website. However, with the help of the University of Massachusetts Amherst Scholarly Communication team, we are publishing this volume and individual papers using the new bepress-supported publishing system. A benefit of this system is that it feeds many library databases making the proceedings and individual papers much more identifiable through library search mechanisms.
On the page https://scholarworks.umass.edu/foss4g/vol16/iss1/ the reader will get an overview about the selected papers and posters published in the Conference Proceedings.
A few additional papers found their publication on other platforms. The paper “PaleoMaps: SDI for open paleoenvironmental GIS data”1 by Christian Willmes, Daniel Becker, Jan Verheul, Yasa Yener, Mirijam Zickel, Andreas Bolten, Olaf Bubenzer, Georg Bareth and the paper “Development of a New Framework for Distributed Processing of Geospatial Big Data”2 by Angéla Olasz, Binh Nguyen Thai, Dániel Kristóf have been published through the International Journal of Spatial Data Infrastructures Research of the European Commission’s Joint Research Centre, organized by Sven Schade. Anita Graser’s paper “Towards landmark-based instructions for pedestrian navigation systems using OpenStreetMap”3 has been published in the AGILE 2017 proceedings.
The presentations of the conference are also available in the AV-Portal of TIB, the German National Library of Science and Technology4. All videos are assigned a digital object identifier (DOI) and a media fragment identifier to cite presentations as a whole or single segments separately.
The support of Christian Willmes and Sergey Voinov amongst other reviewers is gratefully acknowledged. Moritz Lennert pushed the process forward. The support of Charles Schweik, Mohammed Zia and Erin Jerome was very helpful and encouraging!
As the editor of the FOSS4G 2016 proceedings I’d like to encourage the Academia to intensify the usage of open software, tools, data, science and education and to contribute actively to forthcoming conferences on local, national and international level searching the contact and exchange with practitioners, developers and users to extend and foster the worldwide community – “Building bridges”, as the motto of AGSE 2016 was.
Sincerely,
Franz-Josef Behr – FOSS4G 2016 Academic Committee chair and Proceedings editor
1 http://ijsdir.jrc.ec.europa.eu/index.php/ijsdir/article/view/431 2 http://ijsdir.jrc.ec.europa.eu/index.php/ijsdir/article/view/423 3 https://agile-online.org/images/conference_2017/Proceedings2017/shortpapers/46_ShortPaper_in_PDF.pdf v Via https://av.tib.eu/series/253/foss4g+bonn+2016
From global observations to local information: The Earth Observation
Monitor
Jonas Eberle a,*
a Department for Earth Observation, Friedrich-Schiller-University Jena – [email protected]
KEY WORDS: Web-based geo-processing; Earth Observation; time-series; vegetation analysis; web portal; mobile application; service-based infrastructure
ABSTRACT:
Earth Observation (EO) data are available around the globe and can be used for a range of applications. To support scientists and local stakeholders in the usage of information from space, barriers, especially in data processing, need to be reduced. To meet this need, the software framework "Earth Observation Monitor" provides access and analysis tools for global EO vegetation time-series data based on standard-compliant geo-processing services. Data are automatically downloaded from several data providers, processed, and time-series analysis tools for vegetation analyses extract further information. A web portal and a mobile application have been developed to show the usage of interoperable geospatial web services and to simplify the access and analysis of global EO time-series data. All steps from data download to analysis are automated and provided as operational geo-processing services. Open-source software has been used to develop the services and client applications.
1
Introduction
Information about environmental change is an important component in monitoring study areas on earth. Parameters of vegetation deliver valuable information about land cover and land use. Earth Observation satellites (e.g., Landsat, Terra, and Aqua) provide global datasets that are used for vegetation analysis. Time-series information of vegetation parameters delivers further information about changes, which can be used for new analyses. If the spatial resolution of these global datasets is suitable for local study areas, these datasets can also be used for local applications, giving local stakeholders the possibility of using global Earth Observation data for their specific needs. The transformation of global observations into local information facilitates the use of Earth Observation data for local studies, as well as the subsequent processing into local knowledge by involving stakeholders.
The involvement and consideration of stakeholders is an essential task in current international programs. A program launched in 2012, Future Earth (Future Earth 2013), was founded by international research funding organizations with the aim of supporting interdisciplinary collaborations in the area of global environmental change research, to address critical questions. In addition to questions regarding how the earth is changing, an important ‘cross-cutting capability’ is the focus on data and on observing systems, with the aims to “make the research more useful and accessible for decision makers” (Future Earth 2013:12) and “[make] research accessible to all parties“ (Future Earth 2013:21).
Technical feasibilities are also mentioned in the Future Earth program seeking to determine best practices in integrating user needs and understanding research needs, by, for example “developing and diffusing useful tools for applying knowledge” (Future Earth 2013:21). On a more technical level, the Belmont Forum, a high level
downloaded from the metadata entries; it is often not possible to retrieve the data directly. Craglia et al. (2008) published an agenda for the “Next-Generation Digital Earth” stating that multiple connected digital infrastructures and a problem-oriented focus to enable access to data, information, and services are needed, and visualization, open access, and multidisciplinary education and science is supported.
New insights into global environmental change, in focus with the next-generation digital earth, can be realized by making Earth Observation data and methods available with easy-to-use interfaces. An automated processing and analysis of Earth Observation time-series data is needed to fulfill this purpose. At present, many individual steps, such as discovery, download, pre-processing, analysis, post-processing, are needed to derive local information based on Earth Observation data. Only after completing these steps the user can derive the final information based on the outputs of the analysis tool, highlighting the need for ready-to-use derived information based on defined parameters. This can be achieved by operational and automated data processing to ensure easy access to this type of information.
The software framework “Earth Observation Monitor” (EOM) was initiated to provide easy access to Earth Observation time-series data and information from analysis tools, without the need to process data on the user’s computer. The main users are local stakeholders, as well as scientists who need an overview of their area of study. The EOM makes applied analysis methods and tools developed by different research communities online available, in combination with data access tools and web services, all encapsulated within a straightforward web interface. The spatial data infrastructure developed deals with data search, download, and conversion, as well as analysis based on user inputs.
The objective of the present paper is to describe the functional and technical concept of the Earth Observation Monitor, as well as the applications developed. The EOM can be used to explore Earth Observation time-series data based on the following three principles:
Simple time-series data access and analysis without data processing, Making software tools available via web services, and
Providing simple tools with easy-to-use applications for stakeholders and scientists.
The remaining paper is structured as follows: Background and related work is shown in Section 2 with a focus on geospatial web services, vegetation time-series analysis, and available online tools. The design and implementation of the EOM are explained in Section 3 including data access and processing services as well as web and mobile applications. Finally, a summary and conclusions are given in Section 4 and future work in Section 5.
2
Background and related work
2.1
Geospatial service infrastructure
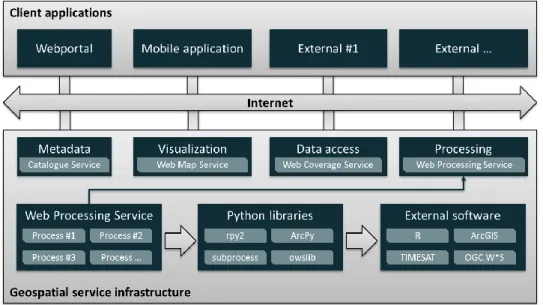
Modern web technologies facilitate the use of web services and are the basis for interactive and easy-to-use web-based geographic information systems. Using web services also allows the usage from multiple systems (e.g., a web portal, a mobile application, and other software clients). An important consideration in developing web-based geographic information systems is hiding the complexity of data processing techniques from users and providing simple web interfaces. Making desktop software available online relies on web services, which make it possible to execute tasks independently on remote servers. Client applications and service infrastructures can be separated (Figure 1) but interoperability needs to be integrated and provided; external clients can make use of the service infrastructure if access is permitted. Services are provided over the network, and thereby made available for client applications. Two main different architectural styles are available to publish services, service-oriented architecture (SOA; MacKenzie et al. 2006) and resource-oriented architecture (ROA; Overdick 2007). Both of them can also be used for geospatial services. Mazzetti, Nativi, and Caron (2009) have stated that “it is not possible to say that one architecture is better than the other” and that “the selection […] depends on application requirements.” These authors selected the REST approach for their Earth System Science applications.
In a spatial data infrastructure, services are available for the tasks of visualization, data access, metadata cataloguing, and data processing. To provide interoperable services and metadata, the Open Geospatial Consortium (OGC) published several standards and implementation specifications for the geospatial world. Those can be used to establish interoperability on server- and client-side. Automated and operational processing
is needed for user-friendly time-series analysis tools, allowing users to perform the tasks of data downloading, processing, and analysis. The OGC has specified standardized processing services with the Web Processing Service (WPS; Schut 2007). This specification describes service interfaces that can be used to publish processing algorithms and to request their execution on the Web. Within the process algorithm, external software can be made available, for example, by executing software on the command line or through libraries used in programming languages. This allows a wide range of software to be integrated into a web service environment. Several open source software programs exist that meet OGC WPS specifications (an overview is given by Zhao, Foerster, and Yue 2012 or Lopez-Pellicer et al. 2012).
Web Processing Services are widely used in conjunction with spatial data infrastructures when processing methods are available to the user. Several publications also list any usage in research projects, and research has been done in the field regarding distributed processing (Friis-Christensen et al. 2007; Meng, Xie, and Bian 2010; Schaeffer et al. 2012; Foerster et al. 2011), semantic processing (Farnaghi and Mansourian 2013; Wosniok et al. 2014; Vitolo et al. 2015), process orchestration (Nash et al. 2007; Eberle and Strobl 2012; de Jesus et al. 2011; Wu et al. 2014; Meng, Bian, and Xie 2009), processing in the cloud (Sun 2013; Evangelidis et al. 2014), moving code (Müller, Bernard, and Kadner 2013), and modeling (Buytaert et al. 2012; Imran, Zurita-milla, and By 2011; Dubois et al. 2013).
Figure 1: Client applications can connect through the internet to the geospatial service infrastructure that includes processing based on OGC Web Processing Services on Python programming language. Connections to
diverse GIS processing software are made either through Python modules (e.g., R, ArcMap, OWS services) or through command line access (e.g., TIMESAT).
2.2
Vegetation time-series analysis
Satellite image time-series of vegetation indices are radiometric measurements of photosynthetically active radiation in the leaves of the vegetation, a proxy for the photosynthetic activity and vitality of plants. Vegetation indices like the Normalized Difference Vegetation Index (NDVI, Tucker 1979) or the Enhanced Vegetation Index (EVI, Huete et al. 2002) have proven to be important data sources for vegetation change and dynamics analyses. Daily to bi-weekly global data with a spatial resolution of 250m using the NDVI and EVI data from the Moderate Resolution Imaging Spectroradiometer (MODIS) allows vegetation analyses from 2000 onwards (Huete et al. 2002).
Observation community, Greening describes positive trends in vegetation greenness, whereas Browning indicates negative trends in vegetation greenness. Both methods are provided as tools in the R statistical language. In addition to trend analyses of satellite time-series, the derivation of phenological metrics for vegetation characterization and classification is another important issue. Introduced by Jönsson and Eklundh (2004), the software TIMESAT has been developed for satellite-based phenological analyses based on the seasonality of satellite time-series data and their relationship with the phenological cycling of vegetation. Further on, it enables the extraction of time-related phenological metrics (e.g., start of season, length of season) or biomass-related metrics, such as the integral of the vegetation period.
2.3
Online time-series access and analysis tools
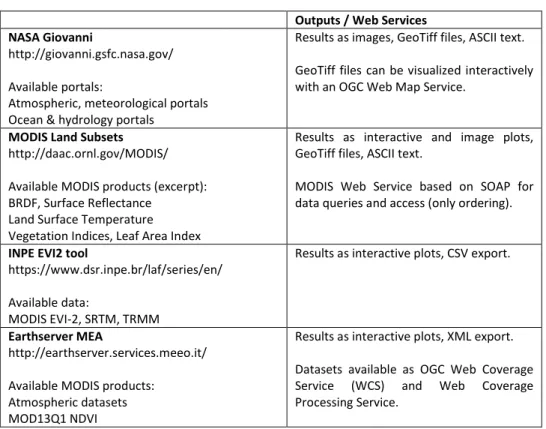
A number of tools for Earth Observation time-series data access and analyses are available online, but they have all specific limitations, described in this chapter. More and more tools allowing time-series extraction and analysis of specific datasets from NASA MODIS sensor are becoming available. Some of these tools are listed in Table 1, and are discussed in the following paragraphs.
The probably best known web-based tool is NASA Giovanni – Interactive Visualization & Analysis (Acker and Leptoukh 2007), which offers a wide range of available MODIS datasets and different time-series extraction and analysis tools. Although NASA Giovanni does provide access to all input data for a given bounding box and time range, these tools are not publicly available as web services to be integrated into external applications. The MODIS Land Subsets tool from the United states’ Oak Ridge National Laboratory (ORNL) provides time-series extraction for a bounding box around a selected pixel location. In addition to time-series data access, the tool also visualizes land cover types and provides a phenology time-series plot for vegetation data. A SOA-based MODIS Web Service is publicly available for querying the data catalogue and submitting an order for time-series access and analysis graphs. The Laboratory of Remote Sensing in Agriculture and Forestry of the Brazilian National Institute for Space Research (INPE) developed a tool for MODIS EVI-2 and TRMM precipitation data plotting for South America; an easy-to-use web portal provides time-series data with just one click on the map. The Multi-Sensor Evolution Analysis (MEA) of the EU EarthServer project focuses on the provision of time-series data access, based on OGC-compliant web services. Through the web portal, tools are available for interactive time-series plotting for different pixels and datasets, which can be compared using a chart. Spatial subset plots can also be shown as images or as map-based visualizations. Via the OGC Web Coverage Processing Service (WCPS), the datasets are available in a web service query-processing language.
Table 1: Comparison of web-based time-series data access and analysis tools.
Outputs / Web Services NASA Giovanni
http://giovanni.gsfc.nasa.gov/ Available portals:
Atmospheric, meteorological portals Ocean & hydrology portals
Results as images, GeoTiff files, ASCII text. GeoTiff files can be visualized interactively with an OGC Web Map Service.
MODIS Land Subsets http://daac.ornl.gov/MODIS/ Available MODIS products (excerpt): BRDF, Surface Reflectance
Land Surface Temperature Vegetation Indices, Leaf Area Index
Results as interactive and image plots, GeoTiff files, ASCII text.
MODIS Web Service based on SOAP for data queries and access (only ordering).
INPE EVI2 tool
https://www.dsr.inpe.br/laf/series/en/ Available data:
MODIS EVI-2, SRTM, TRMM
Results as interactive plots, CSV export.
Earthserver MEA
http://earthserver.services.meeo.it/ Available MODIS products: Atmospheric datasets MOD13Q1 NDVI
Results as interactive plots, XML export. Datasets available as OGC Web Coverage
Service (WCS) and Web Coverage
For users focusing on vegetation time-series data, many of the tools described in the preceding paragraphs offer web-based tools for time-series extraction and visualization. However, none of the existing tools can yet be integrated into external applications. The OGC WCPS service from MEA is a good approach to overcome this issue; however, the complete MODIS vegetation datasets with Enhanced Vegetation Index, the Normalized Difference Vegetation Index, and the quality flag datasets are not yet fully available and are not yet updated automatically. Although the MODIS Web Service from ORNL provides users with a way to submit order requests, the resulting data are only available on a website whose link is sent via electronic mail. To sum, service-based access to time-series vegetation data is only available within specific limits. Using OGC Web Processing Services is therefore a good technical solution, allowing users to execute the services directly within other external applications.
From the point of view of an end-user, further information based on the analysis of time-series data is also useful. Some of the scientific algorithms that are currently available can provide information about breakpoints in trends and seasonality that can be used, for example, as indicators for changes in vegetation. A great deal of information can also be retrieved from phenological derivations, like the start and end of a season, seasonal amplitude, and seasonal integral. However, to date, none of this information is available as on-demand processing services in web-based environments.
3
The Earth Observation Monitor
The Earth Observation Monitor (EOM) is a software framework with the aim of ensuring easy access and analysis of spatial time-series data for land monitoring on local scales. Scientists and stakeholders working in local areas need to be able to do time-series analysis without the need to process any data. In this chapter, the concept; technical developments based on automated data access, processing, and analysis; and example client applications are described.
3.1
Concept
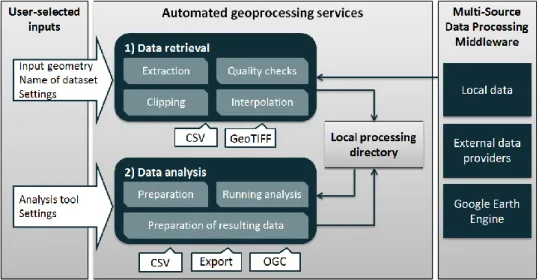
The concept behind the EOM combines the advantages of web service-based geoprocessing with user-friendly interfaces; this provides an easy access for users without specific knowledge in data processing. The EOM focuses on hiding existing barriers (e.g., data download, data processing, format conversion), to allow users to focus on the analysis results. As many steps that are needed to produce analysis results from Earth Observation data can be automatized, users can concentrate on the interpretation of the analysis results. Figure 2 illustrates the tasks: The EOM integrates the data for the specified area including quality checks and data clipping. If the analysis method and its parameters are set, the system prepares data needed for the analysis, executes the method, and prepares the results for online visualization and easy-to-use offline usage.
common data format. These data are provided to client applications through OGC-compliant web services, the integration is also available as OGC Web Processing Service.
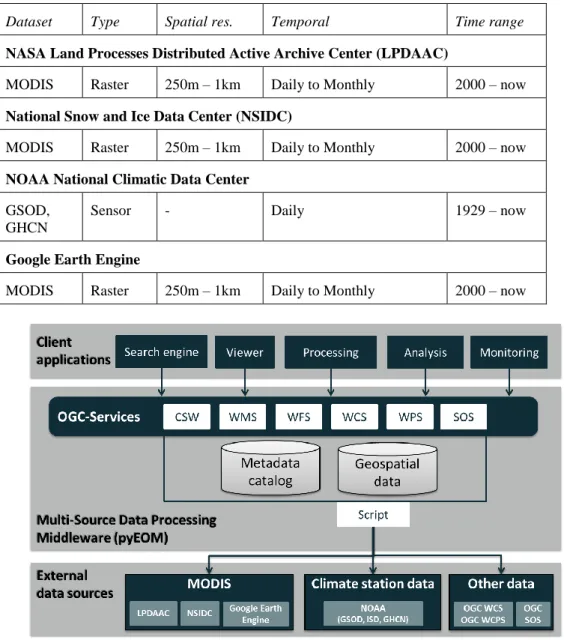
The middleware was developed as a Python library named pyEOM . The aims of the library are (1) to provide access to time-series data as easily as possible and (2) to provide a standard-compliant web service for data access, visualization, processing, and analysis. This library can either be used within a Python script or by the web processing services published by the EOM framework. pyEOM provides access to several external datasets like MODIS and climate station data. Table 2 lists available data sources. Datasets from OGC Web Coverage Services (WCS) and OGC Sensor Observation Services (SOS) can also be integrated into the middleware. Any dataset integrated into the middleware can be visualized with OGC-compliant web services. Point-based time-series data can be published as an OGC SOS; Polygon-based time-time-series raster data is available as an OGC Web Map Service (WMS) for visualization and as OGC WCS for data download.
Table 2: Datasets connected in the multi-source data processing middleware (adjusted after Eberle et al. 2013).
Dataset Type Spatial res. Temporal Time range
NASA Land Processes Distributed Active Archive Center (LPDAAC)
MODIS Raster 250m – 1km Daily to Monthly 2000 – now
National Snow and Ice Data Center (NSIDC)
MODIS Raster 250m – 1km Daily to Monthly 2000 – now
NOAA National Climatic Data Center GSOD,
GHCN
Sensor - Daily 1929 – now
Google Earth Engine
MODIS Raster 250m – 1km Daily to Monthly 2000 – now
Figure 3: The Multi-Source Data Processing Middleware (updated after Eberle et al. 2013) is connected to external data sources and provides data integrated into the middleware as OGC-compliant web services.
Geospatial data is stored in a common data format, meta
3.3
Automated data processing and analysis
Data processing and analysis need to be available via a web-based system. To make processing and analysis tools automatically available, they must be executable either within a programming language or from the
command line. PyWPS5 was used as Python-based open-source software compliant with the OGC Web Processing Service specifications. Ready-to-use Python-libraries, such as rpy2 for R statistical language or
ArcPy for ArcMap tools, as well as command line executions (with the Python library subprocess), can be used to run external software for data analysis or data processing (see Figure 1).
The automated workflow can be divided into five steps:
1. Time-series data extraction for a point or polygon selected by the user. 2. Data post-processing for quality checks and interpolation.
3. Data preparation for the individual analysis tool. 4. Execution of the analysis tool.
5. Preparation of analysis results for online visualization and download.
For any processed dataset of a created feature-a point or a polygon-,an individual processing directory is created that can be accessed by the user. Within this processing directory, any downloaded and processed data is available for download. Any input data, as well as results for a selected analysis tool, are also stored in this directory (see Figure 4). For example, the user can download the input data to execute the analysis tool offline on the local computer to reproduce the results. The individual steps of the automated geoprocessing services (Figure 4) are described in the sections 3.3.1 and 3.3.2. Appendix B lists all WPS processes that have been developed for data retrieval and data analysis.
Figure 4: Automated data processing and analysis workflow.
3.3.1 Data retrieval
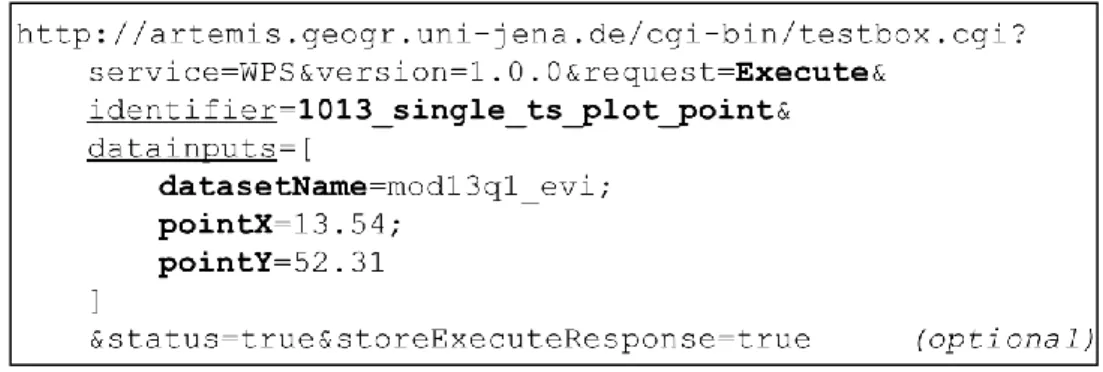
The retrieval of data is the basis for all further analyses. Dependent on the selected dataset, feature geometry, and source of the dataset, different processing steps have to be conducted. The processing includes the extraction of time-series data from the original dataset, clipping to the feature geometry, quality checks based on user inputs, and linear interpolation to replace no-data values from the time-series. To ensure transparency, quality flags and information regarding any interpolated values are stored. The data retrieval has been made available as OGC WPS process to be able to retrieve data within external client applications.
Figure 5: Request to integrate a MOD13Q1 EVI dataset for a given coordinate. Extraction & Clipping
In the first step of data retrieval, the required information needs to be extracted out of the raw time-series dataset and clipped to the user’s geometry. Dependent on the geometry type (point or polygon), the output of the common data format differs: For points, a CSV file with the time-series information is provided; for polygons, GeoTiff files are stored individually for each timestamp.
Quality checks
Products from MODIS sensor are always delivered with quality flags so that users can decide which data are good enough for their specific application. To give users the opportunity to determine data quality, quality flags have to be processed. Depending on the threshold being used, some data can be declared as having no-data value. The quality flags are also extracted and clipped to the users’ geometry. A quality mask is then created for each timestamp, based on the users’ quality parameter inputs. These masks are then applied to the corresponding raster data.
Interpolation
For some time-series analysis methods missing data need to be interpolated, if no-data values are present. A linear interpolation is used to overcome this issue in the pre-processing step. Interpolated values are marked in a separate column in the final output CSV file, as well as in the output plot.
3.3.2 Data analysis
The basis for the time-series data analysis is either a CSV file, for point-based analyses, or a multi-band raster image stack, for polygon-based analyses. The following steps concerning data preparation, analysis execution, and preparation of resulting data are mostly individual for each analysis tool; these steps are also different for point-based and polygon-based analyses. As with data retrieval, any processed data is stored in the processing directory that is available to the users, giving them the possibility to download the prepared data for a specific analysis tool and to reproduce the analysis offline on their computers. The OGC WPS processes developed for time-series analysis are listed in Appendix B. Two processes always exist for each analysis method, one for point-based and one for polygon-based analyses.
Figure 6 shows an example request for the WPS process to execute BFAST for a prior integrated dataset. The dataset is specified by the unique identifier (uuid) as output from the data retrieval process. Further optional parameters can be set to adjust the BFAST algorithm. The resulting output consists of several plots and files (see Table 3).
Figure 6: HTTP request to execute bfast for a prior integrated dataset (defined by the uuid parameter). Data preparation
The preparation of datasets for specific analysis tools can be automated based on the requirements of the selected tool. For the R-packages ‘BFAST’ and ‘greenbrown’ it is necessary to build a time-series object with a starting date and a frequency parameter to describe the time-series. For polygon-based analyses, both packages need a raster brick object that can be created based on the multi-band raster file. Data pre-processing for TIMESAT consists of the creation of a configuration file and the preparation of the input data. For point-based analyses, the input data is a new ASCII text file with data values in a single row. For polygon-based analyses, the data must first be scaled to the original values and converted into the ENVI HDR raster data format, which does not include header information. This is done with the Geospatial Data Abstraction Library (GDAL; (Warmerdam 2008). Afterwards, a list of files is saved in an ASCII file that is referenced in the TIMESAT configuration file.
Analysis execution
The execution of analysis methods can be done either from the command line or using a Python library. The Python library rpy26 was used as a direct connection to R within Python. With this library it is possible to execute R functions and to exchange variables between both languages. The execution of TIMESAT is done from the command line, which is executed from the subprocess module of Python. In such an automated environment, no command line prompts can occur; rather, the complete execution has to run in a single step. The resulting data need to be stored in files that can be accessed by the Python process after successful execution.
Preparation of analysis results data
The resulting data can then be prepared to ensure easy user access. A graphical figure can be made from the results of any analysis method; several output files are also generated, depending on the feature geometry and the analysis method. Table 3 lists the prepared output files and services. To visualize spatial analyses of feature polygons, OGC Web Map Services (WMS) and OGC Web Feature Services (WFS) are automatically generated from the raster and vector outputs: GeoTiff files are provided as WMS, and shape files as WFS. The shape files show each pixel of the polygon in the map, and come with an attribute table, which gives the statistics of each pixel by analysis method. This attribute table can also be obtained using the OGC WFS GetFeatureInfo request.
Table 3: Generated output files, by feature geometry and analysis method.
BFAST greenbrown TIMESAT
Point Data (CSV) Statistics (CSV) Plot (PNG) Data (CSV) Statistics (CSV) Plot (PNG) Data (CSV) Phenology (CSV) Plot (PNG)
Polygon Data (GeoTiff)
OGC WMS Pixel-Shapefile
Classification, slope, p-Value (GeoTiff, WMS) Shapefile / WFS for slope, p-Value
Data (GeoTiff ) OGC WMS
Shapefile / OGC WFS for Phenology
3.4
Client applications
The functions of the EOM are available with web services, allowing client applications to make use of these services. Two example clients were developed to show the possibilities of such a service-based infrastructure: A web portal (webEOM) and a mobile application (mobileEOM). Both of these clients use the OGC WPS for data integration and analysis. OGC Web Map and Feature Services for resulting data provide the possibility for direct online visualization.
3.4.1 webEOM
The focus of the web portal is to provide an easy-to-use client, while making it possible to extract time-series data and execute further time-series analysis functions. The webEOM7 map (Figure 7) can be used to create the
from the extracted time-series data that are plotted in the web portal. In addition to the images, CSV files are created and available for download. After data integration, users can select an analysis tool for execution, and individual parameters can be set for the selected analysis. The resulting data can either be visualized directly in the web portal or can be downloaded for further usage. Spatial outputs can be interactively explored in the map, and CSV files will be plotted as an interactive chart.
Several open-source libraries were used to develop the web portal (Appendix A): Drupal CMS is used for user registration and authentication, as well as as a registration service for created features. On the frontend interface, the JavaScript library OpenLayers is used as a mapping library; dygraphs are used to generate interactive charts; and jQuery provides standard JavaScript functions.
Figure 7: Screenshot of webEOM portal.
3.4.2 mobileEOM
During fieldwork, users cannot use web-based systems developed for desktop computers. A mobile application is therefore needed to foster the use of spatial time-series tools on mobile devices, which can be more easily used during work in the field. With such a mobile application users have access to a wide range of information, because a time-series of several years (15 years for MODIS vegetation data) can tell stories about the changing environment. The combined usage with time-series analysis tools allows identifying breaks in the past and overall trends of the vegetation, while users are in the field.
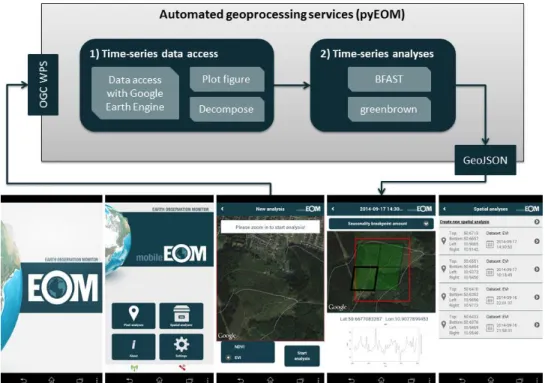
The mobile application for EOM was developed to provide access to time-series data and derived analyses on mobile devices. Using their current GPS location or a manual set position, users can extract vegetation time-series data, as well as view data plots, trend, and breakpoint analysis plots directly on their mobile devices. An OGC WPS process was developed for the mobile application. This provides all necessary functionalities in a single process, available as web service. This process extracts the data from Google Earth Engine8 and plots the time-series and decomposition figure. In a second step, time-series analyses for breakpoint detection (BFAST) and trend calculations (greenbrown) are executed and plotted in a figure. The resulting output is a GeoJSON file containing the values of the analysis tools, as well as links to the generated figures. Figure 8 shows screenshots of the mobile app linked with a chart of the OGC WPS process and how they interact.
8
Figure 8:Screenshots of the mobileEOM app and interactions between the app and EOM web services. The mobile application was developed as hybrid web application. Applications of this type are developed using HTML5, CSS, and JavaScript and then exported as native applications. To access the sensors and functions of the mobile device (e.g., GPS, file storage), the software PhoneGap was integrated and used for native application export. The interface was developed using jQuery Mobile, and the interactive map was integrated with Google Maps API.
4
Summary and conclusions
Based on an infrastructure using standard-compliant geospatial web services, the Earth Observation Monitor (EOM) software framework was introduced to provide global access and analysis tools for NASA MODIS vegetation time-series data, for user-defined points and polygons. A further aim was to make such time-series data and algorithms developed in research projects for data analysis more useful and accessible for users (i.e., scientists, stakeholders, and other decision-makers). Interoperable web-based geoprocessing services have been developed that can be used from external software and linked from data registries and metadata catalogues (e.g., GEOSS portal). Metadata entries can now be linked with such data-access services as provided within the framework of EOM. Two client applications have been developed to show how EOM can provide simple access to these services via a web portal and a mobile application, meaning that users do not need to process any data themselves.
Earth Observation time-series data are now operationally available for a wide range of applications. In many cases, users are interested in information about the change of the environment in their specific area of interest. Valuable information can be derived from time-series data for such user-defined areas, but better tools are needed to extract time-series data and to provide this information. With increasingly large data archives and high volumes of requests for data access, standard-compliant services for data access must be provided. In addition to traditional ways of providing data access services from the Open Geospatial Consortium (OGC), like Web Feature Service and Web Coverage Service, the present article proposes using Web Processing Services
information by extracting datasets for local areas and applying algorithms. For time-series data, these algorithms can be land-surface trend calculations, breakpoint detection, or phenological analyses of vegetation data. Providing access to such algorithms—for example, by implementing web services for algorithms that have been developed within research communities—will make this area of research more accessible. This was shown in the present article for vegetation time-series analysis, and led to the Earth Observation Monitor framework. An ideal way to make data access easier is providing web services, as they can be easily integrated into other applications and used within programming languages. The OGC WPS specification provides a standardized framework for geospatial processing, allowing other external applications to use these services with a common interface. Only at least the name of a dataset and the geometry (point, polygon) are necessary to access the data; the user does not need to know the details in handling specific Earth Observation datasets. As Earth Observation data are mostly provided in diverse data formats, these web services can provide consistent data formats, which are easier for users. In addition to providing easier data access, information based on time-series data must also be made more available. By providing scientific algorithms as web services, both algorithms and time-series data can be linked. This linking then allows users to execute both the integration process for data access and the algorithm process for information extraction. Without needing to do any data processing at all, users can retrieve locally relevant information, such as climate-driven vegetation phenology trends and back-dating of land-cover change events using breakpoints.
Web clients and mobile apps can be used in conjunction with geospatial web services, increasing the effectiveness and interoperability of web services by adding an intuitive frontend interface for different devices. Such an interface can, for example, provide notifications when data are available for analysis. A mobile app gives users direct access to time-series data while they are conducting fieldwork, without requiring a notebook or desktop computer to have access to the time-series data. Such applications can be built on top of the developed web services, and, as they are available over the Internet, can be used from any application that is compliant with the OGC WPS specifications.
5
Future work
Although the technical solutions have shown that geoprocessing services can be used to lower barriers in time-series data acess and analysis, there are still some topics that can be considered in the future: The processing services need to be described with metadata and made available in catalogue services and system of systems (e.g., GEOSS). Inputs and outputs of a process need to be semantically described to automatically detect what kind of inputs can be used with a process and to establish automatic connections between processes as workflows. Also the “moving code” (Müller et al. 2013) paradigm needs to be considered further to make it easier to process algorithms on external servers.
The further development of the EOM is concentrates on the usage of distributed processing capabilities to increase the performance and the integration of further high- and medium-resolution satellite sensors, such as the new Copernicus Sentinel satellites or Landsat. Furthermore the web and mobile applications can be optimized in various ways.
Acknowledgements
The development of the Earth Observation Monitor has been funded by Friedrich Schiller University, Jena, and by EU FP7 EuRuCAS project (No. 295068). The authors thank NASA and USGS for providing free and open access to their MODIS data archives, as well as the Google Research Team for providing support and access to Google Earth Engine. Additional thanks go to Franziska Zander (Friedrich Schiller University, Jena, Germany) for proofreading the paper.
Appendices
A. List of software used for EOM services, webEOM, and mobileEOM
Drupal CMS 7 Backend
jQuery 1.10.2 JavaScript Frontend Library
OpenLayers 2.12 JavaScript Mapping Library
dygraphs 1.0.1 JavaScript Chart Library
Google Maps API 3 JavaScript Mapping Library jQuery Mobile 1.3.2 JavaScript Mobile Library
PhoneGap / Cordova 3 Native Mobile Application Framework MapServer 6 OGC WMS & WFS output layers for
time-series analysis results
PyWPS 3.2.2 OGC Web Processing Service
R 3 Time-series analysis (BFAST, greenbrown)
Python 2.7 Libraries such as GDAL, OGR, Pandas
TIMESAT 3.1 Phenological time-series analysis
B. Web processing services for time-series data retrieval and time-series analysis
available for EOM: http://artemis.geogr.uni-jena.de/cgi-bin/testbox.cgi
Data access for points
Identifier: 1012_single_ts_plot_point
Inputs: pointX, pointY, datesetName, dateStart, dateEnd, qualityLimits
Outputs: pointBBOX, tsCSV, tsPlot, tsDecompose, tsDecomposeCSV,
uuid Data access for polygons
Identifier: 1012_single_ts_plot_polygon
Inputs: wkt, datesetName, dateStart, dateEnd, qualityLimits
Outputs: tsCSV, tsPlot, tsDecompose, tsDecomposeCSV, uuid
Data access for climate stations
Identifier: 1020_single_ts_plot_climate
Inputs: station, parameters, dateStart, dateEnd
Outputs: tsCSV, tsPlot, uuid
Time-series BFAST analysis
Identifier: 2010_single_ts_bfast_point | 2010_single_ts_bfast_polygon
Inputs: uuid, season, h, maxiter, breaks
Inputs: uuid, fitting, seasonStartMethod, seasonStart, seasonEnd, spikeMethod, spikeValue, adaptionStrenght, windowSize, noIterationsUpperEnvelope
Outputs: Point: timesatFitCSV, timesatSeasonalityCSV, timesatPlot
Polygon: layers, seasonalityParameters, seasons Data availability
Identifier: 0020_wps_available_datasets
Inputs: wkt (Point or Polygon representation as string)
Outputs: json (list of datasets)
Mobile point-based WPS
Identifier: 8010_single_ts_mobile
Inputs: pointX, pointY, qualityLimits, uuid, width
Outputs: pointBBOX, tsCSV, tsPlot, tsDecompose, tsBfast,
tsGreenbrown, uuid Mobile point-based WPS
Identifier: 8020_multiple_ts_mobile
Inputs: bbox_top, bbox_right, bbox_bottom, bbox_left, dataset, width
Outputs: results, analysis, uuid
6
References
Acker, James G., and Gregory Leptoukh. 2007. “Online Analysis Enhances Use of NASA Earth Science Data.”
Eos, Transactions American Geophysical Union 88 (2): 14.
Allison, Lee, and Robert Gurney. 2014. Belmont Forum E- Infrastructures and Data Management Collaborative Research Action.
Buytaert, Wouter, Selene Baez, Macarena Bustamante, and Art Dewulf. 2012. “Web-Based Environmental Simulation: Bridging the Gap between Scientific Modeling and Decision-Making.” Environmental Science & Technology 46 (4): 1971–76.
Craglia, Max, Michael F Goodchild, Alessandro Annoni, Gilberto Camara, Michael Gould, Werner Kuhn, David Mark, Ian Masser, and David Maguire. 2008. “Next-Generation Digital Earth.” International Journal of Spatial Data Infrastructures Research 3: 146–67.
De Jesus, J., P. Walker, M. Grant, and S. Groom. 2011. “WPS Orchestration Using the Taverna Workbench: The eScience Approach.” Computers & Geosciences, November. Elsevier, 1–12.
Dubois, G., M. Schulz, J. Skøien, L. Bastin, and S. Peedell. 2013. “eHabitat, a Multi-Purpose Web Processing Service for Ecological Modeling.” Environmental Modelling & Software 41 (March). Elsevier Ltd: 123–33. Eberle, Jonas, Siegfried Clausnitzer, Christian Hüttich, and Christiane Schmullius. 2013. “Multi-Source Data
Processing Middleware for Land Monitoring within a Web-Based Spatial Data Infrastructure for Siberia.”
ISPRS International Journal of Geo-Information 2 (3): 553–76.
Eberle, Jonas, and Christian Strobl. 2012. “Web-Based Geoprocessing and Workflow Creation for Generating and Providing Remote Sensing Products.” Geomatica 66 (1): 13–26.
Evangelidis, Konstantinos, Konstantinos Ntouros, Stathis Makridis, and Constantine Papatheodorou. 2014. “Geospatial Services in the Cloud.” Computers & Geosciences 63 (February). Elsevier: 116–22. doi:10.1016/j.cageo.2013.10.007.
Farnaghi, Mahdi, and Ali Mansourian. 2013. “Disaster Planning Using Automated Composition of Semantic OGC Web Services: A Case Study in Sheltering.” Computers, Environment and Urban Systems 41 (September). Elsevier Ltd: 204–18.
Fielding, Roy Thomas. 2000. “Architectural Styles and the Design of Network-Based Software Architectures.” University of California, Irvine.
Foerster, Theodor, Bastian Schäffer, Bastian Baranski, and Johannes Brauner. 2011. “Geospatial Web Services for Distributed Processing - Applications and Scenarios.” In Geospatial Web Services: Advances in Information Interoperability, edited by Peisheng Zhao and Liping Di, 245–86. Hershey, PA, USA1.
Forkel, Matthias, Nuno Carvalhais, Jan Verbesselt, Miguel Mahecha, Christopher Neigh, and Markus Reichstein. 2013. “Trend Change Detection in NDVI Time Series: Effects of Inter-Annual Variability and Methodology.” Remote Sensing 5 (5): 2113–44.
Friis-Christensen, Anders, Nicole Ostländer, Michael Lutz, and Lars Bernard. 2007. “Designing Service Architectures for Distributed Geoprocessing: Challenges and Future Directions.” Transactions in GIS 11 (6): 799–818.
Future Earth. 2013. Future Earth Initial Design: Report of the Transition Team. Paris, France. http://www.futureearth.info/sites/default/files/Future-Earth-Design-Report_web.pdf.
Group on Earth Observations. 2005. “The Global Earth Observation System of Systems (GEOSS) 10-Year Implementation Plan.” http://www.earthobservations.org/documents/10-Year Implementation Plan.pdf. Huete, a, K Didan, T Miura, E.P Rodriguez, X Gao, and L.G Ferreira. 2002. “Overview of the Radiometric and
Biophysical Performance of the MODIS Vegetation Indices.” Remote Sensing of Environment 83 (1-2): 195–213..
Imran, Muhammad, Raul Zurita-milla, and Rolf A De By. 2011. “Integrated Environmental Modeling - An SDI-Based Framework for Integrated Assessment of Agricultural Information.” In 14th AGILE International Conference on Geographic Information Science, 1–9. Utrecht, The Netherlands.
Jönsson, Per, and Lars Eklundh. 2004. “TIMESAT—a Program for Analyzing Time-Series of Satellite Sensor Data.” Computers & Geosciences 30 (8): 833–45.
Kuenzer, Claudia, Marco Ottinger, Martin Wegmann, Huadong Guo, Changlin Wang, Jianzhong Zhang, Stefan Dech, and Martin Wikelski. 2014. “Earth Observation Satellite Sensors for Biodiversity Monitoring: Potentials and Bottlenecks.” International Journal of Remote Sensing 35 (18): 6599–6647.
Lopez-Pellicer, Francisco J., Walter Rentería-Agualimpia, Rubén Béjar, Pedro R. Muro-Medrano, and F. Javier Zarazaga-Soria. 2012. “Availability of the OGC Geoprocessing Standard: March 2011 Reality Check.”
Computers & Geosciences 47 (November): 13–19.
MacKenzie, C. Matthew, Ken Laskey, Francis McCabe, Peter F Brown, Rebekah Metz, and Booz Allen Hamilton. 2006. “Reference Model for Service Oriented Architecture 1.0.”
Mazzetti, P., S. Nativi, and J. Caron. 2009. “RESTful Implementation of Geospatial Services for Earth and Space Science Applications.” International Journal of Digital Earth 2 (sup1): 40–61.
Meng, Xiaoliang, Fuling Bian, and Yichun Xie. 2009. “Geospatial Services Chaining with Web Processing Service.” In Proceedings of the International Symposium on Intelligent Information Systems and Applications (IISA’09), 6:007–010.
Meng, Xiaoliang, Yichun Xie, and Fuling Bian. 2010. “Distributed Geospatial Analysis through Web Processing Service: A Case Study of Earthquake Disaster Assessment.” Journal of Software 5 (6): 671–79. Müller, Matthias, Lars Bernard, and Daniel Kadner. 2013. “Moving Code – Sharing Geoprocessing Logic on the
Web.” ISPRS Journal of Photogrammetry and Remote Sensing 83 (September): 193–203.
Nash, Edward, Jans Bobert, Karl-otto Wenkel, Wilfried Mirschel, and Ralf Wieland. 2007. “Geocomputing Made Simple: Service-Chain Based Automated Geoprocessing for Precision Agriculture.” In
GeoComputation 2007. Maynooth, Ireland.
Overdick, Hagen. 2007. “The Resource-Oriented Architecture.” 2007 IEEE Congress on Services (Services 2007), July. Ieee, 340–47.
Schaeffer, Bastian, Bastian Baranski, Theodor Foerster, and Johannes Brauner. 2012. “A Service-Oriented Framework for Real-Time and Distributed Geoprocessing.” In Geospatial Free and Open Source Software in the 21st Century, edited by Erwan Bocher and Markus Neteler, 3–20. Berlin, Germany: Springer Berlin
Sun, Alexander. 2013. “Enabling Collaborative Decision-Making in Watershed Management Using Cloud-Computing Services.” Environmental Modelling & Software 41 (March). Elsevier Ltd: 93–97.
Traore, Abdoul, Philippe Ciais, Nicolas Vuichard, Natasha McBean, Cecile Dardel, Benjamin Poulter, Shilong Piao, et al. 2014. “1982–2010 Trends of Light Use Efficiency and Inherent Water Use Efficiency in African Vegetation: Sensitivity to Climate and Atmospheric CO2 Concentrations.” Remote Sensing 6 (9): 8923–44. Tucker, Compton J. 1979. “Red and Photographic Infrared L , Lnear Combinations for Monitoring Vegetation.”
Remote Sensing of Environment 8: 127–50.
Verbesselt, Jan, Rob Hyndman, Glenn Newnham, and Darius Culvenor. 2010. “Detecting Trend and Seasonal Changes in Satellite Image Time Series.” Remote Sensing of Environment 114 (1). Elsevier B.V.: 106–15. Verbesselt, Jan, Rob Hyndman, Achim Zeileis, and Darius Culvenor. 2010. “Phenological Change Detection
While Accounting for Abrupt and Gradual Trends in Satellite Image Time Series.” Remote Sensing of Environment 114 (12). Elsevier B.V.: 2970–80..
Vitolo, Claudia, Yehia Elkhatib, Dominik Reusser, Christopher J.a. Macleod, and Wouter Buytaert. 2015. “Web Technologies for Environmental Big Data.” Environmental Modelling & Software 63 (January). Elsevier Ltd: 185–98.
Warmerdam, Frank. 2008. “The Geospatial Data Abstraction Library.” In Open Source Approaches in Spatial Data Handling, edited by G.Brent Hall and MichaelG. Leahy, 2:87–104. Advances in Geographic Information Science. Springer Berlin Heidelberg.
Weerawarana, Sanjiva, Francisco Curbera, Frank Leymann, Tony Storey, and Donald F Ferguson. 2005. Web Services Platform Architecture: SOAP, WSDL, WS-Policy, WS-Addressing, WS-BPEL, WS-Reliable Messaging and More. Upper Saddle River, NJ, USA: Prentice Hall PTR.
Wosniok, Christoph, Felix Bensmann, Roman Wössner, Jörn Kohlus, and Rainer Roosmann. 2014. “Enriching the Web Processing Service.” In EGU. Vol. 16. Vienna, Austria.
Wu, Huayi, Lan You, Zhipeng Gui, Shuang Gao, Zhenqiang Li, and Jingmin Yu. 2014. “FAST: A Fully Asynchronous and Status-Tracking Pattern for Geoprocessing Services Orchestration.” Computers & Geosciences 70 (September). Elsevier: 213–28.
Zhao, Peisheng, Theodor Foerster, and Peng Yue. 2012. “The Geoprocessing Web.” Computers & Geosciences
Analysing the practical feasibility of FOSSGIS in military operations – A
Cholera outbreak use case
Susanna Jacoba Henrico*a, Serena Coetzeea, Antony Kyle Cooperb
a University of Pretoria, b Built Environment Unit, CSIR, Pretoria, South Africa
KEYWORDS: Open source software, military operation, geographic information system, QGIS, hot spot analysis, kernel density estimation, buffering, viewshed analysis
ABSTRACT:
Remaining ahead of the enemy in all circumstances is crucial to any military power. Geographic information systems (GIS) can provide the military commander with geospatial information about the theatre of war to assist with the planning and execution of a mission. Unfortunately, technology usually comes at a price. GIS is no exception. The cost of acquiring and maintaining GIS software licenses, as well as training staff in the use of the software, needs to be considered. The question arises whether open source software, which can be used without any software license expenses, is a feasible alternative in military operations. The problem is that the perception exists that open source GIS software is neither user-friendly nor mature enough to be used in military operations. This study evaluates the functionality of an open source desktop GIS product in a military operation use case. A list of specific GIS functionalities was compiled based on the literature study and by developing a use case. The functionalities were executed in QGIS. Results were compared against results of the same functionalities in ArcGIS, which is widely used in military operations. Results show that all GIS functions tested by this study could be performed by both software products. These results are interesting because it means that FOSSGIS can be successfully deployed by units or directorates that has limited funds available to expand the existing GIS capabilities for military operations.
1
Introduction
In military operations, considerations for military equipment, infrastructure and activities (“What?, ”When?”, “Where?”) are important. They develop a perception (“How?”, “Why?”) of the enemies’ type and number of equipment available, force readiness, present activities involved in and future planned activities. These considerations and perceptions are enhanced by focusing and paying attention to terrain as one of the important factors to consider during planning. The terrain determines the type of military vehicles and weapon systems that can be deployed and used. Terrain layout also influences the execution time of certain maneuvers or operations (Lodi et al., 2014). Even communications are influenced by the terrain. It is therefore imperative to determine line-of-sight as this factor is crucial for certain kinds of communications, as well as for some weapon systems (Datz, 2008). Furthermore, geomagnetic information affects equipment that could be used in an operation. This is where GIS plays an important role in support of military operations. It provides a means to the military commander in the form of geospatial information about the theatre of war (Űnal and Mustafa, 2002). GIS analyze information about the terrain (i.e. land cover) and population (i.e. land use) and consider other sources such as remotely sensed imagery to produce geospatial products (e.g. maps). These products are critical aids to the commander in developing a comprehensive picture of the terrain layout and land use, as important factors to assess before making any decision.
The cost of acquiring and maintaining GIS software licenses, as well as training staff in the use of the software, can become a significant portion of the costs of a military operation. As a result, the number of licenses that are
modern business”. The open source movement supports the use of open source licensing, which means that software can be freely used, modified, and shared.
While open source GIS products exist, in military communities, the perception exists that open source GIS software is neither user-friendly nor mature enough to be used in military operations. This perception is based on personal experience, e.g. based on discussions with colleagues and experience in a defence force work environment where the use of QGIS was proposed, but colleagues were hesitant to embrace the idea.
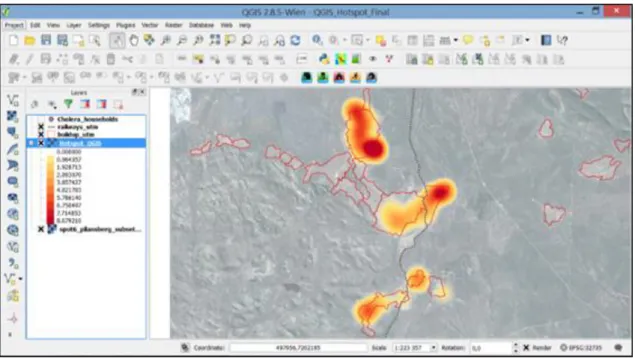
This paper presents first results of a study to explore open source GIS software as a feasible alternative in military operations. A use case of a military operation was developed. GIS functionalities required for this use case were identified and then tested using QGIS (www.qgis.org), an open source desktop GIS product. Test results were compared against results of the same functionalities in ArcGIS (the baseline) and qualitatively analysed and explained. A number of case studies were done to compare ArcGIS to QGIS (GIS Geography, 2016, Dempsey, 04 November 2012, Duggan, 02 February 2015). However, the study reported in this paper is unique because it incorporates military operational requirements related to a specific use case. Secondly, it is not a competition to find a “victor”, but rather an objective study to determine whether FOSSGIS can be used in a specific military operation considering certain operational GIS functionalities (specified by the use case). The remainder of the paper is structured as follows. Section 2 describes the use case, a Cholera outbreak for which a military operation is planned. Section 3 explains how the GIS functionalities were identified and how tests were conducted. In section 4, each test is described, the QGIS and ArcGIS results are presented and subsequently analysed. The section is concluded with a table that summarizes the test results. Section 5 presents conclusions and describes further work to be done.
2
Use case: Cholera outbreak
Cholera is a highly infectious disease that still affects many parts of Africa, as well as other parts of the world, such as south Asia and Latin America. The disease is caused by drinking or eating contaminated water or food. It is often found in areas with “poor sanitation, crowding, war, and famine”. If left untreated, it can lead to death (WebMD, 2016). Cholera outbreak was selected as the scenario for this use case, since it is a very real humanitarian disaster in which the military can be tasked to render support in containing the spread of the disease and providing aid to infected persons. This is an example where the military is tasked to conduct a military operations other than war (MOOTW).
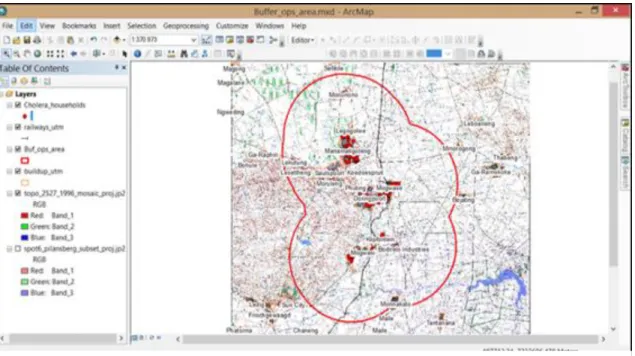
After consultation with commanders involved at different levels and in different roles in operations, (personal communications: Davids, J.M., 12 May 2015; Van Niekerk, A.F.V., 04 September 2015; Venter, J.D., 26 May 2015 and Wylie, A.C., 05 October 2015) a use case was developed (Adolph et al., 2002, Bittner, 2002) that describes the geospatial tasks and products to be executed and produced in a typical military operational scenario for the South African National Defence Force (SANDF). This fictitious scenario describes a health risk disaster in the form of a Cholera (Zuckerman et al., 2007) outbreak in the Pilanesberg area located in North West province in South Africa, 160 km west of Pretoria (see Figure 1). The Pilansberg area is a Game Reserve with numerous rural villages surrounding this area. However, Pilanesberg is a mountain, circular in shape which was formed by an ancient volcano eruption some 1 200 million years ago.
The SANDF was tasked by the Minister of Health to assist in controlling this outbreak, because the SANDF is the only national entity with a medical deployment unit capability. The scenario is fictitious (see Table 1), but it draws on potential military operations in response to disaster relief.
Table 1: Use case description: Cholera outbreak for which a military operation is planned
The SANDF is requested by the Ministry of Health to assist in curbing the outbreak of Cholera in the rural population of the Pilanesberg area, North-West province, South Africa. The Chief of the SANDF tasked the Chief Joint Operations (CJ Ops) to establish an operation room within the disaster management centre and to deploy the following forces to manage and control this health disaster: