Copyright ã UNU/WIDER 2003
1 UNCTAD; 2 UNCTAD and University of Nottingham.
This study has been prepared within the UNU/WIDER project on The Impact of the WTO Regime on Developing Countries, which is directed by Professor Basudeb Guha-Khasnobis.
UNU/WIDER gratefully acknowledges the financial contribution to the project by the Ministry for Foreign Affairs of Finland.
Discussion Paper No. 2003/47
The EU’s Everything But Arms
Initiative and the Least-developed
Countries
Lucian Cernat,
1Sam Laird,
2Luca Monge-Roffarello,
1and Alessandro Turrini
1June 2003
Abstract
Using a computable general equilibrium simulation model and partial equilibrium simulations, based on the SMART model, the paper attempts to assess the aggregate worldwide distribution of gains and losses of the EU’s Everything But Arms (EBA) initiative for both LDCs and third developing countries under different scenarios.
The study shows moderate welfare and trade gains from the EBA initiative. The largest gains are recorded for sub-Saharan Africa and the EU sugar market is the single most important source of change. The effects on the EU itself are minimal, as the increased market access for LDCs comes mostly at the expense of other preference-receiving countries, although the changes are modest.
The analysis does not fully account for non-tariff barriers that may preclude LDCs from increasing their exports to the extent predicted by our analysis. Furthermore, in the longer term, supply-side factors constraints rather than market access limitations may be the more important factors and need the urgent attention of the international community.
Keywords: EBA, LDCs, GTAP, SMART, trade preferences, sugar JEL classification: F13, F17, D58, Q17
The World Institute for Development Economics Research (WIDER) was established by the United Nations University (UNU) as its first research and training centre and started work in Helsinki, Finland in 1985. The Institute undertakes applied research and policy analysis on structural changes affecting the developing and transitional economies, provides a forum for the advocacy of policies leading to robust, equitable and environmentally sustainable growth, and promotes capacity strengthening and training in the field of economic and social policy making. Work is carried out by staff researchers and visiting scholars in Helsinki and through networks of collaborating scholars and institutions around the world.
www.wider.unu.edu [email protected]
UNU World Institute for Development Economics Research (UNU/WIDER) Katajanokanlaituri 6 B, 00160 Helsinki, Finland
Camera-ready typescript prepared by Janis Vehmaan-Kreula at UNU/WIDER Printed at UNU/WIDER, Helsinki
The views expressed in this publication are those of the author(s). Publication does not imply endorsement by the Institute or the United Nations University, nor by the programme/project sponsors, of any of the views expressed.
ISSN 1609-5774
ISBN 92-9190-480-5 (printed publication) ISBN 92-9190-481-3 (internet publication)
Acknowledgements
UNCTAD Secretariats, respectively. Laird is also Special Professor of International Economics at the University of Nottingham. The views expressed in the paper are those of the authors, and do not necessarily represent the views of the organizations for which they work nor the member states of those organizations.
1 Introduction: preferences as a development policy instrument
In recent years there have been increased pressures to help the poorest nations through aid, debt relief and trade initiatives. At the first Ministerial Meeting of the WTO in Singapore in 1996, the then Director-General of the WTO, Renato Ruggiero declared his intention to press WTO members to afford tariff and quota free entry to imports from the least-developed countries (LDCs) to the markets of the developed countries. This initiative bore fruit in 2000, when the European Union (EU) Trade Commissioner, Pascal Lamy, announced the intention to grant duty-free and quota-free access for all goods (with the exception of arms) originating in least developed countries, announced its ‘Everything But Arms’ Initiative, under which it proposed to reduce to zero all tariffs on imports from LDCs except arms and to free such imports from any quantitative restriction. Other developed countries have made similar proposals, including the United States’ African Growth and Opportunities Act, but in terms of the value of trade the EU proposal is the most important. In the current paper we attempt to evaluate the EU proposal, using ex-ante trade simulation techniques. Section 2 gives details on the EU scheme, Section 3 looks at the economics of unilateral preferential scheme, Section 4 sets out the findings of our quantitative analysis and Section 5 draws some tentative conclusions.
The notion of providing trade preferences for development purposes has its origins in Prebisch and Singer’s work on the secular decline in the terms of trade for agricultural commodities and the perception that only manufacturing could provide stability and
jobs in developing countries.1 The Prebisch-Singer hypothesis led to two important
policy prescriptions: sectoral intervention favouring import-competing manufacturing industry (import-substitution industrialization), and the idea of creating non-reciprocal tariff preferences to foster manufactured exports from the developing countries. In the latter case, the Generalized System of Preferences (GSP) is the most extensive and explicit expression of an attempt to use trade preferences as a tool of development, but today there are a number of other schemes, limited to sub-groups of developing countries, with varying product coverage and preferential arrangements. Juridically, preferences for LDCs form a sub-set of the GSP, while other unilateral preferences depend on explicit waivers of WTO rules.
The GATT 1947 had no provisions for special arrangements to help developing
countries through trade (Laird et al. 2001). However, a number of provisions were
added in 1965, for example, Article XVIII, Article XXVIII bis and Part IV on Trade and
Development, which recognized the need for a ‘rapid and sustained expansion of the export earnings’ of the developing countries and exhorting ‘positive efforts designed to ensure that [developing countries] secure a share in the growth of international trade commensurate with the needs of their economic development’ by developed countries. Part IV also recognized the needs to ‘provide in the largest possible measure more favourable and acceptable conditions of access to world markets’ for their limited range of primary exports, including ‘measures to attain stable, equitable and remunerative prices’.
1 For an early history, see ‘The History of UNCTAD 1964-84’, United Nations, New York, 1985 (Document UNCTAD/OSG/286, UN Publication Sales No. E.85.II.D.6).
In parallel, Prebisch, then Secretary-General of UNCTAD, proposed the GSP, at UNCTAD I in 1964. The arguments were essentially: MFN treatment did not provide equality with domestic producers or regional trade partners unless set at zero; MFN treatment did not take account of inequality in economic structure and levels of development; and because negotiations were conducted on the basis of reciprocity and the MFN principle, developing countries’ exports continued to face high tariffs. Preferences were seen as helping to overcome these disadvantages. Prebisch’s proposals were subsequently adopted as a principle at UNCTAD II in New Delhi in 1968. The compromise was that the Conference agreed ‘that the objectives of the generalized, non-reciprocal, non-discriminatory system of preferences in favour of developing countries should be: (a) to increase their export earnings; (b) to promote their industrialization;
and (c) to accelerate their rates of economic growth’.2 It was also recognized that
‘special preferences should be granted to the less advanced developing countries’ – LDCs in today’s terminology. It was also agreed that, while developing countries would not offer ‘conventional reciprocity’, as a result of preferences they would be able to import more than if the preferences had not been granted. The early discussion already envisaged quota limits, graduation, and the eventual phasing out of preferences.
In order to allow the GSP system to become legally operational, on 25 June 1971, the GATT Contracting Parties decided to waive the provisions of Article I of the GATT for a period of 10 years to the extent necessary to permit contracting parties to accord preferential tariff treatment to products originating in developing countries and
territories.3 This Decision refers to ‘generalized, non-reciprocal, non-discriminatory
preferences beneficial to the developing countries’. Finally, on 28 November 1979, following the conclusion of the Tokyo Round in one of the ‘framework agreements’, the Contracting Parties adopted the Decision on Differential and More Favourable Treatment, Reciprocity and Fuller Participation of Developing Countries (the ‘Enabling Clause’) which provided a legal basis (other than a waiver) for the granting of trade preferences, tariffs and non-tariff measures, by developed contracting parties in favour of developing countries, and special treatment of the LDCs in the context of any general
or specific measures in favour of developing countries.4 The Enabling Clause, as a
decision of the GATT Contracting Parties, became part of the WTO system under provisions of paragraph 1 of the GATT 1994.
The Enabling Clause therefore constitutes the legal basis by which individual WTO
Members may unilaterally grant GSP preferences to developing countries.5 Based on
the permissive rather than mandatory language of the Decision, preference givers usually consider that they may also unilaterally modify, extend or withdraw such preferences, including the coverage of beneficiaries. Developing countries often argue that this creates a degree of uncertainty about the scope and duration of preferences,
2 Conference resolution 21 (II). 3 BISD 18S/24.
4 L/4903 (BISD 26S/203).
5 The granting of non-reciprocal preferences by developing countries in favour of LDCs is the subject of the Decision of 15 June 1999 (WT/L/304).
mitigating the benefits. Some such countries have therefore suggested the binding of
preferential rates or margins to increase the security of GSP benefits.6
The generalized basis of preferences under the Enabling Clause means that there is no need for donor countries to seek permission to grant preferences to developing countries or even better preferences to LDCs. However, as noted, unilateral preferences that are only available to selected developing countries are not covered by the Enabling Clause (cf. reciprocal preferences, under GATT Article XXIV on regional trade agreements), and require a non-automatic ‘waiver’ from the general WTO rules. This procedure covers preferences under the Cotonou Agreement for African, Caribbean and Pacific (ACP) countries or the US Caribbean Basin Initiative (CBI), etc.
Laird et al. (2001), in an analysis of the schemes of the Quad, show that imports at GSP
rates were all less than 1 per cent of total imports by the respective donors. In Canada, the EC and Japan, where the GSP is often a non-zero rate below the MFN rate, the simple average GSP and LDC rates are, as might be expected, lower than the simple average MFN rate, whether on all items or dutiable items, and the import-weighted average on dutiable items is also lower than the import-weighted MFN average. In the case of import-weighted averages, however, the GSP rate is higher on all items in these three markets. This apparent inversion takes place because imports from developing countries are often of goods that attract high MFN rates, and the import-weighting procedure (where GSP rates are set at a margin below MFN rates) gives higher average rates. This phenomenon cannot exist in the US, where the GSP rate is set at zero for qualifying imports.
Statistics also demonstrate that relatively few countries have captured the main benefits
of GSP.7 Across the major schemes, there is a considerable concentration of benefits
among developing countries with relatively large and diversified economies, including substantial manufacturing sectors. There is a strong representation of East Asian countries and India. China is the leading beneficiary in the schemes of Canada, the EC and Japan, but is excluded from the US scheme. Brazil is the major Latin American beneficiary, while South Africa is the leading African beneficiary (North African countries being covered by other preferential schemes in the EC where they might otherwise be larger suppliers than South Africa). There are no LDCs among the top 20 GSP plus LDC suppliers to the Canadian market. Bangladesh is the only LDC in the top 20 of such suppliers to the EC, and Mauritania is the only LDC in the top 20 of such suppliers to Japan. Angola and Democratic Republic of the Congo are among the top 20 suppliers to the US market, with Angola being the third supplier.
It should be noted that while the WTO itself has no definition of developing countries, the WTO accepts the definition of LDCs from the United Nations system that lists 49 LDCs on the basis of income (below US$900 per capita GDP), a human resource criterion and an economic vulnerability criterion. In the WTO, developing countries are often said to be a self-electing category, but in practice this depends on acceptance by
6 See for example WT/GC/W/331. The Enabling Clause does not provide legal cover for non-reciprocal, country-selective preference schemes such as those by the EC in favour of ACP countries, by the US and Canada in favour of Caribbean countries, and so on. These are covered by waivers from Article I of the GATT which are limited in time and require WTO approval for renewal.
other WTO Members, which decide whether or not to apply provisions in favour of developing countries to a particular country.
2 EU preferential market access arrangements for LDCs
This section provides a brief overview of the preferences granted by the EU to LDCs
prior to and after the implementation of the EBA initiative.8
As mentioned, the reason for focusing on the EU is that it is the most important single market for LDC exports. Over 50 per cent of LDC exports were sold in 2000 on the EU market, compared to 37 per cent in 1999. In 2000, the EU took around 70 per cent of LDC agricultural exports. Among the 49 LDCs, 15 are dependent on this market, as over 50 per cent of their exports are directed there. The orientation of LDC exports towards the EU market is partly explained by the relatively low tariff barriers faced in the European market (Table 1). Out of total LDC exports, 44.7 per cent received preferential market access and prior to the EBA implementation only 3 per cent of existing LDC exports faced a tariff into the European Union. Out of the 49 LDCs included the GSP scheme for LDCs 39 LDCs have also benefited from preferential market access under the ACP regime. For non-ACP LDCs however, since 1998, the preferential market access for LDCs in the European Union has been enhanced so as to provide them with ACP-equivalent market access. Yet, there were still notable
differences between the two preferential regimes.9
2.1 The pre-EBA market access for LDCs
Over time, the European Union GSP scheme for LDCs has undergone a considerable number of changes. For some products, the EU GSP scheme granted duty-free entry. For other products, preferences for a given product were expressed as a percentage reduction of the MFN duty rates. This percentage depended on a given product’s ‘sensitivity’, which is determined by the situation of the sector manufacturing the same product in the Community. According to its degree of sensitivity, each product was
classified as belonging to one of four groups.10
Since 1995, the EU has eliminated all quantitative limitations. Yet, its GSP scheme maintained the ‘graduation mechanism’ under which the benefit of the scheme is phased out for specific sectors or countries that have reached a degree of competitiveness where
8 For a general description of the EU GSP scheme, including the EBA initiative, see for instance UNCTAD (2002).
9 See UNCTAD (2001a:17) for further details on the products for which non-ACP LDCs were receiving less preferential market access, compared to ACP LDCs in the pre-EBA GSP scheme for LDCs. 10 The four categories are as follows: (1) very sensitive products, for which the MFN preferential margin
is 15 per cent; (2) sensitive products, for which the MFN preferential margin is 30 per cent; (3) semi-sensitive products, for which the MFN preferential margin is 65 per cent; (4) non-semi-sensitive products, which enter the European Union market duty-free.
they increased their exports even without enjoying GSP treatment.11 Moreover, as other
preferential arrangements, the European Union GSP scheme contained safeguard measures that could suspend or withdraw the preferential market access. Also, as mentioned above, in 1998 the EU improved the GSP scheme for LDCs to grant them a
similar level of market access as that enjoyed by ACP countries.12
However, although the pre-EBA LDC market access to the EU had a wide coverage of
products, more than 900 agricultural products (at HS 8-digit level) were subject to ad
valorem or specific duties. Table 2 provides a selection of products with the highest number of dutiable lines faced by LDCs exports in 2000 to the European Union, prior to the implementation of the EBA initiative.
2.2 The EBA initiative
The EBA proposal was enacted by the Council Regulation No. 416/2001 of 28 February 2001, amending EC Regulation No. 2820/98 applying a multi-annual scheme of generalized tariff preferences for the period 1 July 1999 to 31 December 2001, so as to extend duty-free access without any quantitative restrictions to 919 agricultural products originating in the least developed countries. More than 50 per cent of the liberalized tariff lines covered meat and dairy products, beverages and milled products (Table 3). EBA entered into force on 5 March 2001.
It should be noted that while the preferences for developing (LDC and non-LDC) countries under the GSP scheme are subject to periodic renewal, the special arrangements provided for in the EBA initiative (modifying the GSP) with regard to
market access for LDCs would be maintained for an unlimited period of time.13
All the products included in the initiative are agricultural products – in contrast with the original GSP, which, in line with the Prebisch thesis, focused on manufactured products. Products such as fruits and vegetables, meat, beverages and dairy products are now granted duty-free and quota-free access to the EU market. Only three products have not been liberalized immediately: bananas, rice and sugar. Their phase-in periods for full
market access are as follows:14
11 Further details on the GSP scheme of the European Union can be found in the UNCTAD Handbook on the EU GSP Scheme, available online at http://www.unctad.org/gsp/.
12 See Council Regulation (EC) No. 602/98 of 9 March 1998 extending the coverage of Regulations (EC) No. 3281/94 and No. 1256/96 concerning Community schemes of generalized tariff preferences for the benefit of the least-developed countries (Official Journal L 080 1998: 1-16).
13 One common criticism of GSP schemes and other non-binding unilateral preferential schemes for developing countries was the uncertainty of such trade regimes stemming from their annual renewal. Donor countries can exclude countries and products or alter the procedures at any time when such preferential schemes are reviewed. Not being subject to periodic renewal, the EBA initiative makes a step further in reducing the uncertainty of preferential market access for LDCs. However, being adopted within the GSP framework the EBA, unlike the EU-ACP arrangements, can be modified unilaterally by the EU.
14 The information provided below is based on data available from the European Commission, at http://www.europa.en.int/comm.
• Bananas – duties will gradually be eliminated, by a 20 per cent annual reduction, starting on 1 January 2002. All duties will be eliminated from 1 January 2006;
• Rice – full liberalization will be phased in between 1 September 2006 and 1
September 2009 by gradually reducing the full European Union tariff to zero. Duties will be reduced by 20 per cent on 1 September 2006, by 50 per cent on 1 September, 2007 and by 80 per cent on 1 September, 2008. During the transition period, LDC rice can be exported duty-free to the European Union within the limits of a tariff quota. The initial quantities of this quota shall be based on best LDC export levels to the European Union in the recent past, plus a growth factor of 15 per cent. The quota will grow every year, from 2,517 tonnes (husked-rice equivalent) in 2001/2002 to 6,696 tonnes in 2008/2009 (September to August marketing year);
• Sugar – similar arrangements are provided for sugar. Full liberalization will be
phased in between 1 July 2006 and 1 July 2009. During the transition period, LDC raw sugar can be exported duty-free to the European Union within the limits of a tariff quota, which will be increased from 74,185 tonnes (white-sugar equivalent) in 2001/2002 to 197,355 tons in 2008/2009. The provisions of the ACP-EC Sugar Protocol will remain valid.
The adoption of EBA had to meet certain conditions imposed by other international trade arrangements where the EU was signatory: the WTO agreements and the ACP preferential trade arrangements. The EBA was adopted as an amendment to the existing GSP scheme in order to benefit from the compatibility with the WTO rules of the current GSP scheme. The basis for EBA under the WTO is paragraph 2(d) of the Enabling Clause of 1979, which allows for special treatment to be granted for least developed countries in the context of any general or specific measures in favour of
developing countries. The EBA had to be not only WTO compatible but also in line
with the ACP regime. The Lomé Convention required EU to grant non-discriminatory market access to all ACP countries. However, the EBA initiative would have granted more preferential market access to ACP LDCs than the one enjoyed by ACP non-LDCs. Therefore, in the Cotonou Agreement that superseded the last Lomé Convention, article 174(2)(b) of the Lomé Convention imposing non-discrimination among ACP states was eliminated. Thus, the European Union can offer better market access to LDC ACP States without extending it to non-LDC ACP countries, as the above-mentioned article would have required.
Apart from the extension of duty and quota free market access to all products (with the exceptions of arms) originating in LDCs the EBA brings only few changes in the
general rules administering the existing GSP scheme.15 Of these, one of the more
important changes is that, unlike the EU GSP scheme that is subject to renewal and revision, EBA has no time limitation. On the other hand, the EBA also introduces new provisions allowing the EU to introduce safeguard measures when massive increases in imports of products originating in the LDCs arise in relation to their usual levels of production and export capacity. Specific safeguard measures apply especially with regard to sensitive products (bananas, sugar and rice), if imports of these products cause serious disruptions to the EU mechanisms regulating these products (the CAP and
15 For instance, as in the GSP scheme, the EBA also allows for diagonal cumulation of origin between the LDCs and ASEAN, SAARC and the European Union.
EU protocols in particular). The European Commission will review the functioning of EBA in 2005, when amendments can be introduced, if necessary.
These new safeguard measures are in addition to those laid down in Council Regulation No. 2820/98 of 21 December 1998, whereby preferential tariff treatment under the GSP may be temporarily withdrawn (in whole or in part) in the case of certain activities
including slavery, forced labour,16export of goods made by prison labour, manifest
shortcomings in customs controls on export or transit of drugs, failure to comply with international conventions on money laundering and fraud or failure to provide the
cooperation required for the verification of certificates of origin.17 Other circumstances
qualifying for such a withdrawal are manifest cases of unfair trading practices on the
part of a beneficiary country18 or manifest infringements of the objectives of
international conventions concerning the conservation and management of fishery
resources.
Furthermore, under Article 28 of the above mentioned regulation, MFN duties on a product may be reintroduced where that product originating from a developing country is imported on terms which cause or threaten to cause serious difficulties to a Community producer of like or directly competing products. (This basically parallels safeguards under GATT Article XIX.) In examining the possible existence of such
serious difficulties the Commission takes, among other things, the following factors into
account: reduction in market share of Community producers, reduction in their
production, increase in their stocks, closure of their production capacity, bankruptcies,
low profitability, low rate of capacity utilization, employment, trade and prices.19
The EBA initiative modifies the GSP scheme by adding to the reasons for the possible temporary withdrawal of preferences a ‘massive increases in imports into the Community of products originating in LDCs in relation to their usual levels of
production and export capacity’.20This addition shall allow the Commission to ‘react
swiftly when the Communities financial interests are at stake’.21 The post-EBA GSP
scheme also contains an extra paragraph in article 28 allowing for the suspension of the preferences provided by this regulation for rice, sugar and bananas, ‘if imports of these products cause serious disturbance to the Community markets and their regulatory
mechanisms’.22 The Commission announcedthat whenever LDC imports of rice, sugar
or bananas exceed, or are likely to exceed the previous years level by more than 25 per
16 A temporary withdrawal on this ground has been exercised in 1997, when Myanmar has been temporarily excluded from GSP treatment for alleged forced labour practices. Council Regulation 552/97 of 24 March 1997. OJ L 85, 27 March 1997.
17 Article 22:1 (a)-(d) of the Council Regulation No. 2820/98 of 21 December 1998.
18 Article 22:1 (e) of the Regulation states that the withdrawal shall be in full compliance with the WTO rules.
19 Article 28:3 states that the Commission will do so ‘where the information is available’. 20 Article 1:4 of Council Regulation No. 416/2001 of 28 February 2001.
21 Paragraph 13 in the preamble of Council Regulation No. 416/2001 of 28 February 2001. 22 Article 1:5 of Council Regulation No. 416/2001 of 28 February 2001.
cent, then it will automatically examine whether the conditions for applying GSP
safeguard measures are met.23
It remains to be seen whether the EBA modifications to the GSP safeguard scheme will in practice work to frustrate market access for LDCs or to provide a genuine escape mechanism where severe market disturbances result from the newly granted LDC preferences.
3 The economics of non-reciprocal trading arrangements
The larger part of current preferential trade is associated with the existence of regional agreements, under GATT Article XXIV, whereby countries reciprocate mutual trade concessions. The EBA initiative is an example of a non-reciprocal, preferential trade arrangement, falling within the framework of the WTO’s Enabling Clause. Under these arrangements, ‘beneficiary’ or preference-receiving countries do not have the obligation to reciprocate to ‘donor’ or preference-granting countries. What distinguishes the EBA from other unilateral preference schemes (excluding GSP) is a lower degree of discrimination. Although GSP is supposed to be ‘generalized’ and ‘non-discriminatory’, in practices GSP arrangements often provide, for each sector, differential treatment of beneficiary countries. By contrast, under EBA all LDCs are to be equally given
duty-free, quota-free access to the market of the EU donor countries in all sectors but arms.24
What are the effects of preferential trade arrangements? Does it matter if those arrangements are non-reciprocal? Which kind of information do we need to assess the impact of non-reciprocal, preferential trade arrangements on donor, recipient and third countries? The theory of international trade helps answering such questions.
The easiest way to figure out the effects of preferential trade arrangements is to refer to
a partial equilibrium three-country, one-product framework.25 Countries are denoted by
A, B and C. Countries A and B are assumed to be signing a non-reciprocal, preferential trade arrangement in which A is the donor and B is the beneficiary country. Country C represents the rest of the world. Production occurs in perfectly competitive firms, and returns to scale are non-increasing. Under standard conditions on preferences and
technologies, the import demand curve for country A, MA, will be downward sloping
(see Figure 1). Country A can import the good either from country B or from the rest of the world C. In absence of any preferential trade arrangement, country A levies an import duty equal to t on the imports originating from both B and C. We also assume
that the export supply curve to A is perfectly horizontal for C (XC in Figure 1) and
positively sloped for B (XB). This is normally the case when B is a relatively small
economy with respect to C, representing the rest of the world.
23 Statement of the European Commission of 1 March 2001. See also the reports available at http://w.sugartraders.co.uk/archive.htm and http://www.eurinco.co.uk/trade/eba_rev2.htm.
24 This is not the case of the US scheme which provides duty-free and quota-free treatment for African countries, some of which are not LDCs, while excluding non-African countries.
25 This analytical approach has been introduced by Viner (1950). In the exposition, we follow quite closely Panagariya (1998).
Let us then consider the effects associated with A giving preferential duty-free access to
B. Initially, the import price in A is equal to Pc+ t, total imports amount to OQ0, of
which 0
B
Q come from country B, and the rest from C (Figure 1). After granting
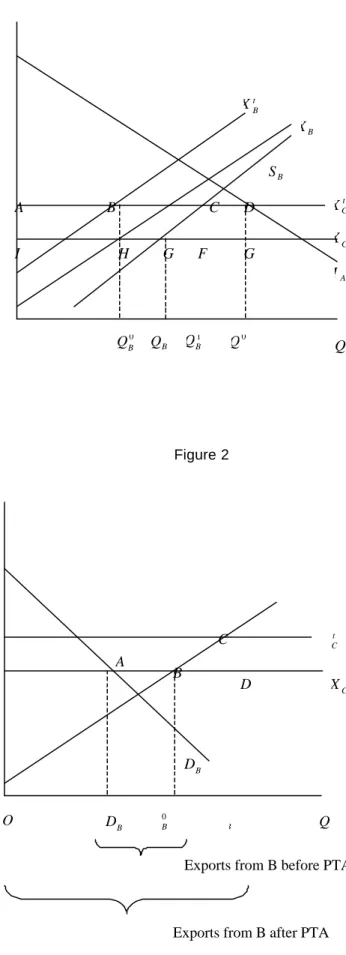
duty-free access to PTA, country A removes its tariff only on the imports originating from B. The situation in the beneficiary country B is evident from Figure 2. Before
liberalization, the domestic price in country A is equal to Pc+ t and exporters earn PC
for each unit sold in A. Since country B is an exporter of the good in the
pre-liberalization scenario, at price PC supply must exceed demand in B. Moreover, being
an exporter, country B will not have any tariff on the good. After granting duty-free access to B, A starts importing duty-free from B, so that the exporters of B get the full
domestic price PC +t for each unit sold in A. This price change has major effects in B:
all production in B will be directed towards A. Producers in B are in fact bound to serve
the domestic market at price PC, otherwise domestic buyers would shift to imports from
C. Necessarily, after receiving duty-free access, producers in B will only sell to A at
t
PC + , and consumers in B will only import the good from C.
It is now straightforward to look at the effects of the preferential liberalization on the
donor country A. Because of the quite extreme assumption that the supply of the rest of
the world C is perfectly horizontal, there would be no change in the import price in A
after liberalization and no change in imported quantities. Necessarily, trade creation would be absent. There will be instead a shift of imports away from the rest of the world
C and in favour of the beneficiary country B. However, it may be noted that the shift in
the supply curve of B producers to the A market does not correspond to a shift from the
original export supply curve t
B
X to the ‘duty-free curve’ XB. Since all production from
B will now be sold to A, with no sales on the domestic market of B, the supply curve of
B to A will correspond to the same supply curve SB as in Figure 2. The new import
level of A from B will thus be 1
B Q .
As for welfare, trade creation is straightforwardly nil, thus no gains accrue to country A
from this source. Moreover, since B at the new price is less efficient than C in producing
the required imports, trade diversion would result. The shift towards less efficient
suppliers will entail a loss in tariff revenue for A, represented by area ACFI. So, the
donor country loses due to a trade-diversion effect. As for B, there is an improvement in
the terms of trade. This results in export expansion for B, larger output volume, and
increased producer rents, which rise by an amount represented by trapezoid ACGI.
Finally, the effects on the rest of the world are nil, since C has a flat export supply
curve. On net, the preferential liberalization policy of A leads to a net loss for the world
as a whole, represented by the triangle CFG in Figure 1. This corresponds to the loss in
tariff revenue in A less the increase in producer surplus in B. The deadweight loss is
associated with the higher cost of production of quantity ˆ 1
B BQ
Q in B as compared with
C. A more efficient producer has been replaced by a less efficient one.26
26 Note that there is not such an inefficiency associated with imports 0 1 B BQ
Q because these quantities are not produced additionally after PTA: they are just redirected from the domestic market of B to the market of A.
Summarizing, from the standard 3x1 partial equilibrium model it emerges that granting non-reciprocal preferences is more likely to generate gains in the beneficiary country, losses in the donor country, to have negligible effects on third countries and to produce a deadweight loss on aggregate. It is to note that the major welfare effects of preferential liberalization are associated with easily identifiable and measurable trade flows. In particular, the gains to the beneficiary country are associated with its export expansion, while the losses in the donor country are associated with the amount of third country imports displaced.
However, there are some major caveats concerning the foregoing analysis. First, the result that trade creation is nil for the donor country after granting preferential market access depends crucially on the assumption that the supply curve for the rest of the world is perfectly flat. Allowing for a less-than-perfectly flat supply curve would result in positive trade creation and improved global welfare as long as the supply curve of the beneficiary country is flatter than that of the rest of the world.
Second, a single homogenous good has been assumed, and this justifies the assumption of the supply curve of the rest of the world being perfectly flat. When goods originating from different countries are imperfect substitutes, the a-priori concerning the relative elasticity of the supply curve of goods originating from different countries becomes less obvious. It can be shown that with imperfectly substitute goods and perfectly elastic supply curves for both beneficiary and third countries a policy of preferential, non-reciprocal liberalization may either increase or lower world welfare (see, for example, UNCTAD 2002) for a survey of the theoretical literature on the topic).
Third, general equilibrium effects are neglected in the above analysis. No assessment is made on whether the conclusion of non-reciprocal trade arrangements is likely to improve or worsen the allocation of resources within countries. Depending on the sector bias of the trade arrangement, the patterns of trade may become either closer or depart from countries’ comparative advantages. These issues are relevant for assessing the effects on world welfare, but their analysis require a full-fledged multi-sectoral general equilibrium setting.
In the next section, we simulate the granting of unilateral preferences by the EU for LDCs. We also move from the classical analysis described above in several ways. On the one hand, we consider non-infinite supply conditions, non-homogeneous goods (the ‘Armington’ assumption) and, in part of the analysis, we also move to a general equilibrium framework.
4 Assessing the impact of EBA
Existing studies based on simulation analysis (Ianchovichina et al. 2001, UNCTAD
2001b, Trueblood and Somwaru 2002) show that the impact of the EBA initiative is likely to be concentrated on a narrow set of sectors, in particular, sugar and rice. From these studies, it also emerges that, while for some beneficiary LDC countries the effect of the liberalization policy may be non-negligible (at the end of the transition period), the effects on the EU are likely to be minor. However, trade diversion will take place especially for the non-LDC developing countries receiving preferences from the EU but excluded from EBA.
The aim of this section is, first, that of assessing the aggregate worldwide distribution of gains and losses of the EBA initiative, focussing on the LDCs and on third non-beneficiary developing countries, using a computable general equilibrium simulation model (GTAP). Second, the disaggregated sectoral dimension is explored by means of partial equilibrium simulations (based on the SMART model). In this case, the focus of the analysis is that of understanding in which product categories the expansion and redirection of trade flows will be stronger.
4.1 The aggregate impact
4.1.1 The experiment, the model and the data
Our objective is that of simulating the effects of a complete removal of both tariff and non-tariff barriers faced by LDCs in the EU market. We look at the effects of the policy on each country’s welfare, and on their sectoral trade and production patterns. Welfare changes are further decomposed in their allocative effects and the terms of trade
component. Our policy experiment is similar to those found in Ianchovichina et al.
(2001), UNCTAD (2001a) and Trueblood and Somwaru (2002). However, there are some important differences that are discussed below.
The model used for the CGE simulations in the present study is that developed under the Global Trade Analysis Project (GTAP) as described in Hertel (1997). GTAP is a widely used ex-ante evaluation tool for trade policy analysis. Since the EBA initiative is likely to impact mainly the agricultural sector, the standard static, perfect competition,
constant returns to scale version of GTAP is adopted.27
The database used in the simulations is that available in GTAP Database Release No. 5 (GTAP5), with a 1997 base year. This is therefore the benchmark (status-quo) in
evaluating the impact of trade policy shocks.28
27 For a description of the GTAP model see Hertel (1997). The world is divided in regions. Within each region, consumers have the same non-homothetic preferences, according to which allocate income between private consumption, public consumption and savings. Products originating from different countries are perceived as different by consumers (Armington differentiation). The elasticity of substitution between any pair of domestic and imported goods is constant within each sector, and the elasticity of substitution between each pair of imported goods originating from different countries is twice higher than that between domestic and foreign goods. The production side of the model assumes fixed production coefficients between primary inputs and intermediate inputs. As for intermediate inputs, they are also assumed to be ‘Armington differentiated’, with constant substitution elasticities. Production factors are fully employed. Labour is mobile across sectors and immobile internationally. Households’ savings finance investment, and investment does not affect the current capital stock. Countries can borrow and lend abroad. The ‘standard’ GTAP closure is adopted: total world savings add up to total world investment and expected rates of returns on savings are equalized across world regions. The trade balance of different regions is thus determined endogenously, and reacts to trade policy shocks.
28 Note that analogous studies on EBA using GTAP have used different versions of the GTAP database. While UNCTAD (2001b) uses the pre-release 3 of the GTAP5 database, Trueblood and Somwaru (2002) use version 5.0.1. Further details on GTAP databases are found on the GTAP website: http://www.agecon.purdue.edu/gtap.
The 66 GTAP country definitions are aggregated into 18 regional groups. LDCs are disaggregated into Bangladesh, Malawi, Mozambique, Tanzania, Uganda, Zambia, and rest of sub-Saharan Africa (see Annex 1). Because of constraints in the available country aggregation from the GTAP5 database, in this scheme not all LDC countries benefit from non-reciprocal liberalization. In particular, Pacific and Caribbean LDCs are not included among the beneficiary countries. The same holds for the Asian LDCs other than Bangladesh (for example, Afghanistan, Bhutan, Cambodia, Myanmar) and some African LDCs (Angola, Lesotho). Conversely, some countries in rest of sub-Saharan Africa that are not LDCs (Cameroon, Côte d’Ivoire, Gabon, Ghana, Kenya, Nigeria, Seychelles) end up being beneficiaries in the used aggregations. For this reason (and others related to the assumptions of the model) the results should be seen as indicative of the order of magnitude of the effects of the EBA initiative.
The original 57 sectors available in GTAP5 have been aggregated into 21 new sectors (see Annex 1). Services and several manufactures are quite aggregated in the used sectoral classification, whereas goods intensively exported by LDCs (agricultural products, food, basic commodities and light manufacturing) are kept disaggregated.
The protection data contained in GTAP include applied MFN tariffs and the ad valorem
equivalents for non-tariff protection in agriculture and in textiles and clothing.29 For
agriculture, the protective power of specific duties and compound duties and
tariff-quotas is translated into ad valorem equivalents. In the case of tariff-quotas, the ad
valorem equivalent reported in the GTAP database is an average of the within-quota and
the out-of-quota rates.30
Since LDCs benefited from existing non-reciprocal preferential trading arrangements also before the implementation of EBA (associated, for instance, with the GSP or the Cotonou Agreement between the EU and the ACP countries), we have had to reconstruct this information in the GTAP modelling system (more later) and database that we use for the experiment. In particular, we have modified the basic protection data available in GTAP5 to take into account the pre-EBA preference margins available to LDCs in the EU market, using data from the UNCTAD TRAINS database. Applied MFN and preferential tariff data have been aggregated into the sectors we have defined for the simulations using world trade weights constructed from the UN COMTRADE
database.31 The ratio between preferential and MFN tariffs so obtained was then used to
compute LDC preference margins granted by the EU in each sector. These margins have then been used to update the protection data of the GTAP5 database. The EU protection data employed in the simulations are reported in Table 4.
29 Non-tariff protection in textiles and apparel takes often the form of voluntary export restraints administered by exporters under the Multi-Fibre-Agreement. In GTAP, this is modelled as a vector of ad-valorem export taxes.
30 A detailed description of the agricultural protection data in GTAP is available in Gibson, Wainio, and Whitley, Ch. 16.C of the Documentation on GTAP4 available at the website http://www.agecon.purdue.edu/gtap.
31 Only the lowest preferential tariffs available to LDCs has been selected to compute preference margins. Weights have been constructed using world trade flows instead of bilateral flows to avoid underestimation of preferential tariffs.
Several points are worth noting about the sectoral data. First, the EU MFN protection is concentrated in agriculture and food (with particularly high rates – between 50 and 200 per cent – in rice, sugar, cereals, dairy products and meat). Textiles and clothing receive also considerable MFN protection, with rates around 10 per cent. Second, prior to the EBA, imports of textiles and in manufacturing from LDCs enjoyed duty-free treatment, while in agriculture and food preference margins in favour of LDCs varied considerably across product categories. In dairy and meat products, vegetables and fruits, vegetable oils and fats and other food products preference margins are quite high, well above 50 per cent. Conversely, preference margins are very tight in rice, sugar and cereals.
While our policy experiment is similar to that of other studies mentioned earlier, the results cannot be fully compared across these studies for several reasons. First, the
beneficiary countries of the EBA initiative are all LDCs, whereas in Ianchovichina et al.
(2001) preferential market access is targeted to sub-Saharan African countries only. Second, the versions of the GTAP database used in the different studies differ (GTAP4
in Ianchovichina et al. 2001, GTAP5 pre-release 3 in UNCTAD 2001a, GTAP5.0.1 in
Trueblood and Somwaru 2002, and a modified version of GTAP5 in the present study) and the aggregation chosen by individually for countries and sectors from what is available in GTAP is not the same. Finally, the criteria followed to include pre-EBA
preferences for LDCs in the database differ between Ianchovichina et al. (2001),
UNCTAD (2001a) and the present study, whereas in Trueblood and Somwaru (2002) no account is given for the pre-EBA preference regime.
4.1.2 Simulation results
As one might expect, all beneficiary countries gain from the EBA initiative in welfare terms, while the donor (the EU) loses slightly from the initiative (Table 5). In theory, third countries may either lose or gain, depending on whether the degree of substitution
between the exports from these countries and those of the beneficiaries.32 Results show
in fact that some world regions stand to lose, while others gain. In the aggregate, the world the net gains from the EBA initiative are positive.
In absolute terms (equivalent variation in US$m) the biggest gain accrues to rest of sub-Saharan Africa, while the greatest loss occurs for the EU. Uganda and Bangladesh are the beneficiary countries whose gains are estimated to be the lowest. Among third countries, those that reap positive gains are the Rest of Developed countries (mainly Oceania and EFTA countries), Transition Economies and the Middle East. Conversely, NAFTA and Asian countries are those that suffer the biggest losses.
Overall, the policy shock points to an improvement in allocative efficiency, and this explains the gain at the worldwide level. Allocative gains are especially evident for LDCs. A shift towards agricultural goods and food production (which face the highest pre-EBA levels of protection in the EU) induces a better exploitation of comparative advantages in these countries. On the other hand, the EU loses in terms of efficiency,
32 The degree of substitution/complementarity of beneficiaries countries’ and third countries’ exports determines the sign and the extent of the terms of trade effects. Third countries can benefit from terms of trade effects provided that a complementarity relation prevails. See, for example, Bora et al. (2002) for a survey of the theoretical and empirical literature on preferential, non-reciprocal trade arrangements.
which may be interpreted as a typical consequence of trade diversion: the preferential liberalization targeted to LDCs displaces more efficient imports originating from third countries. However, the bulk of welfare changes for individual countries are associated with terms of trade effects. Not surprisingly, all beneficiary countries benefit from increased prices for their exports to the EU market and this causes an improvement in their terms of trade. Conversely, the terms of trade of the EU fall as a result of higher import prices from LDCs. As far as third countries are concerned, Japan and NAFTA countries incur a particularly strong negative terms of trade effect, while Middle East and China receive a considerable gain associated with an improvement in the terms of trade. In general, the welfare changes due to terms of trade effects are quite small for third countries. This is due to the fact that the world share of LDCs exports is too small for EBA to cause a significant negative twist in the terms of trade of competing exporters (see also Table 6).
As for aggregate export changes (Table 6), an increase is observed for all beneficiary countries (except Mozambique). Less intuitively, exports rise also for the EU. In the case of LDCs, after EBA resources are shifted away into the sectors which received the highest pre-EBA protection in the EU. Most of this factor flow occurs between import-competing industries and the sectors benefited from EBA. This explains the rise in aggregate exports from almost all beneficiary countries. To some extent, however, a process of resource allocation occurs also between alternative export sectors. In particular, some export industries for LDCs that do not benefit from EBA may contract. This is particularly the case for textiles and clothing from Bangladesh and services from Mozambique (see Table 8). This also explains why the exports from Bangladesh remain almost unchanged and those of Mozambique even fall on aggregate. As for the EU, the export increase is associated with resources shifting away from agriculture into export-oriented industries.
As for the sectoral effects of EBA, Tables 7 and 8 report, respectively, the percentage and value changes in exports by exporting country and industry. Looking at percentage changes the sectors in which it is concentrated the export increase of beneficiary countries are paddy rice, sugarcane, sugar and processed rice. In sub-Saharan African LDCs, sugar exports may even become ten times higher after EBA. In general, we also see that cereals and diary products become increasingly exported by beneficiary countries. The rise in vegetable and fruit exports is substantial only for Zambia, Bangladesh and the rest of sub-Saharan Africa, while that in meat and meat products is concentrated in Uganda and rest of sub-Saharan Africa.
In value terms, looking at the aggregate exports of LDCs (Table 8), the increase associated with EBA is very concentrated in sugar and sugarcane, which account by themselves for almost all the change in values. Bangladesh, seems to be the main exception, with its exports increasing mostly in other food and processed rice. The rest of sub-Saharan Africa has the most diversified change in exports, with relevant increases in sugar, processed rice, other food and vegetables and fruits.
Overall, results indicate that the EBA policy has a positive impact of LDCs exports and welfare, coupled with losses for the EU and third countries of a smaller magnitude. LDCs exports appear to increase by almost US$300m per year, nearly half a percentage point from the baseline value. Compared with those found in other studies, our simulations show smaller export and welfare gains for beneficiary countries. This is due to the fact that the database used is referred to a more recent benchmark (this is a
difference with respect to Ianchovichina et al. 2001, and UNCTAD 2001a) and because pre-EBA LDC preferences in the EU market are taken into account (a major point of departure from Trueblood and Somwaru 2002). As found in previous studies, the impact of EBA appears to be very concentrated in few sectors, in particular sugar and rice. It is important to stress that results from CGE simulations are subject to some major caveats. First, the analysis neglects important aspects of trade reform related to technology transfer, learning by doing and knowledge accumulation. In this respect, the model probably underestimates the impact of EBA on beneficiary countries. Moreover, the analysis refers to a long-run scenario, and adjustment issues are neglected. This maybe a serious limitation especially when analysing the economies of LDCs, normally characterized by structural rigidities. This may lead to a possible exaggeration of the effects of trade reforms. Finally, the model neglects institutional aspects that affect crucially the impact of preferential market access. Due to stringent rules of origin administrative procedures, some LDCs may not be able to take full advantage from the EBA policy. Simulations have instead been performed under the assumption that a good exported from a given country can always benefit from preferential treatment in destination countries, irrespective of the share of value added originating in the exporting country. Neglecting the role of rules of origin leads to an overestimation of the effects of the liberalization initiatives considered.
4.2 The Everything But Arms (EBA) initiative: is it really everything but (f)arms? Two major concerns were voiced during the adoption of EBA by the EU. The first related to the significant trade diversion effects that the EBA could potentially have on other developing countries, ACP countries in particular (Page and Hewitt 2002). The second warned against the impact of EBA on the European Union’s Common Agricultural Policy (CAP) and argued that, because of likely exclusions to avoid damage to EU agriculture, the EBA would in fact be ‘everything but farms’ (Rasmussen 2001). The CAP has provided an array of policy measures in support of domestic
agricultural production and EU farmers’ incomes.33 Domestically, the CAP introduced
various direct and indirect support measures, while on the foreign trade side, it is now based on complex and substantial tariffs and tariff quotas to reduce import competition attracted by high domestic prices, while export subsidies are used to dispose of domestic
production surpluses.34
In the past, several budgetary crises arose for certain products (grains, milk and sugar) as the CAP budget was too small to ensure attractive running (Weyerbrock, 1998). Budgetary problems also became an issue during the adoption of EBA. It was argued by many domestic producer groups that EBA, by eliminating tariffs and tariff quotas on products that are subject to CAP provisions, would increase imports to such an extent that it would make CAP support measures ineffective (Agra Europe 2001). Despite
33 The CAP comprises a series of general and sectoral arrangements for almost all agricultural products: arable crops, potato starch, cereals, olive oil, grain legumes, flax, hemp, silk worms, bananas, dried grapes, tobacco, seeds, hops, rice, meat and meat products, milk and milk products, wine, etc.
34 Quantitative restrictions and variable import levies were eliminated under the Uruguay Round Agreement on Agriculture, although some product re-classification closely mirrors the effects of variable levies.
these concerns, several factors suggest that the impact of EBA on European agriculture and the CAP budget will be, if not minimal, at least manageable. An impact study conducted by the European Commission on the effects of EBA on several agricultural markets shows that, depending upon the preliminary assumptions used, the extra-budgetary costs are between 1.5 and 2.6 billion Euro (EC 2000a). This would represent an increase by approximately 3 to 7 per cent of the 1999 CAP budget.
As the CGE analysis undertaken in the previous section has pointed out, both concerns seem to be exaggerated. In aggregate, the CGE results confirms expectations that the impact of the EBA will be concentrated in few sectors, sugar and rice in particular. However, the CGE results were qualified by a number of caveats that affect the results in both directions: over- and under-estimation of the EBA effects. Consequently, the current section seeks to expand the results obtained in the previous section and to address some of these caveats. The subsequent analysis will use a partial equilibrium framework to investigate the impact of the EBA at the most disaggregated level both in terms of products and countries, with a special focus on the three sensitive products included in the EBA: rice, sugar, and bananas.
4.2.1 The model, data, and scenarios
The model used to estimate the various effects of the EBA initiative is the SMART model. SMART is a simple ex ante partial equilibrium model, measuring the first-round
impact of trade policy changes.35 Unlike the general equilibrium analyses, the model
does not account for economy-wide effects of trade liberalization or inter-industry effects. However, the advantage of partial equilibrium models is the very detailed level of analysis. Working at this disaggregated level the SMART model allows considerable precision in identifying sensitive products and countries affected by the EBA.
The most important effects estimated by the model are the trade creation and diversion
effects. Trade creation effects capture the increase in imports by donor countries
(exports by beneficiaries) resulting from the tariff cut and the corresponding decrease in
domestic prices (which are assumed fully reflect the tariff changes). Trade diversion
measures the extent to which imports from preference-receiving countries will substitute current imports from third countries. Imports from alternative foreign suppliers are assumed to be imperfect substitutes and export supply elasticities are not assumed to be infinite (although this is a default value in the modelling system, as described below). To estimate the trade creation and trade diversion effects, the model uses a number of variables from different databases. For preferential market access liberalization (as in the case of EBA) the model uses applied tariff data for each trade regime applicable to different trade partners (applied MFN, GSP, GSP-LDC, ACP, free trade areas) in the
given market. Tariff data include both ad valorem and specific rates. For specific rates,
ad valorem equivalents are calculated for each of the EU trade regimes. These data are available from UNCTAD-TRAINS database, available online at
www.unctad-trains.org.36 In the model, the base rate is applied at the tariff-line level against
35 For a technical description of the model, methodology, data and uses see Laird and Yeats (1990). 36 UNCTAD-TRAINS (TRade Analysis and INformation System) is a comprehensive computerized
information system at the HS-based tariff line level covering tariff, para-tariff and non-tariff measures as well as import flows by origin for more than 100 countries.
individual partner countries. Bilateral import flows are available from UNCTAD-TRAINS database. The rate of utilization of preferences, used in one of the simulation
scenarios, comes from UNCTAD GSP database.37
The SMART model uses information on elasticities of import demand, export supply and substitution (between foreign suppliers – ‘Armington’ elasticities). Elasticities on import demand are gathered from a literature search, of which the primary source was
Stern et al. (1975) and the data has been subsequently updated with other more recent
information.
The scenarios included testing the impact of the EBA under different assumptions, taking into account the importance of LDC trade re-orientation, as suggested by other
studies.38 It is assumed that all LDCs benefit from duty-free and quota-free market
access, without taking into account other trade regulations that might impede their market access in the EU.
Scenario 1: no LDC trade re-orientation
Our first scenario of the EBA effects on LDCs, the EU and third countries assumes that LDCs are able to export all their products covered by the EBA with duty- and quota-free market access. This scenario also assumes that the improved market access in the EU will have no impact on trade flows between LDCs and third countries.
Scenario 2: LDC trade-reorientation
A shortcoming of most modelling approaches is their path-dependent logic. In particular these methodologies imply that the absence of trade flows between two partners in the base period, for example, because of the presence of a non-tariff measure or prohibitively high tariff, means that there will be no trade either in the estimated period. In the case of fairly aggregated CGE analyses, the likelihood of zero trade flows is low. However, in a very disaggregated analysis as the current one, for a significant number of products there are no current exports from certain LDCs to the EU. In such cases, despite the EBA initiative, the simulation results will show no improvement in the export performance of LDCs in these products.
One approach, which seems reasonable for looking at the EBA, is to circumvent this limitation by running a simulation using LDC exports to world markets rather than to the EU alone. The reasoning behind this simulation is that certain LDCs may face restrictions on their current access to the EU, but, under the EBA initiative, would be able to divert some of their existing exports from lower-priced markets to the EU to take advantage of the preferential margin introduced by the EBA and the substantial price differential between EU domestic and world prices (Table 9). An important example is sugar, where EU prices are 160 per cent higher than world prices. This sector will be looked at in greater detail in section 4.2.3.
37 For various reasons, including notably rules of origin and documentation requirements, all imports from a beneficiary do not necessarily enter at duty-free rates.
38 For a study that also takes into account the LDC utilization rates, rules of origin and other trade regulations contained in GSP schemes, see UNCTAD (2001b). On the possible re-orientation of LDC exports as a result of the EBA, see EC (2000a, b).
Therefore, Scenario 2 assumes that LDC exports to the world of products liberalized by the EBA will actually be re-oriented towards the EU, in order to take advantage of preferences and price wedges between EU domestic prices and world market prices. This will give an indication of the maximum trade effects to be expected from EBA on the short and medium term, without taking into account shifting of domestic production to exports or increases in total production capacity as a result of new investments. For sensitive products under a transition period of duty-free tariff rate quotas (sugar, rice, and bananas), this scenario estimates the impact of the EBA at the end of the transition periods.
For this scenario, since the latest data on LDC exports are not available for all LDCs, LDC world exports are approximated by ‘mirror data’, that is, world imports from LDCs. These data are available at the 6-digit HS level in the COMTRADE database. To ensure the comparability of results with the alternative scenario, trade data had to be further disaggregated at national tariff line level (10-digit in the case of the EU). In the absence of the relevant information, the procedure used was to assume that trade at 6-digit level is evenly distributed across national tariff lines within each 6-6-digit item.
4.2.2 Results (Figures 3–15 and Tables 10, 11 and 15)
Although the EBA extends duty- and quota-free market access for LDCs in more than 900 tariff lines, the SMART estimates from Scenario 1 suggest that, based on current exports, LDC will be able to take advantage of this enhanced market access for only 124 products at tariff line level. Under more optimistic assumptions that LDCs will be able to shift existing exports from third countries to the EU market (Scenario 2), the number of products (at tariff line level) that are likely to benefit from the EBA rises to 622. The expected increase in sugar exports is by far the most important to emerge at the end of the transition period. The results from Scenario 1 (Figure 3) suggest quite clearly that EBA rather than being ‘everything but arms’ could be better labelled ‘nothing but sugar’.
Our estimates also show that only a handful of LDCs would see total trade at tariff line level increased by more than US$100,000, which is a combination of trade creation and the trade diversion effects, positive or negative, as the case may be (Figure 4). Malawi, the biggest winner, stands to increase its cane sugar exports by more than US$ 25 million. Other African LDCs (Madagascar, Tanzania, Zambia) are likely to see their cane sugar exports increase by between US$5 and 10 million. The only Asian LDC that shows exports increases at tariff line level by more than US$100,000 is Myanmar. The SMART estimates also suggest that Sudan is likely to see significant increases in its exports of molasses (product code 1703) and cereals (grain sorghum, product code 1007).
Unsurprisingly, the largest losers from negative trade diversion, in absolute values, are the current major ACP sugar exporters (Mauritius, Aruba, Fiji, Guyana). There is also a relatively large loss from trade diversion for the United States in grain sorghum (product code 1007009) (Figure 5). However, two of the sensitive sectors identified by the EU (rice and bananas) do not seem to face particularly large trade effects, compared to sugar (Figures 6–8).
The SMART estimates suggest that, in the case rice exports, apart from modest export increases in certain rice products for Madagascar, Lao PDR, and Mozambique, other
LDCs will not have any likely improvements in their market shares in the EU. This moderate increase in rice exports from LDCs seems to come at the expense of current rice exports from Thailand and United States (Figure 7). A similar analysis for bananas suggests that the largest total trade effect is likely to occur for Rwanda (US$147,000), while the reductions in current exports through trade diversion would be fairly evenly distributed between Latin and Central American producers (Costa Rica, Ecuador, Colombia, and Panama) (Figure 8).
Once the possibility of reorientation of LDC exports from third markets to the EU is taken into account (Scenario 2), the EBA shows a more diverse potential impact of the patterns of LDC exports to the EU. Apart from sugar and molasses – which remain key – live sheep, sheep meat, powder milk and cream, bananas, maize, broken rice, grain sorghum, wheat flour, and rum and tafia are other products in which relatively high export changes can occur. Two other important products for LDCs, apart from sugar, are wheat bran (product code 230230100) and broken rice (1006400010). Tables 10 and 11 provide a breakdown by LDCs of the trade creation and diversion effects, ordered by the size of their initial imports. In the case of wheat bran, Congo, Dem. Rep. and Tanzania appear to benefit the most from the EBA provisions. For broken rice, Togo and Niger seem able to almost double their current exports, should a trade reorientation occur and EBA provisions permit such a steep increase in imports of rice from LDCs. In terms of beneficiary countries, Sudan emerges as the largest winner with a relatively large variety of products (sugar, cereals, live animals), followed by Malawi and Mozambique, which remain largely dependent on their increases in sugar exports. Overall, however, the number of beneficiary countries that manage to increase their exports substantially at tariff line level increases significantly. Fourteen LDCs are able to reap overall positive trade effect bigger than US$500,000. Sudan, Tanzania and Niger have relatively more diversified trade effects, while Nepal and Congo, Dem. Rep. are likely to benefit from significant trade effects in only one tariff line. Somehow surprising is the modest presence of Asian LDCs among the major beneficiaries of the EBA. Previous studies have identified Asian LDCs as those that enjoy less favourable market access than ACP LDCs and, by this token, EBA should have brought theme relatively more gains. However, the only Asian LDC that seems to benefit substantially from EBA is Myanmar.
Also, under Scenario 2, the list of negatively affected countries also becomes more diverse than under Scenario 1. Apart from ACP countries negatively affected in their sugar exports, other preference-receiving countries (for example, Hungary, Romania and Poland) appear as net losers from trade diversion, particularly in live animals. However, if one takes into account the indirect protection on vegetables, fruits, meat and diary products as well as other food products introduced by complex sanitary and phytosanitary measures – by many LDC standards – that their exports must meet before entering the EU, the increase in LDC exports for processed agri-food products may well
turn out to be smaller than our estimates.39
39 See for instance the case of shrimps exports from Bangladesh provided in UNCTAD (2001a: 108-109).
4.2.3 Sensitive products: the special case of sugar
As the results of both CGE and partial equilibrium analysis have showed, it is quite unrealistic to expect EBA to have a major impact on the volume of imports into the EU market, at least on the short term. However, since certain impact studies including EU (2000a, 2000b) have predicted, the scale of LDC export growth based on a reorientation of their world export towards the EU, some EU producers and non-LDC developing countries (in particular non-LDC ACP countries) have been alarmed by the potential effects of EBA. It is thought that the impact of EBA could be significant for competitors, particularly if LDCs exports were concentrated in products of particular sensitivity or in intricately regulated EU markets. This may be the case with sugar. Indeed, the greatest concern about EBA has been expressed so far by EU sugar
producers and the main ACP sugar exporters.40 Both are concerned that LDC exports
may displace their own production, but the fears of the ACP seem much more soundly based. In order to assess the real magnitude of these concerns, this section provides some additional insights on the issue, including the mechanisms regulating the EU sugar
regime.41
Firstly, it focuses on the way the EU market for sugar is functioning in terms of domestic production, exports and imports. As the EBA sugar adds a further element to an already complex system, in the transitional period (2001-2009) it is expected to activate some internal adjustments that could affect the other components. Secondly, it gives a closer looks at the results of the simulation for LDC sugar following the transitional period, that is, after 2009. These findings, together with the current patterns of LDCs sugar exports should provide some additional understanding of the existing evidence.
The EBA and the EU market for sugar
The EU market for sugar is perhaps one of the most outstanding examples of extensive market regulations and state intervention aimed at ensuring high and stable prices for sugar producers and refineries. The main elements of the Common Market Organization of Sugar (CMOS) relevant for our purposes are:
– Domestic production quotas(divided in sugar quotas A, B and ‘sugar C’);
– The intervention price acting as a minimum guarantee price (through Paying and
Intervention Agencies);42
– Export refunds or subsidies;
– Import duties and preferential imports.
40 See for instance the impact study carried out by the Sugar Traders Association of the United Kingdom, available online at http://www.sugartraders.co.uk/eba_impact_study.pdf.
41 For a more detailed analysis on the EU sugar regime and its impact on developing countries, see Oxfam (2002).
42 Each member States has a national Paying and Intervention Agency to collect levies (from production), to pay the support price, to give export refunds and other functions.