S
omething about data seems to remind peo-ple of water—lots of it. Here and there what’s happening with data might inspire an organic metaphor (mushrooming) or one related to chemical force (explosion), but mostly it’s all about water: fl ood, deluge, tsunami, ocean, fi re hose. These not very tranquil associationssummon up a few notions of how institutions might be responding to the emerging data en-vironment. We wondered if our respondents were surfi ng the data wave (moving easily and skillfully over it), swimming in it (working hard to make progress), or drowning in it (here the meaning is self-evident).
3
The Data Management
Environment
The more the data banks record about each one of us, the less we exist.
—Marshall McLuhan
Key Findings
Institutions reported increases over the past 12 months (mean near 4 on a scale of 5) in the volume of every kind of data we asked about. Learning management systems data and e-mail were the data types with the highest mean increase.
Respondents generally agreed that they have the infrastructure they need to manage various kinds of institutional data; one exception is video/audio content available online, for which responses were neutral, on average. Views of data infrastructure capability three years in the future were more positive than those for current capability.
Total disk storage capacity managed by central IT is expected to grow fast; the median anticipated growth rate for the 12 months following the survey was 20%.
Respondents were only neutral, on average (near 3 on a scale of 5), when asked whether their institution’s identity management capabilities permit suffi ciently granular user access to data. We found modest growth in the use of role-based authorization between 2005 and 2009. Federated identity was operational or being implemented by only about one institution in fi ve, and it was disproportionately confi ned to research institutions.
Leading drivers for data management investment were improved data security and regulatory compliance, followed by improved operational effi ciency and enhanced data-driven decision making. The overwhelmingly highest-ranked barrier was lack of funds, followed by lack of staff expertise and decentralized institutional culture. u
u
u
u
To distinguish between those circum-stances and to sound the depths of insti-tutional data management (and here the metaphors will stop for a while), we collected a variety of subjective and objective measures about such basic factors as how fast various kinds of data are growing, how much storage institutions are managing, what drivers and barriers influence investment in data manage-ment, and how effectively respondents think their data infrastructures can manage assorted kinds of data.
Data Growth: Volume
and Variety
Some kinds of data have been with us for a long time, especially structured business data such as student records, personnel files, and accounts payable and receivable. Other kinds, particularly unstructured data such as web content and digital video and audio, are relatively new. We wondered whether our respondents were experiencing data growth at different rates for different kinds of data, so we asked them to characterize how the volume of various sorts of data had changed at their institutions in the 12 months prior to our survey. Though we specified that we were referring to data as measured in bytes, we used a subjective scale ranging from greatly decreased (1) to greatly increased (5).
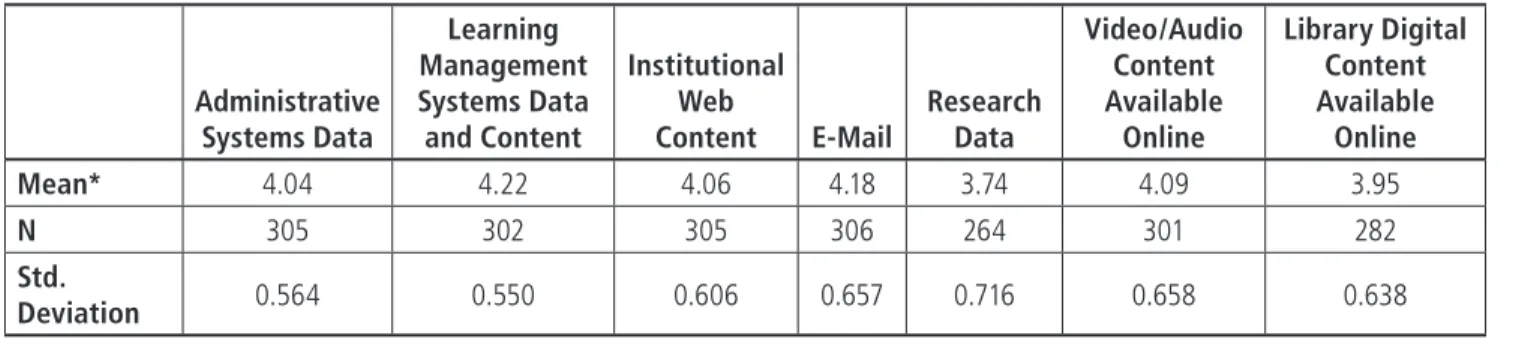
Big differences between types of data? Actually, similarity rather than disparity characterized our results. As Table 3-1
shows, respondents on average reported a level between 3.95 and 4.22, pretty close to “increased,” for every kind of data we named except research data (3.74). This exception was mainly due to differences between research and teaching institutions. Research-oriented institutions averaged 4.27, whereas teaching-oriented institutions aver-aged 3.52—considerably lower, though still indicating some research data growth.1 Other
than this, we found little relationship between reported growth in the different kinds of data on the basis of demographic factors such as Carnegie class, institution size, and public/ private control.
Perhaps driven by the growing use of rich media in online learning, learning manage-ment systems data and content was on average the highest-growth data type among institutions overall, though e-mail growth was very close, and the difference between the two types is probably not meaningful. These two types of data had the highest percentages of “greatly increased” responses, at 28.1% and 30.7% respectively. Majorities of respon-dents reported increased or greatly increased volume for every data type, and in no case did even 2% of respondents report a decrease in volume in any data type.
Virtually all of our qualitative interviewees noted rapid data growth at their institutions, though they varied in their estimations of where it was growing fastest. It seems that scenarios for growth are unfolding in just
Table 3-1. Change in Volume of Institutional Data in Past 12 Months
Administrative Systems Data Learning Management Systems Data and Content Institutional Web
Content E-Mail Research Data
Video/Audio Content Available Online Library Digital Content Available Online Mean* 4.04 4.22 4.06 4.18 3.74 4.09 3.95 N 305 302 305 306 264 301 282 Std. Deviation 0.564 0.550 0.606 0.657 0.716 0.658 0.638
about every type of digital information. The online-learning-related growth prominent in our survey results is evident at Bates College. Gene Wiemers, vice president for Information and Library Services, noted that Bates has “a mature environment for administrative computing,” whereas “the growth really has been in our course management system.” One major source of learning-related growth is faculty and student use of video, which has led Bates to set up protocols for storage and retrieval of video files in student labs. Clinton Smullen, director of Academic and Research Computing Services at the University of Tennessee at Chattanooga, has observed a similar connection. “Faculty members are adding media elements to their coursework,” Smullen said. “It’s the most rapidly growing part just because the files are so large.”
At Arizona State University, on the other hand, “traditional business data is still the fastest-growing area,” said John Rome, asso-ciate vice president for University Technology. Growth in the student population is one reason, he noted, but he also has seen a trend toward “data coming into central IT that was previously kept and managed locally.” And research data is “exploding” at Brown University, said Terri-Lynn Thayer, assistant vice president and deputy CIO. “Instruments are producing data in unprecedented volumes, so that it’s not just a question of storage but of how to ever find what you’re looking for again.” Brown has recently partnered with IBM and a number of research entities to create a high-performance computing cluster with half a petabyte of storage in order to provide a centrally managed location for research data; in addition, Brown’s library is spearheading a digital repository initiative. At other institutions, interviewees mentioned e-mail archiving, document imaging, and other kinds of content digitization as dominant areas of data growth.
Data volume, in short, is increasing across the board. Does this mean, then, that our
respondents are struggling to provide the infrastructure that today’s data environment demands? Our qualitative interviewees frequently said that they were and reported various initiatives to add more storage. Jack Rutt, director of Information Systems at Eastern Mennonite University, noted that a recent ERP implementation and growing use of digital media have dramatically increased pressure on the university’s storage infrastruc-ture. “We got a storage network three years ago and at that time projected a three-year life,” Rutt said. “After a year and a half, we already had to add more storage.” At the University of North Texas, acting vice president for information technology and CIO Maurice Leatherbury complained, “We’re spending an extra several hundred thousand dollars annu-ally to buy storage. I’m not sure how long this rate of spending can be sustained.”
Our quantitative results, however, suggest that most respondents felt that their institu-tions are meeting the challenge, at least when it comes to infrastructure. When we asked whether they agreed that their institutions currently have the infrastructure needed to effectively manage each kind of data and then asked whether they agreed their institutions would have it in three years, respondents were generally positive about the present and slightly more so about the future (see Figure 3-1).
Mean agreement regarding current infra-structure was above the midway point between neutral (3) and agree (4) for every type of data we asked about except video/audio content available online and research data. The online video/audio item seems to be creating more infrastructure challenges than other kinds of data: 40.5% of respondents disagreed or strongly disagreed that their institutions had the needed infrastructure. The next highest item in combined disagreement was research data (22.5%). As with our findings regarding research data volume growth, the research data infrastructure item was associated with
institutional mission: Teaching-essential insti-tutions agreed more strongly (mean 3.41) that they currently have the needed infrastructure than did research-essential institutions (2.63). Balanced research/teaching institutions and those where teaching is favored but research is also rewarded had similar means in between (3.24 and 3.25, respectively).
The results for institutional infrastructure in three years correlate to those for the present but are higher, in every case exceeding the midway point between neutral and agree. The outlook for online video/audio was especially optimistic: In contrast with the 40.5% of respondents who disagreed or strongly disagreed about having the needed infrastructure in the present, only 14.5% felt the same looking ahead three years. Similarly, the 22.5% combined disagreement about research data in the present fell to less than half that figure (10.7%) for the three-year
question. Interestingly, research and teaching institutions did not differ significantly in their agreement on the three-year infrastructure questions.
Our respondents, then, reported an increase in all varieties of data, and extra pressure in some, but they don’t seem to feel they are losing control of the situation, at least to the extent that infrastructure influences effective data management. Infrastructure, however, may not be where the most serious challenges lie. After all, increases in storage density have reliably kept pace with Moore’s law over the years, while our understanding of how to integrate, document, search, secure, and interpret data has been far more uneven, and what we do know is often hard to apply in an organizational context. “My problem is not the fastest-growing data type, but the interconnection between the data,” said Marc Hoit, vice chancellor for IT and CIO at North
3.84 3.77 3.78 3.65 3.24 3.02 3.52 4.08 4.02 4.02 3.97 3.56 3.64 3.77 1.0 2.0 3.0 4.0 5.0 Administrative systems data (N = 298) LMS data and
content (N = 292) content (N = 297)Institutional web (N = 296)E-mail Research data(N = 261) Video/audio contentavailable online (N = 282) Library digital content available online (N = 277) Type of Data Mean* Now In three years Figure 3-1. Institution Has Infrastructure to Manage Institutional Data, Now and in Three Years
Carolina State University. “So much of this data is siloed and not integrated, and where it’s duplicated, it’s not in sync.”
Central IT Disk Storage
Capacity and Growth
So far, we’ve looked at subjective evalua-tions about changes in the volume of different kinds of data and institutional data manage-ment infrastructure. We also asked for three more concrete measures: the total capacity of disk data storage (in terabytes) managed by central IT (not including PCs), the percentage of that total managed by central IT on behalf of institutional researchers, and how much the total was expected to grow in the next 12 months.
Most institutions reported totals that, although stupendous by historical standards, were not enormous by the measure of modern device capacity. About half of institutions (47.0%) reported a total central-IT-managed capacity of 20 terabytes or less, and half of these reported 10 terabytes or less (see Figure
3-2). Another 12.8% reported 51 to 100 tera-bytes, while 14.7% gave responses of more than 100 terabytes. Perhaps reflecting the complexity of central IT data operations, our capacity question yielded an unusually high 7.0% “don’t know” response.
As Figure 3-3 shows, we found varia-tions by Carnegie class that help explain the somewhat bimodal distribution of Figure 3-2. Doctoral institutions reported much higher capacity than did the other Carnegie classes: more than half of them (52.9%) reported 101 terabytes or higher. By contrast, majorities of all the other Carnegie types reported a total capacity of 20 terabytes or less. (These Carnegie results do not include “don’t know” responses, which came from all Carnegie types.)
In a follow-up question, we asked about the percentage of total disk capacity managed by central IT on behalf of institutional researchers. A high proportion of “don’t know” responses (28.6%, mainly from teaching-oriented institutions) suggests that
23.8 23.2 8.7 4.7 5.0 12.8 11.7 3.0 7.0 0% 5% 10% 15% 20% 25% 30% 0–10
Disk Capacity (Terabytes)
Percentage of Institutions Don't know Over 1,000 101–1,000 51–100 41–50 31–40 21–30 11–20 Figure 3-2. Total Capacity of Disk Storage Managed by Central IT (N = 298)
the question was either hard to answer or not applicable for many respondents. Among the remainder, however, it was clear that central IT is managing substantial research data assets on behalf of researchers. Among research-oriented institutions, respondents reported an average 15.2% and median 10.0% of total capacity under such manage-ment. Teaching-oriented institutions were managing quite a bit less, with a 6.5% mean and a 2.0% median.
These figures suggest that many researchers find sufficient advantages to central IT management of resources, such as environmental and system administration economies, to give up their traditional do-it-yourself autonomy. The results are consistent with findings in several ECAR research studies reporting an increasing role by central IT in research storage, especially at research-essen-tial institutions.2 One driving factor may be
the growing role of digitization in disciplines relatively less experienced in large-scale data system management. “It used to be that those most in need of computing solutions were in physics and engineering,” said Brown’s Thayer. “Now there is a ton of stuff coming from the biomedical and life science areas and fields like geology—disciplines whose science and instrumentation didn’t previously need this amount of data storage, and that don’t already have the infrastructure to take care of it themselves in the way those other disciplines do.”
Respondents reported substantial expecta-tions of growth in their central IT disk storage needs in the next year (see Figure 3-4). The most common single growth figure reported was 10% (66 respondents), and putting aside the small number of respondents anticipating either a decrease or growth greater than 100%, responses averaged 22.7%, and the median
17.6 15.7 43.1 55.6 18.5 68.9 0.0 20.9 13.7 4.9 3.7 17.3 4.9 8.2 18.0 9.8 0.0 60.5 7.0 11.6 0% 10% 20% 30% 40% 50% 60% 70% 80% 0–20 Tb (N = 122)
Disk Capacity (Terabytes)
Percentage of Institution s DR MA BA AA Over 1,000 Tb (N = 9) 101–1,000 Tb (N = 31) 51–100 Tb (N = 32) 21–50 Tb (N = 42) Figure 3-3. Total Capacity of Disk Storage Managed by Central IT, by Carnegie Class
anticipated growth was 20.0%. Growth is a widespread and undifferentiated phenom-enon: We didn’t find any significant patterns by Carnegie class, FTE enrollment, or mission, nor did we find any association between the reported current total capacity of central-IT-managed disk storage and expected growth. Among the small outlier group of respondents reporting greater than 100% expected growth, five were research-oriented and seven were teaching-oriented institutions.
With many institutions anticipating central IT disk storage capacity growth in the neigh-borhood of 20% in a single year, and some quite a bit more than that, it seems clear that however confident respondents may be about their institutions’ data infrastructures, they face a challenge in building out their raw capacity.
Identity Management
The sheer growth of data and its related storage infrastructure, however, isn’t all that institutions must confront. Flexible and secure identity management lies at the heart
of a secure and effective data environment. Identity management “has all sorts of relations to data management,” said Steve Gallagher, CIO at the University of San Francisco. “It’s key to ensuring that you’re exposing appro-priate data to approappro-priate people. Even more important is ensuring that you cut access to people at the time of employee separation or job change.”
Our survey asked about respondent adop-tion of several technologies related to identity management:
enterprise directories, directory services capable of including all persons affili-ated with the institution and usable by multiple applications;
automated role- and privilege-based authorization (or more simply role-based authorization, abbreviated here as RBA), systems that give access to electronic resources using privileges or permissions derived automatically from affiliations and groups; and
federated identity solutions, automated management of identity information u u u 0.3 3.0 30.3 22.0 14.3 5.0 10.0 3.0 4.0 8.0 0% 5% 10% 15% 20% 25% 30% 35% 40% Needs will decrease 0% Estimated Increase Percentage of Institution s Don't know Over 100% 51–100% 41–50% 31–40% 21–30% 11–20% 1–10% Figure 3-4. Estimated Increase in Central IT Disk Storage Needs in Next 12 Months (N = 300)
0
between a campus and other insti-tutions or organizations to facilitate collaborative or business initiatives. We present our findings about the adop-tion and use of these technologies below. Thanks to a previous ECAR survey on identity management that was fielded in 2005, we were able to compare some of our 2009 results with earlier ones.3 Where we do so,
we restrict our analysis to the 116 institutions that responded to both surveys.
Adoption of Identity
Management Technologies
We found a robust and active identity management environment on our respondent campuses, but one still largely focused on internal capabilities rather than extra-institu-tional outreach.
The most mature of the three technologies we asked about is enterprise directories, and not surprisingly it was the one most frequently reported (see Figure 3-5). Altogether,
two-thirds (66.0%) of respondents said their institutions were either in the process of implementing an enterprise directory or had one partially or fully operational. Enterprise directories were somewhat more prevalent among research-oriented institutions, but small majorities of teaching-oriented institu-tions reported one of these statuses as well. Role-based authorization was somewhat less common, with 54.6% either imple-menting or operational; about half of these said they were partly operational, which was the most common RBA status reported. We found no significant associations between RBA adoption and Carnegie class, FTE enroll-ment size, or mission.
By contrast, federated identity solutions remain relatively marginal and are strongly associated with institutional size, research/ teaching mission, and Carnegie class. Overall, only one in five institutions (19.8%) reported in-progress implementation or partial or full operation of federated identity solutions,
11.4 30.4 14.4 28.8 12.7 35.3 30.1 7.8 4.2 11.8 4.9 6.5 10.8 24.2 13.1 6.2 12.7 12.1 7.1 7.8 7.8 0% 5% 10% 15% 20% 25% 30% 35% 40% Not
considering won’t start within Planned, but the next 12 months
Plan to start within the next 12 months
Implementation
is in progress operational Partially
Percentage of Institution
s
Enterprise directory (N = 306) Role-based authorization (N = 306) Federated identity solution (N = 309)
Fully operational Currently evaluating Figure 3-5. Extent Considering/ Implementing Identity Management Technologies
and federated identity had by far the highest proportion of respondents (35.3%) who were not considering the technology. The bigger and more research-oriented the institution, the more likely it was to adopt the technology. Among doctoral institutions, 44.1% reported either implementing federated identity or having it partially or fully operational, versus 17.6% for MA institutions and less than half that for BA (6.2%) and AA (8.7%) institutions. As Figure 3-6 shows, Shibboleth was by far the most popular federated identity solu-tion reported by institusolu-tions that were either implementing or had an operational solution, though substantial proportions reported SAML 2.0 or other solutions.
Identity Management
Technologies, 2005–2009
Comparing 2009 with 2005 identity management survey results suggests a degree of growth in the less mature areas of identity management during the past four years. Among the 116 institutions responding to both surveys, enterprise directory adoption
remained flat, with no significant difference between the 73.0% reporting in-progress implementation or operation in 2009 and the 69.5% in 2005. Given the relative maturity of enterprise directories, this is not surprising; institutions have had a long time to settle on an enterprise directory strategy.
There was, however, significant growth in the prevalence of role-based authorization among the 2005/2009 survey respondent institutions. As Figure 3-7 shows, the total proportion of institutions reporting in-progress implementations or partial or fully operational RBA rose from 37.4% in 2005 to 55.7% in 2009. All of the difference in these statuses came from higher reported rates of implementation in progress or fully operational RBA, rather than from partially operational RBA.
It’s harder to state definitively that we saw an increase in federated identity solutions, because this technology was so new in 2005 that we didn’t ask about it in the same detail as in 2009. However, a rough comparison for which we cannot claim statistical significance
48 14 15 0 10 20 30 40 50 60 Other SAML 2.0 Shibboleth Number of Institution s Figure 3-6. Federated Identity Technologies in Use (Institutions Implementing or Operating Federated Identity Technologies, N = 77)
2
suggests a degree of growth has occurred. Only 14.0% of 2005/2009 responders told us in 2005 that their institutions were implementing Shibboleth, Liberty Alliance, or another federating technology. In 2009, among the same institutions, 16.3% reported partially or fully operational federated identity solutions (overwhelmingly Shibboleth), and another 8.6% said they had implementations in progress. Although this suggests some progress has been made, it’s still striking that the key technology enabling extra-institutional authentication and authorization remains so narrowly implemented.
Granularity of User Data Access
One of the primary purposes of identity management tools is to assemble the infor-mation and rules necessary to ensure that users and data are properly matched—to permit employment records, for example, to be available to HR staff but not to accounts
payable staff who have no legitimate need to see them. Creating a system sufficiently refined to authorize accurately and reliably can be a challenge.
On the whole, our respondents were less sanguine about their institutions’ identity management capabilities for providing suffi-ciently granular user data access authoriza-tion than they were about their instituauthoriza-tions’ having the infrastructure needed to effec-tively manage different kinds of data (see Figure 3-8). Their agreement about having a sufficient capability averaged an almost exactly neutral response (3.03, SD = 1.008), and combined disagreement (35.5%) was not much less than combined agreement (40.4%).
These patterns of agreement and disagree-ment were broadly generalized. We found no significant differences based on Carnegie class, FTE enrollment size, public/private control, or institutional mission. Though
Figure 3-7. Extent Considering/ Implementing Role-Based Authorization, 2005 and 2009 (Institutions Responding to Both Surveys) 15.7 29.6 12.2 5.2 6.1 27.0 4.3 11.3 15.7 6.1 11.3 13.0 15.7 27.0 0% 5% 10% 15% 20% 25% 30% 35%
Not considering Planned, but
won’t start within the next 12 months
Plan to start within the next
12 months
Implementation
is in progress operational Partially
Percentage of Institution s 2005 (N = 115) 2009 (N = 115) Fully operational Currently evaluating
institutions at more advanced stages of adoption of enterprise directories and RBA tended toward higher agreement that their institutions had sufficient granularity of access, the difference was very modest for enterprise directories, and for RBA the differ-ence was most evident among the relatively small percentage (12.7%) reporting fully operational RBA systems.
Interviews suggest that much of the challenge of refined data access lies in the variety of data elements that bear on access rules and the frequency with which the rules and data values can change. Georgia State University, for example, has a “reasonably good” identity management system, said J. L. Albert, associate provost and CIO, thanks to an LDAP-based identity vault that manages pertinent identity information and feeds Active Directory in near-real time. “The big issue is having all of the right attributes of data in it for building workflow,” said Albert. “There are still some issues about having the right pieces of data in the right locations and
having somebody responsible for keeping them current. The issue is made more complex by individual identities with multiple roles.” The University of San Francisco’s Gallagher also noted an issue with the applications that consume services from the identity infrastruc-ture. At USF, he said, “the granularity is there at the core level, but the various spokes and the different integration points, especially third-party services, handle different levels of granularity.”
Data Management
Drivers and Barriers
Reasons why institutions might invest in data management vary: to keep data secure, to get more value out of it, to deliver new services, or to make IT systems more integrated and efficient. Overall, “safety first” seems to be the principle most often driving data management investment at our respondent institutions, followed by efforts to promote better business results in the major units of the institution.
Figure 3-8. Identity Management Provides Sufficiently Granular Data Access Authorization (N = 307) 5.2 30.3 24.1 37.1 3.3 0% 5% 10% 15% 20% 25% 30% 35% 40% 45% Strongly disagree Percentage of Institutions Strongly agree Agree Neutral Disagree
We asked respondents to choose up to three primary drivers (from a list of 11 items) for data management investment at their insti-tutions. By a considerable margin, improved data security was the item most often chosen, named by 6 in 10 respondents (see Figure 3-9). Another security-related item, regulatory compliance, was chosen by 4 in 10, making it the second most chosen driver.
If the top two items both seem to be related to data (and professional!) safety, the next two both spoke to making better use of data for institutional purposes. In each case, about a third of respondents chose improving business/academic unit operational efficiency and enhancing data-driven decision making, placing these two related items close together behind the security and regulatory items. The contrast between the relatively high rate of selection for these items and the bottom-ranking two items—teaching/learning support and research support—suggests that institu-tions are being driven more by a traditional “business intelligence” conception of data management than by more innovative uses
relating to instruction and research. At the same time, business purposes seem to trump purely IT-related items, which fell in the lower range of responses.
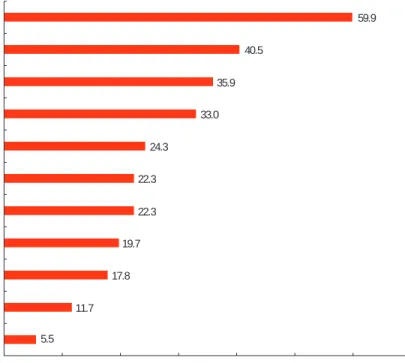
Finding any pattern in the barriers to investing in data management that our respondents reported (choosing up to 3 primary barriers from our list of 11 items) is more difficult. The standout barrier was lack of funds (see Figure 3-10), named by 69.9% of respondents. The fact that our survey was in the field in early 2009, during the spreading financial crisis and recession, may help explain why this figure was so high, though lack of funds is a perennially top-ranking item in ECAR results relating to IT initiative barriers. The next-highest (but much less frequently chosen) items were basically an even split between lack of staff expertise (34.0%) and a decentralized/informal insti-tutional culture (33.0%), though a number of other items in the middle ranks, such as the difficulty of developing campus policies and procedures (27.2%) and resistance from data owners (16.2%), suggest that basically
Figure 3-9. Drivers for Investing in Data Management at Institution (N = 309) Research support Teaching/learning support Support new applications/systems Improve IT operational efficiency Respond to external accountability/performance requirements Align with institutional strategic goals Improve user access to data Enhance data-driven decision making Improve business/academic unit operational efficiency Regulatory compliance Improve data security
5.5 11.7 17.8 19.7 22.3 22.3 24.3 33.0 35.9 40.5 59.9 0% 10% 20% 30% 40% 50% 60% 70% Percentage of Institutions
cultural issues such as organizational stove-piping, decentralization, and institutional inertia may be bigger barriers overall than lack of expertise.
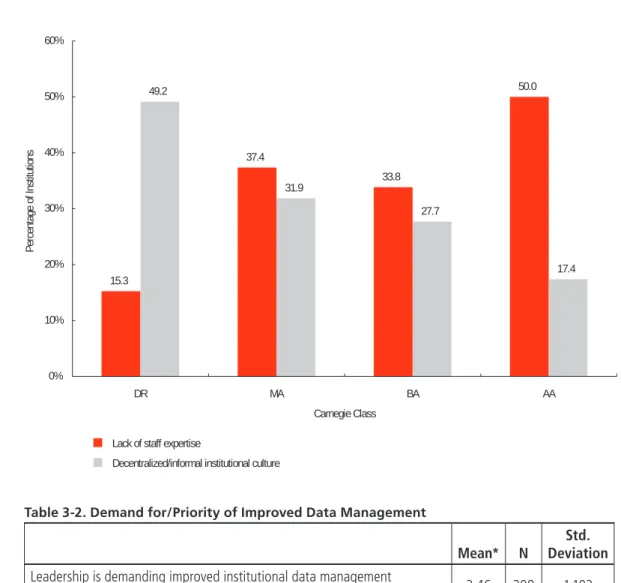
Barriers relating to expertise and culture are not mutually exclusive, but we found some evidence that different kinds of institutions struggle more or less with each. The very things that make data management exper-tise harder to develop and staff at simpler institutions—flatter organizational structures, leaner IT units, and relatively more focus on basics—may help minimize cultural obstacles, whereas at more complex institutions, exper-tise may be more abundant but bureaucracy and inertia proportionately greater. As Figure 3-11 shows, associate’s institutions were much more likely than doctoral institutions to report lack of expertise as a barrier, whereas doctoral institutions were much more likely than associate’s to report decentralized or informal institutional culture. Master’s and baccalau-reate institutions tended to fall between the other Carnegie types on both measures.
Organizational Context
We noted above that after security and regulatory issues, improved operational effi-ciency and supporting data-driven decision making were the top drivers for investing in data management. We found supporting evidence along the same lines by asking our respondents whether they agreed that leaders and users were demanding improved institu-tional data management capabilities. Slight majorities agreed or strongly agreed about each group, and mean agreement was in each case just about halfway between neutral and agree (see Table 3-2). Respondents were slightly more strongly in agreement as well that improved institutional data management was a strategic priority.
Exactly two-thirds of our respondents (66.7%) told us that their institutions had either a stand-alone IT strategic plan or one integrated into an institutional strategic plan. We found no differences in agreement about the demand for or priority of improved institutional data management between
Figure 3-10. Barriers to Investing in Data Management at Institution (N = 309) 0% 10% 20% 30% 40% 50% 60% 70% 80% 5.2 Other 8.1 Structure of funding incentives
13.6 Lack of guidance from institutional
strategic objectives
15.5 Lack of institutional
leadership support
16.2 Resistance from data owners
18.1 Decentralized nature of
the data to be managed
18.8 Current data practices
are "good enough"
27.2 Difficulty developing campus
policies and procedures
33.0 Decentralized/informal
institutional culture
34.0 Lack of staff expertise
69.9 Lack of funds
Table 3-2. Demand for/Priority of Improved Data Management
Mean* N DeviationStd.
Leadership is demanding improved institutional data management
capabilities. 3.46 309 1.103
Users are demanding improved institutional data management capabilities. 3.48 309 1.021 Improved institutional data management is a strategic priority. 3.68 309 0.983
*Scale: 1 = strongly disagree, 2 = disagree, 3 = neutral, 4 = agree, 5 = strongly agree
Figure 3-11. Selected Barriers to Investing in Data Management, by Carnegie Class (N = 261) 15.3 37.4 33.8 50.0 49.2 31.9 27.7 17.4 0% 10% 20% 30% 40% 50% 60% AA BA MA DR Carnegie Class Percentage of Institutions
Lack of staff expertise
Decentralized/informal institutional culture
institutions that did and those that didn’t have such a plan. However, among those reporting a plan, those saying that the plan explicitly addressed data management issues reported significantly higher agreement on all three of the demand/priority items.
We did not find respondent institutions heavily endowed with offices or governance bodies related to data management (see Figure 3-12). A slight majority (55.4%) said that their institution has a central IT group for data (including, for example, data architects), but such a group was twice as prevalent as the
other two entities we asked about, an institu-tional data policy office or an IT governance committee dedicated to data issues. Though larger institutions were more likely to report a central IT group for data than smaller ones, the association was a modest one, and we found no differences based on Carnegie class or FTE enrollment for the other data manage-ment entities.
None of this necessarily means that insti-tutions lacking dedicated data management entities entirely lack the expertise or cham-pioning of issues that such groups might
provide. Some of our interviewees told us that they have sufficient data management expertise at hand, but not in dedicated posi-tions or units “There are no people with the title ‘data architect’ on our staff,” said Andrew Lawlor, associate vice president for Technology and Communications at Edinboro University of Pennsylvania. “There are data experts, who may apply their knowledge as part of their duties.”
Likewise, respondents from some institu-tions seemed to feel that general IT gover-nance structures can get the job done without a special data committee. At the Community College of Rhode Island, Stephen Vieira, CIO and executive director of IT, uses an Institutional Technology Advisory Committee, which is a subcommittee of the president’s council and has representatives from all major functional groups. “We can feed anything to do with data right into that committee,” said Vieira. “It’s nice that they are all in one room, so the integration of data comes into play and everyone gets a feel for it.”
Surfing, Swimming, or
Drowning?
Though it remains a popular metaphor, our respondents don’t really say they are drowning in data. The sheer volume of information that institutions manage is undoubtedly impressive, but when asked about how it has changed in a year across various data types, respondents were more likely to say it increased than that it greatly increased, and they were generally positive about the capability of their institu-tions’ data infrastructure to manage all those types of data, now and in the future. They do give the impression of a certain struggle to keep up: The mean 22% growth in central IT disk storage that they anticipate over a year’s time is not going to permit a relaxed approach to data infrastructure, nor will it address the relative weakness they seem to recognize in their ability to handle audio and video content. But our respondents showed no signs of a feeling of impending breakdown.
But neither, it must be added, do respon-dents seem to be surfing happily on the great
Figure 3-12. Institutional Data Management Entities (N = 305) 0% 10% 20% 30% 40% 50% 60% 70% 25.6 IT governance committee dedicated to data issues Institutional Data Management Entity
Percentage of Institutions
55.4
Central IT group for data
24.6
wave of data. Keeping up with research data seems to be a real challenge at research-essential institutions, which reported a below-neutral agreement about data infrastructure sufficiency for this item as well as relatively high levels of central IT storage dedicated to institutional researchers. Funding for data management was a widely reported barrier, and drivers for investing in data management seem focused on defensive security matters and business-oriented tasks rather than poten-tially transformative uses in instruction and research. Qualitative interviewees expressed concerns about integrating and documenting data, and about the conceptual challenges of managing unstructured and nontraditional data. And although we saw some progress over the past four years in the creation of an identity infrastructure that can authorize access by role, the basic tool for integrating identity (and thus data regimes) across institu-tional lines—federated identity—remains the preserve of a small fraction of predominantly research-oriented institutions.
So our overview of the data management environment pictures most institutions safely, if a bit doggedly, swimming across a chal-lenging sea of data. As with a lot of higher education IT concerns, data management has the aspect of a workaday task being handled competently by busy IT departments with many other tasks to do. Yet in an age when users can increasingly get instant data and content gratification through a multitude
of commodity sources, higher education will have to do better than supply a local infrastructure for doing so. Data delivery is frequently the end for which IT is the means, and as the most commodified forms of data become almost effortlessly available, higher education will increasingly satisfy its mission and its users by providing higher value-added, more authoritative, better-vetted, and less generally accessible data and content. To do that, it must imaginatively rethink how data abundance reshapes its business and create the infrastructure and policies enabling a new era of data discovery and access. The swimmer needs to learn how to surf.
Endnotes
1. SD = 0.574 and 0.652, respectively.
2. Harvey Blustain, with Sandra Braman, Richard N. Katz, and Gail Salaway, IT Engagement in Research: A Baseline Study (Research Study, Vol. 5) (Boulder, CO: EDUCAUSE Center for Applied Research, 2006), available from http://www.educause.edu/ecar. The authors reported that data storage was growing faster than such other research-related IT resources as high-performance computing and high-perfor-mance networks (p. 52), and most respondents expected central IT funding for research-related data storage to increase. For similar findings in medical school settings, see Mark R. Nelson, IT Engagement in Research: A View of Medical School Practice
(Research Study, Vol. 1) (Boulder, CO: EDUCAUSE Center for Applied Research, 2008), 17, 26, available from http://www.educause.edu/ecar.
3. Ronald Yanosky, with Gail Salaway, Identity Management in Higher Education: A Baseline Study
(Research Study, Vol. 2) (Boulder, CO: EDUCAUSE Center for Applied Research, 2006), available from http://www.educause.edu/ecar.