The Effect of Virtual Reality on Creativity:
Evaluating the Impact of a Nature Environment via Interactive Displays on Creativity
A Masters Thesis Presented to The Faculty of the Graduate School at
Cornell University
In Partial Fulfillment of The Requirements for the Degree
Master of Science in Human Environment Relations Concentration: Human Factors and Ergonomics
By Marty Schatz
Acknowledgements
I would like to thank my parents, Barry and Jody Schatz, for their continuous support and guidance in both my life and my academic career. None of this would be possible without you.
I would also like to thank Dr. So-Yeon Yoon for helping me find a topic to research and her aid throughout my entire journey at Cornell University. Additionally, I would like to thank Dr. Malte Ziewitz for his guidance while I worked on my thesis; without his support and upbeat attitude, this journey would have been far more difficult.
Biographical Sketch
Martin Schatz is a Masters Student at Cornell University with a focus on Human Factors and Ergonomics. He did his Bachelors Degree at the University of Illinois Urbana-Champaign with a major of psychology.
Table of Contents Acknowledgements ………...………..…2 Biographical Sketch………...………..…3 Abstract ………....………5 1. Introduction ………...………7 1.1.Virtual Reality .……….………...……….7 1.2.Creativity Assessments ……….……….………..10
1.3.Immersive Tendencies Questionnaire ……….……….13
1.4.Presence Questionnaire ……….………...…14
1.5.Object-Spatial Imagery Questionnaire .….….………...………15
1.6.Current Study ……….……….……….…16
2. Methods ………...………18
2.1.Participants ………..………….…18
2.2.Procedure ..……….………...………18
2.3.Creativity Assessments ………..………...………19
2.4.Individual Differences Questionnaires ………..………...………20
2.5.Display Devices ……….…………...………22
2.6.Stimuli ………...……….…………...………24
3. Results…………...………...………26
3.1.Hypotheses ..……….…………..………...………26
3.2.Performance Based on Hypotheses I & II & III………….………...………27
3.3.Findings Outside of the Hypotheses ………….……….………...………28
4. Discussion ………...………….………...………31 4.1.Discussion …...…………..………...………31 4.2.Future Directions ………..……….………...………33 4.3.Limitations ..………..………...………34 Appendix A ………...……….………...………36 Resources ………...………...………37
Abstract
This study explored the impact of an immersive environment on a viewer’s creativity, using Virtual Reality and Head-Mounted Displays (HMDs) as a potential, unexplored resource to cultivate new ideas. As these technologies become increasingly realistic, they offer a potentially cost-effective tool for companies to use to stimulate creative environments at the workplace.
In order to appreciate if there is a difference from using an HMD, we need to look at the technology that is currently being used. The current study assessed user creativity viewing a nature scene either on a computer or within an HMD. After the scene was observed, a creativity assessment was given that was comprised of an amalgamation of a Remote Associates Test and an Alternate Uses Test. Once the creativity assessment was completed, users also completed questionnaires to measure individual differences such as processing style, immersive tendencies, and presence.
The 98 participants were placed in one of three conditions: one viewed a nature scene on a computer, one viewed a nature scene through an HMD, or a control condition that did not view the video through any medium, which led to a between-subjects design. It was hypothesized that people who viewed the nature scene on a computer would score higher on the creativity
assessment than people who were in the control condition and did not view the scene at all. It was also hypothesized that people who viewed the same nature environment on an HMD would score higher on the creativity assessment that people who viewed it on a computer. An
assumption was also made that the HMD provides a more immersive VR experience, the HMD group would score higher on the creativity assessment than the computer group.
While the original hypotheses of display media and creativity did not yield any significant results, we did find significant relationships between presence and the immersive
tendency subfactor focus, as well as presence and object image processing style. Both of these results are potential directions for future research to explore.
1. Introduction
A quick Google search about applications for virtual reality will yield “virtually” endless possibilities. Ideas ranging from education, to therapy, and even shopping make up some of the top results, illustrating just how vast the potential is for this technology. Initially, the statement “In the hands of architects, designers, artists, advertisers, engineers, and scientists, virtual reality simulations can be a very powerful tool. Product design, development, testing, and training potential can take quantum leaps” may not seem to be particularly insightful. However, Patel and Cardinali wrote this in 1994, demonstrating that although much progress has been made in this technology over the last 24 years, the full potential and utilization has not been realized.
Countless virtual reality systems with head-mounted displays are being used for different elements of entertainment, including video game play or watching videos, without looking at possible outcomes. The medical field, however, has embraced the positive, potential outcomes that virtual reality can bring. In order to increase the chance of success, virtual reality is being used by doctors before surgeries and in laboratory training (Sutherland et al., 2018). Further, those who were being trained while using immersive virtual reality were performing better, testing similar to doctors who had been practicing for years (Cates, Lönn & Gallagher, 2016). This finding illustrates just one of the conceivable conclusions that can come when virtual reality is used to enhance productivity. Regrettably, as stated before, the potential for virtual reality is limitless, but the practical applications are few and far between. When it is used for betterment, it is quite successful.
Another example of this is when virtual reality is used for rehabilitation. Research done has shown that the technology can be used to help patients recovering from a stroke (Tiê et. al, 2016), elderly patients with issues in their balance (de Oliveira et. al, 2017), and even in pain
decrement (Jones, Moore, & Choo, 2016). These studies, among many others, show that virtual reality can augment progress being made personally or professionally. Yet, very little is being done to use virtual reality technology for nonsocial applications (Pope, 2018).
Creativity is often an aspect that is overlooked when evaluating virtual reality, both for physical applications as well as in research studies. In many cases, if creativity is improved, then other subsequent variables, such as production and satisfaction, are also benefited (Kamel, et al., 2017). Kamel also noted that as productivity increases, corporate satisfaction also increases, which implies that if creativity can be boosted in a work environment more work will be done and people will be happier with that work. And though not much research focused on this, early findings show that using virtual reality is enjoyable which could make the workday pass by quicker and make people’s lives that much better (Jung & tom Dieck, 2017; Forbes 2018).
1.1.Virtual Reality
To be the most productive and creative, a person needs to make sure that they are thinking and using their brain at the highest possible level. In office buildings plants, real or artificial, are arbitrarily placed to provide another stimulus for the workers. Unfortunately, the effects of this are relatively dismal and can actually lead to more sick leave and harm
productivity due to not being properly taken care of and accumulation of particulates (Bakker & der Voordt, 2010; Bringslimark, Hartig, & Patil, 2007). Conversely, the positive effects of being immersed in nature are widely recognized, as studies indicate that spending time in a natural environment can improve one’s physical health, psychological well-being, and most importantly their subsequent cognitive performance (Keniger, Gaston, Irvine, & Fuller, 2013; Greenleaf,
Bryant, & Pollock, 2014). However, most people who work in an office do not have the opportunity or access to immerse themselves in nature for extended periods of time.
Virtual reality provides the opportunity to experience an immersive environment without needing to move locations. Using closed-looped videos, the viewer can see different parts of the world, without leaving their workplace. The videos can be enhanced with sound and a full 360° field of view, allowing these virtual reality environments to provide a stereoscopic display that looks extremely realistic. Through low-cost virtual reality videos, employees can be immersed in an environment that can help stimulate a greater output and more cognitive function on their work. It stands to reason, therefore, that investigation of the effect that virtual reality can have on someone’s creativity, in the workplace and elsewhere, is a valid concept to research.
Recent developments in enhancing virtual reality have centered on two technical
approaches: adding to the field of view and increasing the pixel density. Even the newest virtual reality head-mounted displays (HMDs) still fall short of creating a true sense of reality (Field, 2018). The most recent model of the Oculus Rift, one of the most popular HMDs, only has about 1/10 the pixel density that is needed to mimic real life. In order for the limits of the visual system to be matched, the overall frame update rate would need to be increased to 100 hertz. Although not quite there, significant development has been made in this area in the last few years, and devices, such as the HTC Vive Pro, have achieved a frame update rate of 90 hertz. The advances in virtual reality technology have been mirrored by other technologies, such as smartphones and computers. Smartphones have been steadily increasing the pixel density over the past five years, and similarly computers have gotten close to reaching the limits of the visual system to where some companies even refer to the screens as providing “retina display” (Field, 2018).
Increased pixel density and improved frame rate allow videos to be viewed from a closer distance and thus determining individual pixels is still a tough task. The higher frame rate leads to motion appearing smoother when viewing a video within the virtual reality’s head mounted display, allowing the viewer to feel a greater sense of presence within the environment they are experiencing, as the motion seems more natural. Greater presence should lead to people accepting the environment more, and therefore can possibly lead to a higher score on the creativity assessment, since the participant feels more immersed and connected to the virtual world.
1.2.Creativity Assessments
Creativity is both an important and common qualifier of the performance of people within the workplace. Does a worker bring new ideas to the table? Has an innovative way to think of a problem been created? Can a current system be optimized?
Though an abstract construct, creativity is an essential need of both managers and individual workers (Amabile & Khaire, 2008). Furthermore, organizational creativity is a determining factor in a company’s success, and an organization’s overall creativity is a composite of that of its individuals (Nystrom, 1990). Important as this may be, as an abstract construct, it is difficult to measure or place an absolute value on a person’s creativity. Failure to properly quantify or address the manner in which someone is creative can lead to a misuse of their talents and therefore, a business would not be getting the most out of their employee. Consequently, stymied creativity can lead to lessened communication and decreased ideation in the future (Mostafa, 2005). This study explores whether current technologies, namely a virtual reality intervention, can enhance the viewer’s creativity.
Remote Associates Test
So, how can creativity in the workplace be measured? One approach is the Remote Associates Test (RAT), which was created by Mednick and Mednick in 1959 and further enhanced in 1964 (Mednick & Mednick, 1967). This assessment consists of 30 increasingly challenging items, in which the test-taker needs to find the word in common from three
unassociated words. An example would be “Swiss, Cake, and Bleu”, where the answer would be “Cheese”. The test has been extensively used and is highly reliable (Spearman-Brown reliability of 0.92).
A plethora of studies have supported the utility of this assessment for quantifying a subject’s creativity (Ansburg, 2000; Beeman & Bowden, 2000; Bowden & Jung-Beeman, 2003; Dallob & Dominowski, 1993; Dorfman, Shames, & Kihlstrom, 1996; Schooler & Melcher, 1995; Smith & Blankenship, 1989). The test’s developers, as well as multiple subsequent users have found that the test, using an increasingly difficult scale, provides ample opportunity to work through numerous iterations and varieties of situations to demonstrate one’s creativity.
Prior to developing their own version of a similar testing tool, Bowden & Jung-Beeman, 2003, elaborated about the importance of successfully completing a task or problem. They determined that placing the correct associate can lead a participant to find of their “Aha!
Moment”, which helped spawn other successful answers. This feeling of success helped the test-taker to continue on when reaching a stalemate in the test. The test is scored simply based on the difficulty of correctly identifying the associate. For all challenge levels, an incorrect answer yielded zero points, and correct answers received one point at the easy level, two points at the medium level, three points at the hard level, and four points at the very hard level.
One of the limits of the Remote Associates Test is that it requires a single type of
thinking. This can lead participants to provide a quick “right or wrong” response to the question, without attempting a more thoughtful and analytical response. If an answerer moves on too quickly they may not achieve their “Aha! Moment”, which would hinder future progress as well.
Alternate Uses Test
In order to more accurately quantify the true level of creativity of the subjects, we also used the Alternate Uses Test developed in 1954 by Guilford, Christensen, Merrifield, and Wilson. In this assessment, people thought of as many detailed answers as they could in 90 seconds for alternate uses of a common object. In 1967, Guilford elaborated on the original version of the test, which is the most commonly used form today. The participant was given one minute and thirty seconds to think of as many non-traditional uses for the item as they can. The advantage of this as compared to the RAT is that users are allotted more time per question and can think of different solutions to a single item, requiring more divergent thinking.
The Alternative Uses Test adds the element of time pressure to the test-taker. In an assessment of the value of the test, it was found that as time went on, the participant’s answers became less common and they also were written with lesser frequency (Dippo & Kudrowitz, 2013). The benefits to this are mirrored in everyday life when people have work with a looming deadline; the quantity and quality of answers drop, although the ideas may be more novel than previously provided.
One downside to the test is that it may be considered more of an assessment of the
subject’s divergent thinking abilities and not a true test of creativity (Dippo & Kudrowitz, 2013). However, when used in conjunction with a test of creativity that requires a different style of thinking, an accurate measure of the test taker’s true creativity can be acquired. Additionally, the
Alternate Uses Test mandates that the participants use different processes needed for creativity, such as idea generation and elaboration on their thoughts. Further, in an analysis of various divergent thinking tasks in order to assess their creative potential, the Alternative Uses Test scored among the highest (Runco et al, 2016).
Individually, application of either the Alternative Uses Test or the Remote Associates Test could elicit a narrow, specific type of thinking from the respondent. When used in conjunction, however, both convergent and divergent types of thinking can be assessed. The participant will need to think of a specific solution to the RAT problems, while broadening their traditional thoughts for the Alternative Uses Test. Together, the varied thinking and assessments can be used to provide an accurate evaluation of the subject’s creativity.
1.3.Immersive Tendencies Questionnaire
Both Immersive Tendencies and Object/Spatial Imagery styles (visual information processing styles) are individual characteristics likely to cause different VR experience using HMD & Screen which is why they were considered for the study. The immersive tendencies questionnaire (ITQ) is a set of questions originally developed by Witmer and Singer in 1998. The questionnaire is used to assess how willing a person is to fully immerse themselves in the environment that they are experiencing. Using a Likert scale, the assessment asks questions like “Do you easily become deeply involved in movies or tv dramas?”. The original version has been translated into numerous languages and has been modified by the original authors twice since 1998. The ITQ has a high internal reliability (Cronbach α =.81).
There are many factors that go into a how a person experiences immersion; things like involvement and emotional state can play a role in the level of response that one can have to their
virtual environment. Another key factor is presence, which is indicated by the level of a person’s focus (Fontaine, 1992). The ability to focus is important for people to feel the full effect of the virtual reality stimulus that they are experiencing This is impacted by multiple factors and numerous distractions that draw someone’s attention away from whatever they are doing, such as: How are they feeling in the moment?; Does the physical environment help or hinder how willing they are is to fully experience the virtual scene?; and How natural have the interactions been with people and with the virtual setting? All of these things can have a role in how immersed people are willing to be and how immersed they actually become in a virtual reality scene. If they cannot fully experience the environment that they are within, then the intervention will not be able to be felt to its full effect. Immersion is an important construct to measure because we typically think of consuming technology from the outside-in, but it also happens from the inside-out, which is quantified by the ITQ.
1.4.Presence Questionnaire
Presence is an important attribute to measure in concert with immersive tendencies. If someone often immerses themselves in their environment, they will have a greater likelihood of feeling the full effect of the virtual reality intervention. However, if they are not able to immerse themselves in the moment, it also has an effect on the strength of the outcome. According to Wirth, et. al, 2007, there are two main constructs of spatial presence. First is being physically situated in the environment, which can be largely characterized by a person’s immersive tendencies. Second is a person’s probability to act within that environment according to their perceptions; which includes what people think of the physical space and how they are feeling at that specific time (Wirth et al., 2007).
Developed in 2004 by Vorderer et al., the Measurement, Effects, Conditions – Spatial Presence Questionnaire (MEC-SPQ) integrates both factors that people need in order to feel immersed and present while using a medium. The MEC-SPQ utilizes either four, six, or eight questions that can be applied to television, film, and virtual reality (Vorderer, et al., 2004). The six-item scale measuring attention allocation has a Cronbach α = .91. The attention allocation section bears the most weight for the current study, as it is the part that looks at how people feel at the present time and how affected they felt by the video they saw.
1.5.Object-Spatial Imagery Questionnaire
The Object-Spatial Imagery Questionnaire (OSIQ), was developed to assess the role of individual differences in how people self-report on an object imagery scale and a spatial imagery scale. The object imagery scale looks at preferences for color and representation, and the spatial imagery scale looks at preferences and representations for the schemes, spatial relations, and spatial images that are used within a certain scene. The questionnaire is an amalgamation of two scales that work together to assess how people normally react and codify the space that they are in. Deployed in 2006, it has a high internal reliability (Cronbach α =.83 for the object scale and .79 for the image scale), and it usually yields different results based on an individual’s interests or profession. People who are more analytical and science-based tend to score higher on the object scale, and people who are more creative-based score better on the spatial side
(Blajenkova, Kozhevnikov, & Motes, 2006).
The OSIQ was originally established as a 30-item questionnaire with 15 questions gaging spatial and objects each. Subsequently, a 16-item questionnaire, known as the OSIQ-Short, has been developed with 8 questions on each side. The survey considers individual, visual stimulus
processing style, such as object vs. spatial processing style or holistic vs. analysis processing style, which can help give an all-around interpretation. Subsequent studies have further validated both the OSIQ and the OSIQ-Short, and also have expanded the processing styles to also include a verbal component, thereby creating the OSVIQ (Blazhenkov, & Kozhevnikov, 2009; Kraemer, Rosenberg & Thompson-Schill, 2009; Price, 2009).
1.6.Current Study
The current study expands on recent research regarding the practical applications of virtual reality, specifically related to the creation of new ideas. Studies on the effect of virtual reality have predominantly utilized a head-mounted display, and focused on two areas, neither of which extends to creativity or productivity in a work setting. Much of the current research looks at virtual reality as a practical application focused on the medical field, primarily on approaches to improve surgical performance. The other major focus of virtual reality research in the medical arena is with patients undergoing rehabilitation. Therefore, this current study adds to the existing conversation by bringing in a new avenue to foster ideation and another direction that could result from current virtual reality technologies.
This study looks to provide a better understanding of how emerging and affordable technologies, VR in particular, can be utilized to affect work performance, in this case as it would be applied to an office setting. The current study assesses how a person perceives their environment by combining the ITQ, the OSIQ-Short, and the MEC-SPQ, and applies these factors to how well participants performed on the modified Remote Associates Test and the Alternate Uses Test.
This study employed three conditions: a control condition in which the participant did not see the intervention in any manner; a computer condition in which the participant viewed the video on a computer screen: and a head-mounted display condition in which the participant viewed the video through a head-mounted display. After assignment to one of the conditions, participants completed a demographics survey, and then viewed the intervention. This was followed by completion of the creativity assessments and then application of the individual differences evaluations.
In efforts to adjust to the rapid rate of advancement in technology, many companies explore innovative ways to maintain an advantage over competitors, including seeking different approaches to enhance creativity, and productivity of their employees (Selnes, & Sallis, 2003). This study used binocular and monocular 360 videos in both virtual reality headsets and a ViewSonic VX2250wm computer to display a high definition video scene of nature. Researchers conducted an exploratory study to see if there are benefits to using this technology over what is currently used. It was questioned if there could be a greater effect on subsequent creativity if an HMD is used to experience the video, as compared to a computer? This led to the formation of the following hypotheses:
Hypothesis I: Participants in the computer condition will score higher on the subsequent creativity tests than the control condition.
Hypothesis II: Participants in the condition watched a video using a Head-Mounted Display will score higher on subsequent creativity tests than the computer condition.
Hypothesis III: Participants in the condition that watched the video using a Head-Mounted Display will score higher on the test that measures presence than the computer condition.
2. Methods 2.1.Participants
Ninety-eight (98) participants (35% male, 65% female) were recruited using a mix of convenience sampling and the Cornell University recruiting pool, SONA Systems. Participant ages ranged from 18-36 (Mean age = 21.16, SD = 3.14), and they were randomly assigned to one of three groups: control, computer, or virtual reality. Seven participants were excluded from the final analysis due to either not understanding the tasks after instruction was given (four
participants) or not fully completing the assessments (three participants). In return for their completed participation, subjects received either course credit or $15 cash as remuneration.
2.2.Procedure
After arriving, participants filled out an informed consent form, which detailed the tasks they were being asked to complete, as well as the negligible risks of using a head mounted display to view a virtual scene. Upon completion of the consent form, subjects filled out a brief demographic survey before viewing the video. Once the video was finished, the rest of the questionnaires and creativity assessments were taken; this part included the Remote Associates Test, the Alternate Uses Test, the Immersive Tendencies Questionnaire, the Object-Spatial Image Questionnaire, and the Measurement, Effects, Conditions – Spatial Presence Questionnaire.
The study had three conditions, involving how the participants viewed intervention: the virtual reality condition, in which participants viewed the video on an HTC Vive Pro head mounted display; the computer condition, in which participants viewed the video on a
ViewSonic VX2250wm Monitor or an Apple MacBook Pro with Retina Display; and a control condition, in which participants did not view the video, and simply took the creativity tests and the questionnaires (minus the presence questionnaire).
All participants used either a ViewSonic VX2250wm computer or a MacBook Pro with Retina Display 15” computer to complete the demographics survey and the questionnaires. They sat about 18 inches from the center of the monitor set at the user’s eye level. Before each of the creativity tests, instructions and examples were given and participants were allowed to spend as much time on the instruction page as they needed before the assessments began. Each of the creativity tests were timed, with 90 seconds allotted for each item in the Alternate Uses Test and 10 minutes total for the Remote Associates Test, while none of the subsequent questionnaires had time restrictions.
2.3.Creativity Assessments
After the video was viewed, participants took two different creativity tests, the order in which they took first was randomized. For the current study, an Alternate Uses Test, similar to that created by Guilford et al., 1967, which measured participant ability to think of alternate uses for five items: a pencil, a brick, a cell phone, a paper clip, and a ping pong ball. Each person had up to 90 seconds to think of as many non-traditional uses for each item as they could before their time expired. For this task, a participant was graded on four criteria: originality, fluency,
flexibility, and elaboration. For Originality, if fewer than 10% of respondents had the same answer, an additional point was awarded, and two additional points were awarded if the answer was on fewer than 5% of responses. Fluency was simply scored based on the total number of answers that were given. Flexibility points were awarded based on the total number of different categories that a respondent answered. Lastly, elaboration allocated an extra point based on the detail of each response.
The Remote Associates Test that was used was a modified version of the one outlined by Mednick and Mednick in 1964. There were four levels of difficulty that gauged the participant’s ability to think of the correct associate. Each subject had 10 minutes to think of as many answers to the 30 possible associates as they could. The test was scored in an escalating fashion based off of the difficulty of the question; the easy level had ten items worth one point each; the medium level had ten items worth two points each; the hard level had five items worth three points each; and the very hard level had five items worth four points each. The score from each of the creativity assessments were added together for each participant to create their individual aggregate, total creativity score.
2.4.Individual Differences Questionnaires Presence (MEC-SPQ)
The MEC Spatial Presence Questionnaire (MEC-SPQ) was created to provide a more reliable theoretically-based presence questionnaire (Vorderer et al., 2004). Presence is an important measure for this current study because it enumerates the level of feelings that the individual experienced during the video intervention. If they felt strongly immersed in the environment or if they felt disjointed from the video, can be quantified by the MEC-SPQ. The questionnaire was created in three different versions that had either 4, 6, or 8 items in each of the 8 subscales. The current study used the 6-item version and determined the attention allocation factor to be the most important in learning how viewers responded to the videos, and if they felt immersed as if they were present in the environment that the video was displaying. In order to ascertain how participants truly felt, the current study administered the presence questionnaire directly after the creativity tests, which were taken immediately after the videos were seen. Of
note, participants in the control condition did not see a video, and hence did not take this questionnaire since they had nothing to measure the presence of.
Immersive Tendencies Questionnaire (ITQ)
The Immersive Tendencies Questionnaire was created in 1998 by Witmer and Singer for measuring a person’s tendencies to immerse themselves into their various medias. The
questionnaire uses a 7-point Likert scale ranging from Never (1) to Often (7), for assessing how willing an individual is to be immersed. The form also has three subscales that are measured within it based on the participant’s tendencies to maintain focus, become involved, and play video games. The measure is reliable with a Cronbach’s Alpha of .81. The current study used the original adaptation that was developed in 1998. The questionnaire was administered after the presence questions, which immediately followed the creativity assessments.
Object-Spatial Imagery Questionnaire (OSIQ)
The Object-Spatial Imagery Questionnaire, administered immediately following the ITQ, was used to measure an individual’s processing style, to confirm the level that participants were reacting to the intervention, regardless of how it was experienced. Participants responded using a 5-point Likert scale ranging from Totally Disagree (1) to Totally Agree (5) to ascertain the value that they put on object images or spatial images. The current study used a modified version of the OSIQ called the OSIQ-Short (Blajenkova, Kozhevnikov, & Motes, 2006). The short version has an even split between object and spatial questions and has 16 total items compared to the original version’s 30. The short version is highly reliable (Cronbach’s Alpha =
.83 for the object scale and .79 for the image scale), and helps determine the processing style of the subject to show if there is an interaction with the other tested variables.
2.5.Display Devices
All three conditions used a ViewSonic VX2250wm Monitor to take the demographics survey, the creativity tests, and the individual differences questionnaire. Additionally, those in the computer condition watched the video on this monitor directly after the demographics survey. The monitor is 21.5 inches across diagonally and has an 1920x1080 optimum resolution with about 102.5 pixels per inch. In the computer condition, the viewers were able to control the place and direction which they looked in the video with a mouse that was attached to the
computer (image 2.5.2). Participants sat 18”-20” away from the computer with the middle of the screen being adjusted to the individual’s eye level. Users field of view (FOV) was usually about 24°, which allowed them to view the video, but obviously did not immerse them as much as the head mounted display.
HTC Vive Pro Head Mounted Display
The participants who were assigned to the virtual reality condition used an HTC Vive Pro HMD (image 2.5.1). The Vive Pro is a high-quality, readily available HMD. Compared to other head mounted displays that are on the market, the Vive Pro is one of the most advanced in terms of the displays that are produced and the technologies that are used. Videos displayed in the HMD were powered by SteamVR. The specs of the Vive Pro include having a resolution of 1440 x 1600 pixels per eye (2880 x 1600 pixels combined), a refresh rate of 90Hz, with a 110° FOV. The headset is also able to present a 15’x15’ room scale size that viewers can be
immersed in. The HMD uses head tracking and orientation to determine the user’s position in space and to know where the person is looking. In order to assure that the display fits the user’s head the Vive Pro can be adjusted with three straps that tighten and loosen, and also can be adjusted to adapt to the viewers interpupillary distance and lens distance with a turnable knob on the side of the HMD.
2.6.Stimuli
The 360° VR video portraying a natural scene that included a forest and a waterfall was carefully chosen to elicit a strong reaction and to facilitate a state of flow after brainstorming with expert psychologists. It is known that in a flow state, people would be wholly focused on without being over-aroused or too bored but in a solid mind state in between (Nakamura, & Csikszentmihalyi, 2014). In order for people to reach a state of flow, the video would need to keep their attention for the full duration, and nature scenes are the most able to achieve that (Laumann, Garling, & Storkmark, 2003). The intervention that was shown to the experimental conditions, computer and virtual reality, was picked because it was an easily-accessible,
From a technical perspective, one of the reasons that this particular video was chosen was that it allowed users in the computer condition and the HMD condition to control where they were viewing; in the computer condition, focus could be changed with use of a computer mouse by clicking and dragging; and in the HMD condition, the participant’s head position was tracked, which allowed the viewer to change what they were looking at. In both situations, the video was played at 4K resolution.
The video was created by an independent film maker in Pura Vida, Costa Rica with a 360° camera. The video was a stereoscopic, 360° view that showed a forest path that led to a waterfall (Image 2.6.1 & 2.6.2) titled Sacred Waterfall 360 – the video was 5 minutes and 28 seconds long. A stereoscopic video was chosen as it provided a greater level of immersion over a standard video (Wesslen, 2011). This provided a partially closed-loop video allowing
participants to choose where and what they are looking at, without determining the path or outcome of what was being watched. A video was chosen as opposed to a static scene in hopes of reducing the potential of viewers feeling bored while looking at a singular, unmoving area. A
natural scene was chosen because of the restorative effects of nature (Tyrväinen et al., 2004; Kaplan & Kaplan, 1989). Therefore, a possible added benefit relative to other types of videos, could have been given while taken the creativity assessments. Additionally, it was felt that this particular scene would resonate with people who may not identify with wooded nature scenes, as it included water scenes as well.
From a content perspective, a nature themed video was selected to focus on the
advantages that can provide with regard to its mindfulness and restorative benefits as well as on the subsequent productivity of someone who has had a nature intervention (Berman, Jonides, & Kaplan, 2008; Kaplan & Kaplan, 1989).
3. Results 3.1.Hypotheses
The main goal of the study is to explore whether an immersive environment, such as that viewed with a head-mounted display, will have an effect of the viewers’ subsequent level of creativity. We expect that viewers who use the Vive Pro headset will score higher on the creativity assessments than users in the other conditions. Additionally, we expect that users who view the treatment on a computer will score higher than people who do not get to see the video in any capacity. This study also assessed users’ individual differences through a variety of means to determine if any of these variables had an effect on the outcomes. We looked at
whether subjects had a spatial or object processing style, and if that had an effect on their results. User’s immersive tendencies were also measured to see if any of the immersive tendency
subcategories, focus, emotion, game, and involvement, played a role in the scores. Furthermore, one way that the study quantified if the intervention was successful was via a measure of
presence developed by Voderer et al., (2004). A higher score on the presence questionnaire for participants in the HMD condition reflects a successful treatment.
Hypothesis I: Participants in the computer condition will score higher on the subsequent creativity tests than the control condition.
Hypothesis II: Participants in the condition that watched the video using a Head-Mounted Display will score higher on subsequent creativity tests than the computer condition.
Hypothesis III: Participants in the condition that watched the video using a Head-Mounted Display will score higher on the test that measures presence than the computer condition.
3.2.Performance Based on Hypotheses I & II
The primary purpose of the study was to assess if a fully immersive display can lead to positive benefits on the viewers creativity. After completion of the data collection, all scores were tabulated to give every participant a creativity score and questionnaire scores.
Exploration between participants’ condition and the performance on the creativity tasks was analyzed using an independent samples t-test. For both hypotheses there was no significant difference in performance on the creativity assessments – hypothesis I: t(60)=0.936, p = 0.176, hypothesis II: t(58)= -0.262, p = 0. 397.
These results suggest that with this sample, the display technique and level of immersion did not have a significant effect on the creativity level of the participant.
3.3.Performance Based on Hypothesis III
A further resolve of this research was to find different ways that virtual reality and head mounted displays could potentially benefit those using the technology. The level of presence that users experienced is one way. This construct is important to measure as a significant difference between the computer condition and the head-mounted display condition would illustrate that the intervention was successful in leading participants to feel more immersed in their environment. A finding of no difference would indicate that the treatment, i.e., display modality, did not play a role in affecting user’s creativity level, and average group differences could be attributed to natural scatter. In order to assess immersion, or feeling of presence in the shown environment, we used a six-factor presence questionnaire (Voderer et al., 2004). An independent samples t-test was run to assess if there was a difference between the two groups that could have felt presence in an environment – the HMD condition and the computer screen
condition. In the control condition, the subject was not given a stimulus thus the presence questionnaire was not administered. The test result showed a significant difference between the people who viewed the scene with the head-mounted display and those who simply viewed it on a computer, t(58)=2.34, p=0.023. These results show that there was indeed a greater level of presence felt in the head-mounted display condition.
3.4.Findings Outside of the Hypotheses Immersive Tendencies (ITQ)
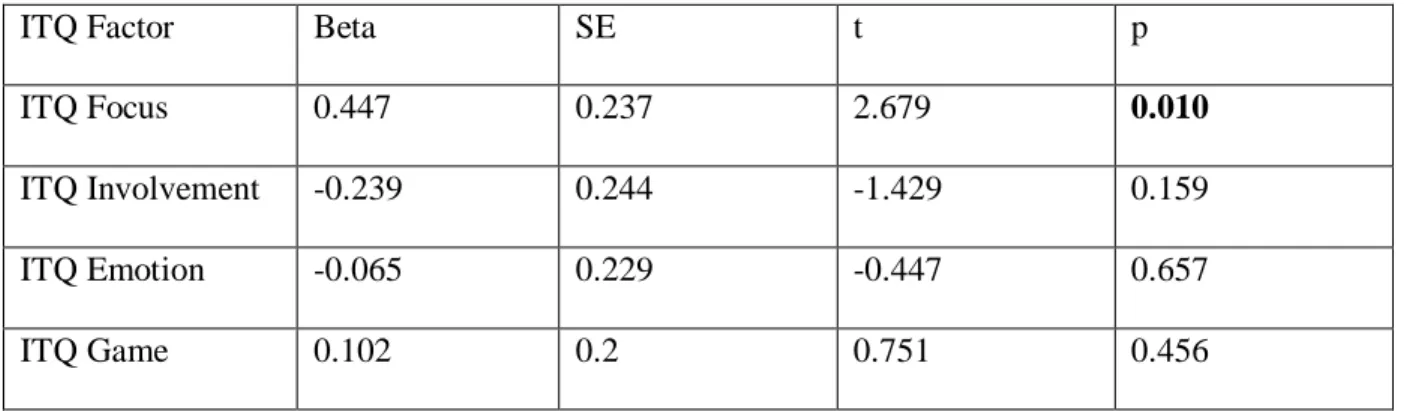
Additional analysis looked at whether other assessed variables played a role in how people interacted with the treatment. After totaling each of the factors of the questionnaire, we pivoted to see if any immersive tendency subscales had an effect on presence. A simple linear regression was computed to see if any of the ITQ factors could predict the level of presence felt. A significant relationship was found between the ITQ subscale focus and presence (p < 0.05) (see table 3.3.1 below). We assessed if any of them had any direct or indirect effect with the creativity scores by running mediation and moderation tests. None of our tests yielded any significant results.
Table 3.3.1 - Regression (ITQ Factors & Presence)
ITQ Factor Beta SE t p
ITQ Focus 0.447 0.237 2.679 0.010
ITQ Involvement -0.239 0.244 -1.429 0.159 ITQ Emotion -0.065 0.229 -0.447 0.657
ITQ Game 0.102 0.2 0.751 0.456
Object – Spatial Imagery Questionnaire
After totaling both of the factors and running a Pearson Correlation, we found that in our sample the responses to the OSIQ there was a highly significant correlation between the two, object and spatial imagery processing styles. While it is known that the two styles are
independent (Blanjenkova, 2006) this study found a correlation between them. A factor analysis was performed to find which of the sixteen total items successfully assessed what they were supposed to. There were seven total items kept in the final analysis (see appendix A).
Possible interaction effect between processing style and presence was examined. A simple linear regression was run to see if either object or spatial processing style could predict a change in the level of presence felt. A significant relationship was found between the object processing style and presence (p < 0.05) (see table 3.3.2 below), but no such result was found with the spatial processing style. There was no significant relationship found between the creativity score and processing styles.
Table 3.3.2 - Regression (OSIQ Factors & Presence)
OSIQ Factor Beta SE t p
OSIQ Object -.278 0.267 -2.113
.0390
Demographic Information (Age, gender, race, and education level)
There was no relationship found between age and presence, but age had a strong, positive correlation (r = .344, p = < .01) with the scores on the creativity assessments. Further statistical analysis exploring the possible impact of gender, race, and education level did not yield any interesting or statistically significant results when looking at creativity scores or presence.
4. Discussion 4.1.Discussion
The primary purpose of the study was to see if being in an immersive environment would lead to an uptick in creativity compared to a non-immersive environment. As this was an exploratory study, utilizing a unique approach, to examine a relatively unexplored area of research, it was not atypical that our study did not yield a hypothesis with a significant result. Unfortunately, we did not see the scores we anticipated at the outset of the study. As a result, we cannot reject either null hypothesis. However, we did uncover some interesting directions for possible future research to investigate. We learned from our study that when subjects experienced a significantly greater level of presence in the immersive environment, our treatment was effective, and subjects noticed a difference between watching a video through a head-mounted display versus watching on a computer screen. However, these differences did not subsequently impact creativity. This relationship is integral to note for future research. With HMDs leading to a measured difference in the amount that a participant identifies with a space, the applications are vast. Users will be able to identify with a space or event to a greater level without having to physically be in that space.
The results revealed some interesting relationships that were not part of our primary hypotheses. First, there was a significant relationship between the immersive tendency subscale focus and presence. Intuitively, this makes a lot of sense. The more that people are paying attention to their surroundings the greater the connection they will feel to the space. No other subscales of the immersive tendencies questionnaire yielded significant results, through the emotion subscale emotion could be promising. We believe that people’s emotional state will affect how they receive and comprehend the environment that they are in. These two
relationships are important to track for future research. Cell phones, social media, and other factors are more prevalent now than ever before. These influences also can take away a person’s focus from where they are or a task that they are performing. As we learned, that can affect how they connect with their environment. It is important for environments that rely on how people feel about that space, such as Disneyland or Six Flags, to do what they can to ensure patrons are focused for as long as they can be. That, as we found, can lead to a higher level of connection with the environment and therefore, a more enjoyable time
Second, we found a significant relationship between people with an object processing style and presence. While intuitively it makes sense that people who are spatial processors would be more immersable in to an environment, that is not what we found. With our treatment, people who spatially process images would have looked at the relationship of the objects instead of what the things actually were. We found that people with an object imagery processing style were more captive of the environment. This makes sense as females tend to have more of object image processing style (Blajenkova, Kozhevnikov, & Motes, 2006), and our study had 65% female participants. This relationship is intriguing going forward because intuitively it is not what would have been predicted in the outset, but it makes a lot of sense. Object processors rely more on imagery and less on text than spatial processors (Höffler, Koć‐ Januchta, & Leutner, 2017). With a video that was a over five minutes with no written words we understand the importance that images and snapshots in one’s mind can play. These mental images that stay with a person can influence the strength of presence felt. It would be
interesting to see how a task that requires text and imagery, such as reading a map to get to a destination or an escape room, would play a role in the strength of presence felt by the two processing styles.
We also found a significant relationship between age and creativity. This result was heavily influenced by two high leverage points that were not outliers, and analysis indicated that without these points the result was no longer significant. This, however, is another direction that could merit further exploration, initially to see if these findings are consistent with other studies. With two different types of creativity being assessed in our study, it is interesting to note that older participants scored higher on the combined, aggregate score. Further research could look at a possible relationship between age and the assessment scores, independent of condition. It will be interesting to see if there is a time when divergent and linear thinking peak or if they continue to enhance with age. The implications in a traditional work setting are important to note nonetheless. When offices typically look to people new on the job, the young employee to bring fresh ideas and vigor to a company, instead they should look to people who have been there for a while to see new and innovative ways to solve problems. Ideation could be boosted by producing the proper environment to employees who have paid their dues.
4.2Future Directions
One thing that was not formally evaluated in the study, was participant’s previous experience with a head-mounted display. In casually asking subjects of their experience, and not tracking the results, it seemed to the researcher that the majority of people had not used a VR headset more than one to two times. This potentially could lead people to being more distracted by the environment than receiving a positive effect from it. In the future, the level of familiarity with HMDs could be a criterion for participation, to address the potential distraction of using a new technology.
Additionally, with presence being significant, future research should look deeper at the characteristics of the relationship and which factors can strengthen or hinder the connection. Future research should look at where the limit is. Can people feel like they attended an event without actually being there? Will someone want to stay at a hotel they were immersed in more so than one they were not? Understanding this connection on a more thorough level will be a key factor to determining how far the applications of this technology can go and what it can achieve.
4.3Limitations
As with any empirical study we had a number of limitations. While 98 people participated in the study, they did not all yield usable results; additionally, the group is fairly homogenous being all college students. With a greater sample size, we would have been able to see if any of the emerging trends were simply a result of our sample or if it is something that merits greater research. Additionally, we employed a between-subjects study design which means that our control group served as the baseline for the average creativity score instead of using a within-subjects design and having a baseline for every individual to see if there was a delta in how they responded.
As mentioned earlier, there may have been an effect from people being new to head-mounted display technology. This could have subsequently had an effect on the quality and quantity of the responses that people gave instead of being able to fully engage the treatment.
Lastly, the video we used for the conditions that received a treatment was not a fully closed loop video. This means that while the viewer could change where they were looking within the video, the path the video went on was predetermined. To some people, especially
people who are sensitive to virtual reality, it can lead to a feeling of discomfort (Field, 2018). If the feeling of discomfort was felt and lingered it could have acted as a distraction while
Appendix A:
OSIQ (bolded items were kept in final analysis) O) I have photographic memory.
S) I prefer schematic diagrams and sketches when reading a textbook instead of colorful and pictorial illustrations.
S) I was very good in 3-D geometry as a student. S) I have excellent abilities in technical graphics. S) Architecture interests me more than painting.
O) I can close my eyes and easily picture a scene that I have experienced. S) When thinking about an abstract concept (e.g., ‘a building’) I imagine an abstract schematic building in my mind or its blueprint rather than a specific concrete building. S) My images are more like schematic representations for things events rather than like detailed pictures.
S) I can easily sketch a blueprint for a building that I am familiar with. S) In school, I had no problems with geometry.
O) My visual images are in my head all the time. They are just right there.
O) When reading fiction, I usually form a clear and detailed mental picture of a scene or room that has been described.
O) When I imagine the face of a friend, I have a perfectly clear and bright image. O) I can easily remember a great deal of visual details that someone else might never notice. For example, I would just automatically take some things in, like what color is a shirt someone wears or what color is a shirt someone wears or what color are his/her shoes.
O) My images are very vivid and photographic.
O) I remember everything visually. I can recount what people wore to a dinner and I can talk about the way they sat and the way they looked probably in more detail than I would discuss what they said.
Note: Factors with an O in front are object factors and factors with an S in front are spatial factors.
Resources:
Amabile, T. M., & Khaire, M. (2008). Creativity and the role of the leader. Harvard Business Review (Oct), 100-109. URL: http://hbr.org/2008/10/creativity-and-the-role-of-theleader/ar/1 Ansburg, P. I. (2000). Individual differences in problem solving via insight. Current Psychology, 19(2), 143-146.
Bakker, I., & Theo van, d. V. (2010). The influence of plants on productivity. Facilities, 28(9), 416-439. doi:http://dx.doi.org.proxy.library.cornell.edu/10.1108/02632771011057170
Beeman, M. J., & Bowden, E. M. (2000). The right hemisphere maintains solution-related activation for yet-to-be-solved problems. Memory & cognition, 28(7), 1231-1241.
Berman, M. G., Jonides, J., & Kaplan, S. (2008). The cognitive benefits of interacting with nature. Psychological science, 19(12), 1207-1212
Blajenkova, O., Kozhevnikov, M., & Motes, M. A. (2006). Object‐spatial imagery: a new self‐ report imagery questionnaire. Applied Cognitive Psychology: The Official Journal of the Society for Applied Research in Memory and Cognition, 20(2), 239-263.
Blazhenkova, O., & Kozhevnikov, M. (2009). The new object‐spatial‐verbal cognitive style model: Theory and measurement. Applied Cognitive Psychology: The Official Journal of the Society for Applied Research in Memory and Cognition, 23(5), 638-663.
Bringslimark, T., Hartig, T., & Patil, G. G. (2007). Psychological benefits of indoor plants in workplaces: Putting experimental results into context. HortScience, 42(3), 581-587. Retrieved from https://search-proquest-com.proxy.library.cornell.edu/docview/47537009?accountid=10267
Bowden, E.M., & Jung-Beeman, M. (2003). Normative data for 144 compound remote associate problems. Behavioral Research Methods, Instrumentation, and Computers, 35, 634-639.
Cates, C. U., Lönn, L., & Gallagher, A. G. (2016). Prospective, randomised and blinded
comparison of proficiency-based progression full-physics virtual reality simulator training versus invasive vascular experience for learning carotid artery angiography by very experienced
operators. BMJ Simulation and Technology Enhanced Learning, bmjstel-2015.
Chermahini, S. A., Hickendorff, M., & Hommel, B. (2012). Development and validity of a Dutch version of the Remote Associates Task: An item-response theory approach. Thinking Skills and Creativity, 7(3), 177-186.
Dallob, P. I., & Dominowski, R. L. (1993). Erroneous solutions to verbal insight problems: Effects of highlighting critical material. In annual meeting of the Western Psychological Association, Phoenix, AZ.
Dippo, C., & Kudrowitz, B. (2013). Evaluating the alternative uses test of creativity. 2013 NCUR.
Dorfman, J., Shames, V. A., & Kihlstrom, J. F. (1996). Intuition, incubation, and insight: Implicit cognition in problem solving. Implicit cognition, 257, 296.
Field, D. (2018). PSYCH6420: Virtual Reality Devices[Lecture slides]. School of Human Ecology, Cornell University, Ithaca, New York.
Fontaine, G. (1992). The experience of a sense of presence in intercultural and international encounters. Presence: Teleoperators and Virtual Environments, 1 (4), 482–490
Greenleaf, A. T., Bryant, R. M., & Pollock, J. B. (2014). Nature-based counseling: Integrating the healing benefits of nature into practice. International Journal for the Advancement of
Counselling, 36(2), 162-174. doi:http://dx.doi.org.proxy.library.cornell.edu/10.1007/s10447-013-9198-4
Höffler, T. N., Koć‐Januchta, M., & Leutner, D. (2017). More Evidence for Three Types of Cognitive Style: Validating the Object‐Spatial Imagery and Verbal Questionnaire Using Eye Tracking when Learning with Texts and Pictures. Applied cognitive psychology, 31(1), 109-115. Juliana, A. deOliveira., Thaís, F. G., Jéssica Maria, R. B., Roberta, A. G. T. E., Danilo, S. B., Júlia, M. D., & Angélica, C. A. (2017). Virtual reality in the rehabilitation of the balance in the elderly. Manual Therapy, Posturology & Rehabilitation Journal = Revista Manual Therapy, 15 doi:http://dx.doi.org.proxy.library.cornell.edu/10.17784/mtprehabjournal.2017.15.481
Jones, T., Moore, T., & Choo, J. (2016). The impact of virtual reality on chronic pain. PLoS One, 11(12) doi:http://dx.doi.org.proxy.library.cornell.edu/10.1371/journal.pone.0167523
Jung, T. H., & tom Dieck, M. C. (2017). Augmented reality, virtual reality and 3D printing for the co-creation of value for the visitor experience at cultural heritage places. Journal of Place Management and Development, 10(2), 140-151. Retrieved from https://search-proquest-com.proxy.library.cornell.edu/docview/1904814254?accountid=10267
Kamel, J. A., Nogueira, Martins, C. V., Pessanha, M. B., & de Andrade, M. W. (2017).
Creativity and innovation for corporate happiness management. Brazilian Journal of Science and Technology, 4(1), 1-20. doi:http://dx.doi.org.proxy.library.cornell.edu/10.1186/s40552-017-0038-7
Kaplan, R., & Kaplan, S. (1989). The experience of nature: A psychological perspective. CUP Archive.
Keniger, L. E., Gaston, K. J., Irvine, K. N., & Fuller, R. A. (2013). What are the benefits of interacting with nature? International Journal of Environmental Research and Public Health,
10(3), 913-35. Retrieved from
https://search-proquest-com.proxy.library.cornell.edu/docview/1354933269?accountid=10267
Koetsier, J. (2018, April 30). VR Needs More Social: 77% of Virtual Reality Users Want More Social Engagement. Retrieved from
https://www.forbes.com/sites/johnkoetsier/2018/04/30/virtual-reality-77-of-vr-users-want-more-social-engagement-67-use-weekly-28-use-daily/
Kraemer, D. J., Rosenberg, L. M., & Thompson-Schill, S. L. (2009). The neural correlates of visual and verbal cognitive styles. Journal of Neuroscience, 29(12), 3792-3798.
Mamizuka, K. (2016). The effects of brain breaks on the academic readiness of third graders Retrieved from
https://search-proquest-com.proxy.library.cornell.edu/docview/2100730241?accountid=10267
Mednick, S.A., & Mednick, M.T. (1967). Examiner's manual: Remote Associates Test. Boston: Houghton Mifflin
Mostafa, M. (2005). Factors affecting organisational creativity and innovativeness in egyptian business organisations: An empirical investigation. The Journal of Management Development, 24(1), 7-33. Retrieved from
https://search-proquest-com.proxy.library.cornell.edu/docview/216349989?accountid=10267
Nakamura, J., & Csikszentmihalyi, M. (2014). The concept of flow. In Flow and the foundations of positive psychology (pp. 239-263). Springer, Dordrecht.
Nystrom, H. (1990). Organizational innovation. In M. S. West, & J. L. Farr (Eds.), Innovation and creativity at work: Psychological and organizational strategies (pp. 143–162). New York: Wiley.
Patel, H., & Cardinali, R. (1994). Virtual reality technology in business. Management Decision, 32(7), 5. Retrieved from
https://search-proquest-com.proxy.library.cornell.edu/docview/212084015?accountid=10267
Pope, H. (2018). Chapter 4. user engagement and real-life applications. Library Technology Reports, 54(6), 18-20. Retrieved from
https://search-proquest-com.proxy.library.cornell.edu/docview/2099876184?accountid=10267
Pope, H. (2018). Chapter 5. the future of virtual and augmented reality. Library Technology Reports, 54(6), 21-25. Retrieved from
https://search-proquest-com.proxy.library.cornell.edu/docview/2099868508?accountid=10267
Price, M. C. (2009). Spatial forms and mental imagery. Cortex, 45(10), 1229-1245.
Runco, M. A., Abdulla, A. M., Paek, S. H., Al-Jasim, F. A., & Alsuwaidi, H. N. (2016). Which test of divergent thinking is best?. Creativity. Theories–Research-Applications, 3(1), 4-18.
Schooler, J. W., & Melcher, J. (1995). The ineffability of insight.
Selnes, F., & Sallis, J. (2003). Promoting relationship learning. Journal of Marketing, 67(3), 80-95. doi:http://dx.doi.org.proxy.library.cornell.edu/10.1509/jmkg.67.3.80.18656
Smith, S. M., & Blankenship, S. E. (1989). Incubation effects. Bulletin of the Psychonomic Society, 27(4), 311-314.
Laumann, K., Gärling, T., & Stormark, K. M. (2003). Selective attention and heart rate responses to natural and urban environments. Journal of environmental psychology, 23(2), 125-134.
Sutherland, J., Belec, J., Sheikh, A., Chepelev, L., Althobaity, W., Chow, B. J. W., . . . La Russa, D.,J. (2018). Applying modern virtual and augmented reality technologies to medical images and models. Journal of Digital Imaging, , 1-16.
doi:http://dx.doi.org.proxy.library.cornell.edu/10.1007/s10278-018-0122-7 Thurston, A. (2015). Education. Retrieved December 22, 2018, from https://www.bu.edu/research/articles/moving-to-improve/
Tyrväinen, L., Ojala, A., Korpela, K., Lanki, T., Tsunetsugu, Y., & Kagawa, T. (2014). The influence of urban green environments on stress relief measures: A field experiment. Journal of Environmental Psychology, 38, 1-9.
VIVE Pro VR SYSTEM. (n.d.). Retrieved from https://www.vive.com/us/product/vive-pro/ Vorderer, P, Wirth, W., Gouveia, F. R., Biocca, F., Saari, T., Jäncke, F., Böcking, S., Schramm, H., Gysbers, A., Hartmann, T., Klimmt, C., Laarni, J., Ravaja, N., Sacau, A., Baumgartner, T. & Jäncke, P. (2004). MEC Spatial Presence Questionnaire (MECSPQ): Short Documentation and Instructions for Application. Report to the European Community, Project Presence: MEC (IST-2001-37661). Online. Available from http://www.ijk.hmt-hannover.de/presence.
Wesslen, E. (2011). Stereoscopic 3D and its effects on the perception of immersion (Order No. 1510035). Available from ProQuest Dissertations & Theses Global. (1015630345). Retrieved from
https://search-proquest-com.proxy.library.cornell.edu/docview/1015630345?accountid=10267
Wirth, W., Hartmann, T., Bocking, S., Vorderer, P., Klimmt, C., Schramm, H., . . . Jancke, P. (2007). A process model of the formation of spatial presence experiences. Media Psychology, 9(3), 493-525. doi:http://dx.doi.org.proxy.library.cornell.edu/10.1080/15213260701283079 Witmer, B. G., & Singer, M. J. (1998). Measuring presence in virtual environments: A presence questionnaire. Presence, 7(3), 225-240.
Yamato, T. P., Pompeu, J. E., Pompeu, S. M. A. A., & Hassett, L. (2016). Virtual reality for stroke rehabilitation. Physical Therapy, 96(10), 1508-1513. Retrieved from https://search-proquest-com.proxy.library.cornell.edu/docview/1837185032?accountid=10267