SENTIMENT ANALYSIS IN STREAMS
OF MICROBLOGGING POSTS
Doctoral Dissertation
Jožef Stefan International Postgraduate School Ljubljana, Slovenia
Supervisor: Asst. Prof. Dr. Martin Žnidaršič, Jožef Stefan Institute, Ljubljana, Slovenia, and Jožef Stefan International Postgraduate School, Ljubljana, Slovenia
Co-Supervisor: Prof. Dr. Nada Lavrač, Jožef Stefan Institute, Ljubljana, Slovenia, Jožef Stefan International Postgraduate School, Ljubljana, Slovenia, and
University of Nova Gorica, Nova Gorica, Slovenia
Evaluation Board:
Asst. Prof. Dr. Tomaž Erjavec, Chair, Jožef Stefan Institute, Ljubljana, Slovenia, and Jožef Stefan International Postgraduate School, Ljubljana, Slovenia
Prof. Dr. Janez Povh, Member, Faculty of Information Studies, Novo mesto, Slovenia Dr. Indr˙e Žliobait˙e, Member, Aalto University, Finland, and
Jasmina Smailović
SENTIMENT ANALYSIS IN STREAMS
OF MICROBLOGGING POSTS
Doctoral Dissertation
ANALIZA SENTIMENTA V TOKOVIH
KRATKIH SPLETNIH SPOROČIL
Doktorska disertacija
Supervisor: Asst. Prof. Dr. Martin Žnidaršič Co-Supervisor: Prof. Dr. Nada Lavrač
vii
Acknowledgments
In the first place, I would like to express my gratitude to my supervisor Martin Žnidaršič and co-supervisor Nada Lavrač for all of their support, patience, and inspiring ideas during my doctoral study. Especially I would like to thank them for teaching me how to perform high quality research, and how to think and write like a scientist.
I am thankful to the members of my PhD committee, i.e., Tomaž Erjavec, Janez Povh, and Indr˙e Žliobait˙e for their useful comments and suggestions, which improved the quality of the thesis.
Several funding bodies financially supported the research presented in this dissertation and I would like to thank them: Ad Futura Program of the Slovene Human Resources Development and Scholarship Fund; Department of Knowledge Technologies at the Jožef Stefan Institute; the European Commission through the research projects FIRST, FOC, SIMPOL, MULTIPLEX, and WHIM; and the research voucher funded by the Slovenian Ministry of Education, Science, Culture and Sport.
I would like to thank Sowa Labs GmbH1 for providing the Goldfinch annotation plat-form for hand-labeling Twitter messages.
I am thankful to Gama System d.o.o. company2 for their kind cooperation in the process of incorporating the sentiment analysis methodology for various languages into the PerceptionAnalytics platform.
I am also thankful to many individuals who collaborated with me: Janez Kranjc for the cooperation in implementation of ClowdFlows components and workflows related to my research, for training several language classifiers for distinguishing between tweets written in different, but similar languages, and for cooperation in the Bulgarian elections analysis use case; Dragi Kocev for his help in the statistical evaluation of the results, and inspecting and annotating a sample of Bulgarian political tweets; Vladimir Kuzmanovski for discussions concerning the statistical tests; Ulli Spankowski and Sebastian Schroff for their cooperation as financial experts in the stock analytics application; Martin Saveski for his help regarding Twitter data acquisition and active learning, suggesting the use of sofia-ml library and SWIG, and implementation of several supporting functions for the active learning algorithms; Peter Ljubič for his support in obtaining financial tweets; Matjaž Juršič for the cooperation and support related to the Twitter data manipulation for the annotation platform; Tomaž Erjavec for providing a dataset of smiley-labeled Slovene tweets; Igor Mozetič for providing useful suggestions and comments on my research and written material, and the collaboration in the Bulgarian elections analysis use case. I am particularly grateful to Miha Grčar for formulating the topic of my dissertation, providing many useful ideas (for example, about the concept of the neutral zone), his support and valuable discussions during my research, and for data, code, and advices when performing the analysis of the Slovenian elections use case.
I am grateful to all the colleagues at the Department of Knowledge Technologies for
1
http://www.sowalabs.com/.
viii
contributing to a positive, pleasant, and friendly working environment, especially to the ones I shared my office with and had many inspiring discussions: Senja, Jan, Vladimir, Borut, Matjaž, and Vid.
Thanks to all my dear longtime friends in Banja Luka and new friends in Ljubljana for always believing in me, making me laugh, and being true friends. Thank you Ana, Sanja, Saška, Milica, Marijana, Bojana, Jelena, and Daniela. Also, I would like to thank my colleagues from the Faculty of Electrical Engineering in Banja Luka for their friendship and encouragement during the years of my PhD study.
Especially, I am grateful to my dear Marko for always being there for me, sincerely celebrating my achievements, and supporting and calming me down in the most difficult moments.
Last, but not least, I am thankful to all the members of my family. Particularly, I am deeply grateful to my parents, Nedim and Besima, and sister Berina, for their endless support and faith in me. I love you so much.
ix
Abstract
Predicting future events has always been an interesting task — from predicting weather and natural catastrophes to predicting sport outcomes, election results, and stock market assets. It seems that it is in the human nature to try to guess or calculate what will happen next. Moreover, with the advancement of computer science and methodologies for data analysis, predicting future trends and events has become easier and more accurate. Motivated by these phenomena and earlier studies, this dissertation investigates whether the opinions expressed in Twitter microblogging posts (tweets), which discuss selected companies, can indicate their future stock price changes. To detect expressed opinions we rely on sentiment analysis, a research area concerned with detecting opinions, attitudes, and emotions in texts.
In order to adjust sentiment analysis to the specific nature of Twitter messages, the thesis first presents the experiments which resulted in selecting the most suitable sentiment analysis algorithm and determining the best Twitter preprocessing setting.
An analysis whether tweets sentiment can be used for predicting stock market prices is presented in two settings: the static and the dynamic setting. In the static setting, the sentiment classifier is trained once and remains unchanged, while the dynamic setting allows its adaptation to streams of continuously arriving Twitter messages. The adaptation is performed using active learning, which periodically asks an oracle to manually label a selected set of instances. The labeled instances are used for updating the classifier.
Due to the fact that tweets do not necessarily express positive or negative opinions, the concept ofneutral zone was used, which allowed us to employ a binary Support Vec-tor Machine (SVM) classifier to classify tweets into three sentiment categories of positive, negative, and neutral (instead of positive and negative only). The thesis presents two definitions of the neutral zone, i.e., the fixed neutral zone and the relative neutral zone. Moreover, an indicator for predictive tweet sentiment analysis in finance, positive senti-ment probability, is formalized. In the static setting, the Granger causality test showed that sentiments in stock-related tweets could be used as indicators of stock price move-ments a few days in advance, where improved results were achieved by employing the neu-tral zone, especially for the case of the relative neuneu-tral zone. These findings were adopted in the development of a new methodology for stream-based active learning approach to sentiment analysis, applicable in incremental learning from continuously changing streams of Twitter posts. A series of experiments was conducted to determine the best active learning setting for sentiment analysis in streams of tweets discussing finances of a given company.
Selected parts of the study were made publicly available through the ClowdFlows interactive data mining platform. Our sentiment analysis methodology is used also in the PerceptionAnalytics platform, which provides insights into happenings on popular social media Web sites.
The developed sentiment analysis methodology was successfully used in real-world ap-plications for montoring the public sentiment related to Slovenian and Bulgarian elections.
xi
Povzetek
Napovedovanje dogodkov je že od nekdaj zanimiva naloga — od napovedovanja vremena in naravnih katastrof do napovedovanja športnih rezultatov, rezultatov volitev in bor-znih vrednosti. Ugibanje in napovedovanje, kaj se bo zgodilo, je očitno v človeški naravi. Z napredkom računalništva in metodologij za analizo podatkov je postalo napovedova-nje prihodnjih trendov in dogodkov lažje in bolj natančno. Motivirani s temi pojavi in predhodnimi študijami v tej disertaciji raziskujemo, ali izražena mnenja v kratkih sple-tnih Twitter sporočilih, ki govorijo o določenih podjetjih, lahko nakažejo bodoče gibanje cen njihovih delnic. Pri odkrivanju izraženih mnenj se zanašamo na analizo sentimenta, raziskovalno področje, ki se ukvarja z odkrivanjem mnenj, stališč in čustev v besedilih.
Za prilagoditev analize sentimenta na specifično naravo Twitter sporočil disertacija najprej predstavi poskuse, s katerimi izberemo najprimernejši algoritem za analizo senti-menta in najprimernejšo predobdelavo za tovrstne podatke.
Analiza uporabnosti sentimenta Twitter sporočil za napovedovanje borznih cen je nare-jena na dva načina: statično in dinamično. Pri statičnem načinu je klasifikator sentimenta naučen enkrat in ostane nespremenjen, medtem ko dinamični način omogoča njegovo pri-lagoditev tokovom nenehno prihajajočih Twitter sporočil. Pripri-lagoditev je izvedena z upo-rabo aktivnega učenja, ki redno povprašuje po pravih oznakah za določene primere, ki se nato uporabijo za posodobitev klasifikatorja.
Ker Twitter sporočila ne izražajo vedno pozitivnih ali negativnih mnenj, smo upora-bili koncept nevtralne cone, kar nam je omogočilo, da uporabimo klasifikator z metodo podpornih vektorjev za razvrščanje Twitter sporočil v pozitivno, negativno in nevtralno kategorijo (namesto le v pozitivno in negativno). Disertacija predstavlja dve definiciji nevtralne cone: fiksno nevtralno cono in relativno nevtralno cono. Formaliziran je tudi indikator verjetnosti pozitivnega sentimenta za napovedno analizo sentimenta na podlagi Twitter sporočil na področju financ. V statičnem načinu je Grangerjev test vzročnosti pokazal, da bi se sentiment v Twitter sporočilih, povezanih z delnicami, lahko uporabljal kot kazalec gibanja cen delnic za nekaj dni vnaprej, pri čemer so bili izboljšani rezultati doseženi z uporabo nevtralne cone, še posebej v primeru relativne nevtralne cone. Te ugotovitve so bile uporabljene pri razvoju nove metodologije za aktivno učenje v analizi sentimenta iz tokov podatkov, ki se lahko uporablja za inkrementalno učenje v nenehno spreminjajočih se tokovih Twitter sporočil. Izvedli smo niz poskusov za določitev najbolj-šega načina aktivnega učenja za analizo sentimenta v tokovih Twitter sporočil o financah določenega podjetja.
Izbrani deli študije so javno dostopni kot del platforme za interaktivno podatkovno ru-darjenje ClowdFlows. Naša metodologija analize sentimenta se uporablja tudi v platformi PerceptionAnalytics, ki omogoča vpogled v dogajanje na priljubljenih spletnih straneh socialnih medijev.
Razvita metodologija analize sentimenta je bila uspešno uporabljena v aplikacijah za spremljanje sentimenta javnosti v zvezi s slovenskimi in bolgarskimi volitvami.
xiii
Contents
List of Figures xvii
List of Tables xix
List of Algorithms xxi
Abbreviations xxiii
Symbols in Twitter Messages xxv
1 Introduction 1
1.1 Sentiment Analysis of Microblogging Posts . . . 1
1.2 Twitter Sentiment Analysis in Data Streams . . . 3
1.3 Motivation for Stock Market Analysis . . . 5
1.4 Hypothesis and Goals . . . 6
1.5 Scientific Contributions . . . 8
1.6 Organization of the Dissertation . . . 10
2 Related Work 11 2.1 Sentiment Analysis . . . 11
2.1.1 Sentiment Analysis in Stock Market Prediction . . . 12
2.1.2 Sentiment Analysis in Election Campaigns . . . 15
2.2 Active Learning . . . 17
2.2.1 Stream-based Active Learning . . . 18
3 Sentiment Classification 21 3.1 Methodology . . . 21
3.1.1 Sentiment Analysis Algorithm . . . 22
3.1.2 Data Preprocessing . . . 23
3.2 Experimental Setting . . . 25
3.2.1 Datasets . . . 25
3.2.2 Sentiment Analysis Algorithm Selection . . . 26
3.2.3 Preprocessing Experiments . . . 27
3.3 Experimental Results . . . 27
3.3.1 Selection of the Sentiment Analysis Algorithm . . . 27
3.3.2 Preprocessing Experiments . . . 28
3.3.3 Comparison with Publicly Available Sentiment Classifiers . . . 31
3.4 Methodology and Results Summary . . . 33
4 Static Predictive Twitter Sentiment Analysis 35 4.1 Methodology . . . 35
xiv Contents
4.1.1.1 Fixed Neutral Zone . . . 36
4.1.1.2 Relative Neutral Zone . . . 36
4.2 Experimental Setting . . . 37
4.2.1 Financial Dataset . . . 37
4.2.2 Correlation Between Tweet Sentiment and Stock Closing Price . . . 39
4.3 Experimental Results . . . 40
4.3.1 Two-class Sentiment Classification . . . 40
4.3.2 Three-class Sentiment Classification . . . 41
4.3.3 Comparison of the Developed Sentiment Classifier with the Publicly Available Sentiment Classifiers in the Three-class Setting . . . 43
4.4 Methodology and Results Summary . . . 44
5 Dynamic Predictive Twitter Sentiment Analysis 47 5.1 Methodology . . . 47
5.1.1 Measuring Performance in a Streaming Setting . . . 48
5.1.2 Dynamic Neutral Zone . . . 50
5.2 Experimental Setting . . . 50
5.2.1 Implementation . . . 50
5.2.2 Data Preparation . . . 51
5.2.3 Active Learning Query Strategies . . . 51
5.3 Experimental Results . . . 52
5.3.1 Selecting the Active Learning Strategy . . . 53
5.3.2 Stock Market Analysis . . . 56
5.4 Methodology and Results Summary . . . 59
6 Implementations and Applications 61 6.1 Implementations in the ClowdFlows Platform . . . 61
6.1.1 Sentiment Analysis Widget . . . 62
6.1.2 Sentiment Analysis with Active Learning Workflow . . . 64
6.1.3 Bulgarian Parliamentary Elections Workflow . . . 66
6.2 Implementations in the PerceptionAnalytics Platform . . . 67
6.2.1 Sentiment Analysis for Multiple Languages . . . 68
6.3 Real-time Opinion Monitoring: Slovenian Presidential Elections Use Case . 69 6.3.1 Twitter Sentiment Analysis . . . 69
6.3.2 Analysis of the Election Results . . . 71
6.3.3 Social Media Analysis Platform . . . 72
6.4 Real-time Opinion Monitoring: Bulgarian Parliamentary Elections Use Case 74 6.4.1 Overview of the Approach . . . 74
6.4.2 Twitter Sentiment Analysis . . . 75
6.4.3 Analysis of Election Results . . . 78
6.4.4 Public Availability of the Implemented Methodology and Results . . 80
7 Conclusions, Further Work, and Lessons Learned 83 7.1 Conclusions . . . 83
7.2 Further Work . . . 84
7.3 Lessons Learned . . . 85
Appendix A Assessment of the Smiley-Labeled Approximation 89 Appendix B Granger Causality Correlation Between Tweet Sentiment
Contents xv
Appendix C Granger Causality Correlation Between Tweet Sentiment
and Stock Prices Using the Relative Neutral Zone 97
References 101
Bibliography 111
xvii
List of Figures
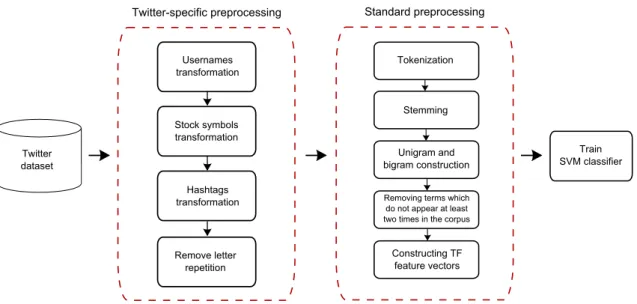
Figure 1.1: The phases of sentiment analysis in streams of Twitter posts related to the CRISP-DM process model. . . 9 Figure 3.1: Methodological steps for Twitter-specific and standard preprocessing
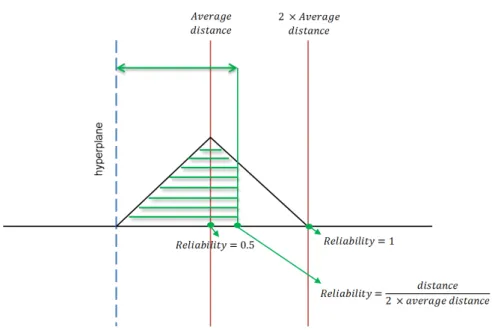
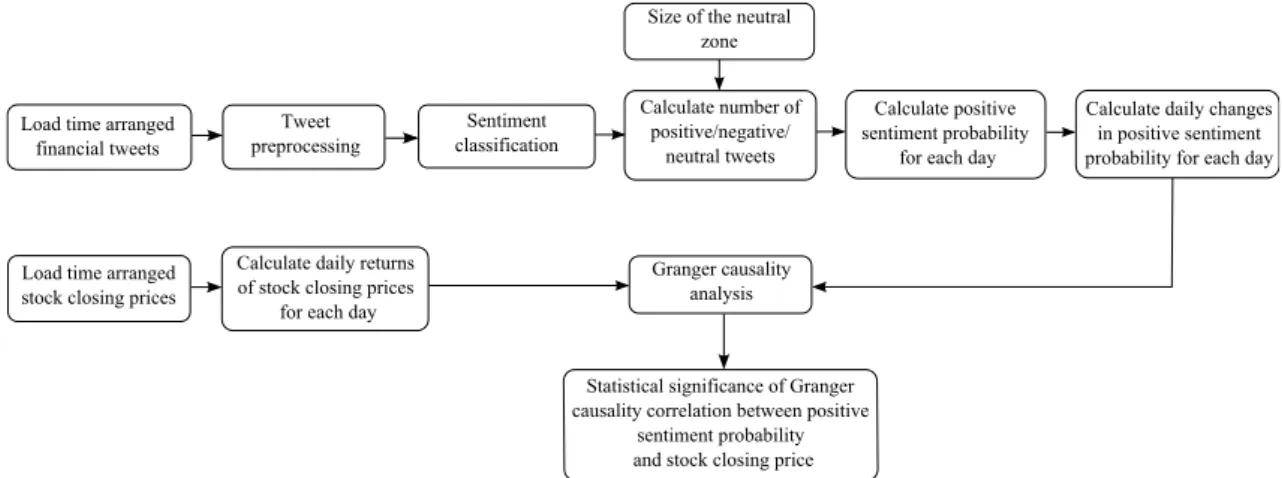
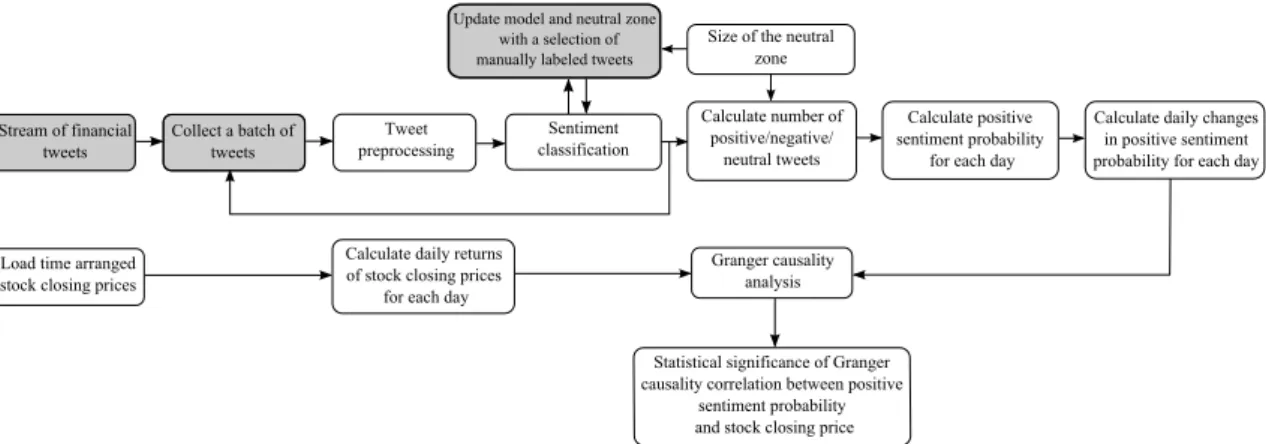
for Twitter microblogging posts. . . 34 Figure 4.1: Reliability as a function of the distance from the SVM hyperplane. . . 37 Figure 4.2: Methodological steps for predictive sentiment analysis applied to
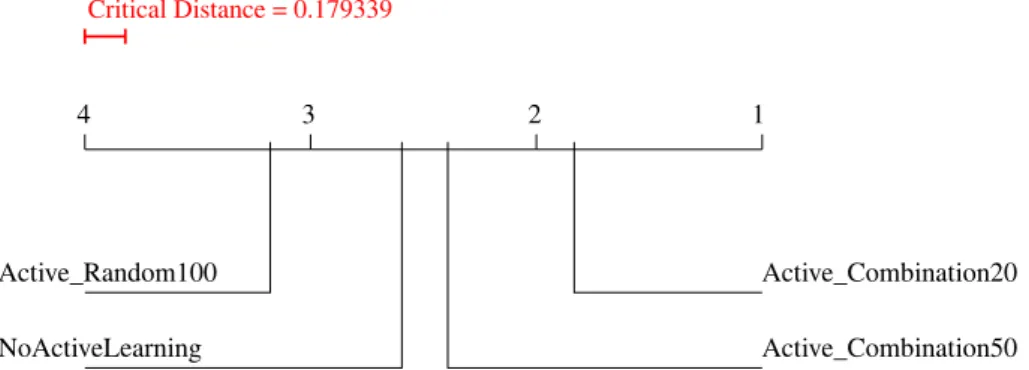
deter-mine the correlation between tweets sentiment and stock closing prices. 44 Figure 5.1: Visualisation of Nemenyi post-hoc tests for the active learning
strate-gies on data from Table 5.2. . . 55 Figure 5.2: Visualization of Nemenyi post-hoc tests for the “Select 10 of 50” batch
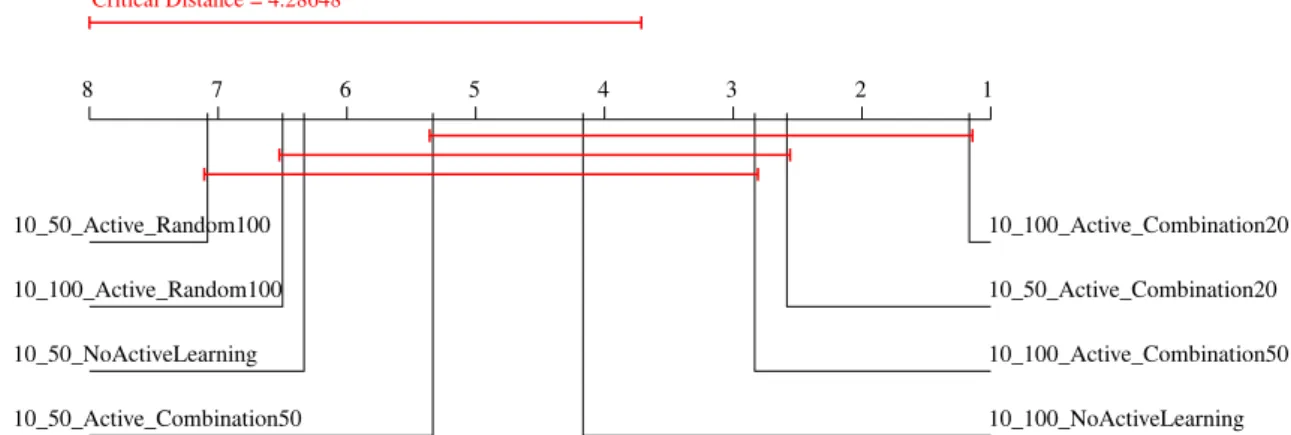
selection for α= 0.1. . . 56 Figure 5.3: Visualization of Nemenyi post-hoc tests for the “Select 10 of 100” batch
selection for α= 0.1. . . 56 Figure 5.4: Screenshot from the Google Finance web page showing stock prices
and key events. It can be observed that most of the key events in 2011 happened in the period from June to August. We hypothesize that this resulted in a higher media exposure and, consequently, enabled discussions and speculations about price movements in social media. . . 58 Figure 5.5: Simulation of online experiments from Smailović, Grčar, Lavrač, and
Žnidaršič (2014) for predicting values of future stock prices in real-time. The x-axis presents the dates, while the y-axis shows the sum of money and stocks values. . . 58 Figure 5.6: Methodological steps for stream-based active learning for Twitter
senti-ment analysis in finance. Components which are specific to the stream-based setting and are not present in the static setting (Figure 4.2) are colored gray. . . 59 Figure 6.1: An example of several connected widgets for obtaining Twitter
mes-sages, filtering them by language and performing sentiment analysis. A selected input for the first widget of the workflow, i.e., a “Twitter” widget input, and selection of outputs of the last widget of the work-flow, i.e., “Add neutral zone” widget outputs, are also presented. . . 63 Figure 6.2: The workflow for Twitter sentiment analysis which collects tweets from
the Twitter API, filters them by language, performs sentiment analysis, and shows the results in the form of a sentiment graph, word clouds, and most recent individual tweets. . . 63 Figure 6.3: The workflow in the ClowdFlows platform for Twitter sentiment
xviii List of Figures
Figure 6.4: The labeling interface in the ClowdFlows platform as a part of active learning. Tweets are initially labeled as neutral, while the user can manually label them also as positive or negative. Twitter usernames are blurred in order to hide personal information. . . 65 Figure 6.5: Default parameters for the active learning widget in ClowdFlows, which
can be changed by the user. . . 66 Figure 6.6: The workflow for Twitter sentiment analysis in the Bulgarian elections
use case. . . 67 Figure 6.7: A part of an analysis report in the PerceptionAnalytics platform. . . . 68 Figure 6.8: A screenshot of the PerceptionAnalytics platform showing individual
tweets and the attached sentiment. Usernames and images are blurred in order to hide personal information. . . 70 Figure 6.9: The social media analysis platform for monitoring sentiment in
Twit-ter messages discussing candidates of the 2012 Slovenian presidential elections. . . 73 Figure 6.10: A flowchart of obtaining the hand-labeled training dataset, training the
Twitter sentiment classifier, and applying it to real-time Twitter data. . 74 Figure 6.11: The graph from the annotation platform presenting the number of
an-notations of general Bulgarian tweets performed by twelve annotators between April 16 and April 29, 2013. Phases after which new sentiment classifiers were trained are additionally marked with vertical lines. . . . 76 Figure 6.12: The number of positive, neutral, and negative hand-labeled general
Bulgarian tweets in each annotation phase. . . 76 Figure 6.13: The 10-fold cross validation accuracy on positive and negative tweets
after each annotation phase. . . 77 Figure 6.14: The ROC points for “positive vs. negative and neutral tweets” by
varying the reliabilityR from 0 to 0.5. . . 78 Figure 6.15: The ROC points for “negative vs. positive and neutral tweets” by
varying the reliabilityR from 0 to 0.5. . . 78 Figure A.1: Number of tweet posts classified as positive or negative, their difference,
the moving average of the difference (averaged over 5 days), and the stock closing price per day for Baidu. . . 91 Figure A.2: Number of hand-labeled positive and negative tweet posts, their
differ-ence, the moving average of the difference (averaged over 5 days), and the stock closing price per day for Baidu. . . 91 Figure A.3: The moving average of the difference (averaged over 5 days) for
hand-labeled positive and negative tweets and the ones classified as positive or negative by the SVM sentiment classifier. . . 92
xix
List of Tables
Table 3.1: List of emoticons used for labeling the training set. . . 26 Table 3.2: Evaluation performance (accuracy) for different approaches to sentiment
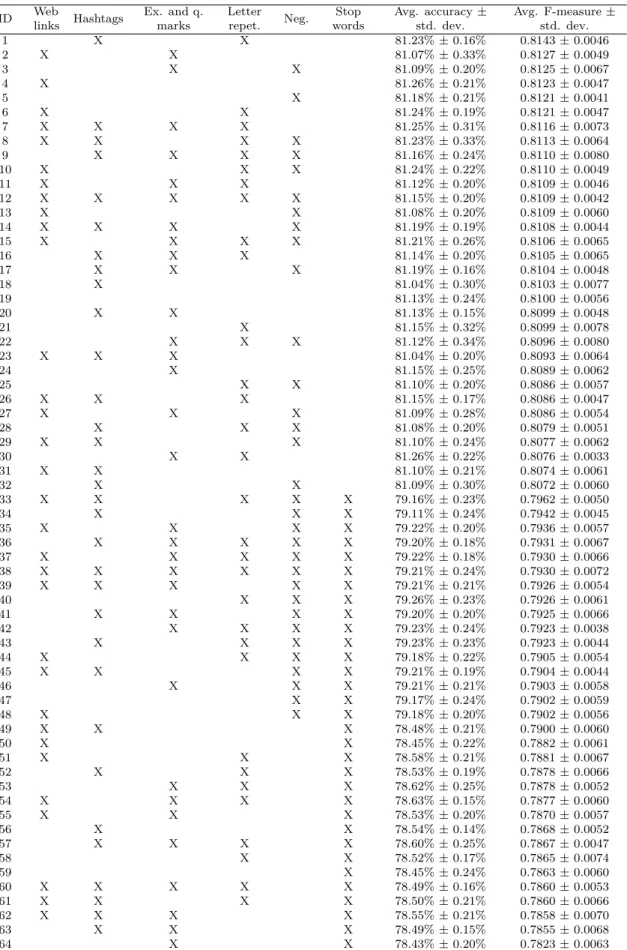
analysis on the test set. . . 28 Table 3.3: SVM classifier performance for various preprocessing settings measured
by applying the stratified ten-fold cross-validation method on 1,600,000 smiley-labeled tweets. Applied settings are marked with the “X” sign. . 30 Table 3.4: Evaluation performance (accuracy) on the test set for the developed
sentiment classifier and several publicly available sentiment analysis tools. 33 Table 4.1: Statistical significance (p-values) of Granger causality correlation
be-tween positive sentiment probability and closing stock price for Baidu, while changing the size of the fixed neutral zone (i.e., thetvalue) from 0 to 1. Values which are lower than the p-value of 0.1, after applying the Bonferroni correction, are marked in bold. . . 41 Table 4.2: Statistical significance (p-values) of Granger causality correlation
be-tween positive sentiment probability and closing stock price for Baidu, while changing the value of reliability threshold. Values which are lower than the p-value of 0.1, after applying the Bonferroni correction, are marked in bold. . . 43 Table 4.3: Evaluation performance (accuracy) on the test set in the three-class
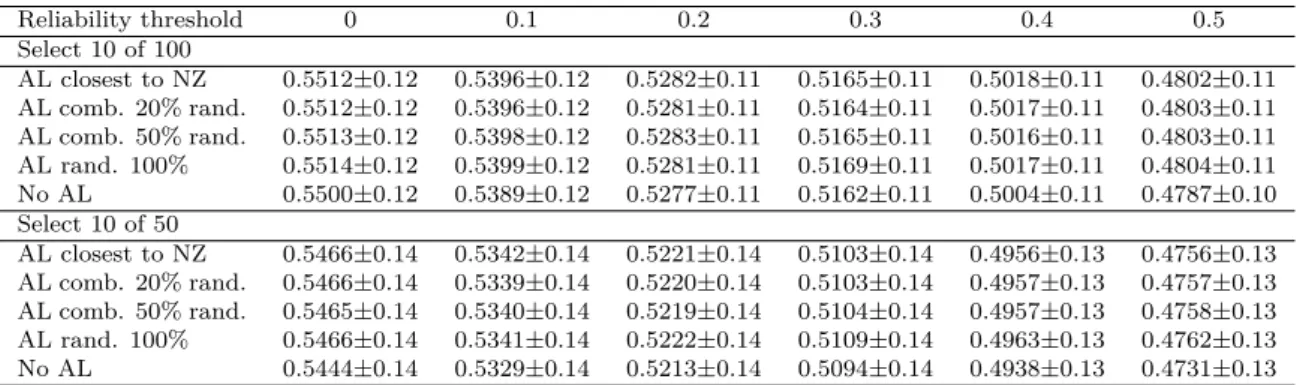
set-ting for the developed sentiment classifier and several publicly available sentiment analysis tools. . . 44 Table 5.1: Values of average F-measure ± std. deviation for different strategies,
while changing the size of the reliability threshold forα= 0. . . 54 Table 5.2: Values of average F-measure ± std. deviation for different strategies,
while changing the size of the reliability threshold forα = 0.1. Signifi-cance of differences in performance of the strategies can be observed in Figures 5.1, 5.2, and 5.3. . . 54 Table 5.3: Statistical significance (p-values) of Granger causality correlation
be-tween positive sentiment probability and the closing stock price for Baidu using active learning, while changing the value of the reliabil-ity threshold. Two combined strategies for selecting 10 of 100 tweets for labeling are presented. Values which are lower than ap-value of 0.1, after applying the Bonferroni correction, are marked in bold. . . 57 Table 6.1: Results of the first round of the 2012 Slovenian presidential elections,
predicted results, and number of tweets per candidate. . . 72 Table 6.2: Number of positive, negative and neutral tweets, and volume of tweets
xx List of Tables
Table 6.3: The number and the percentage of positive, neutral, and negative tweets per party before the 2013 Bulgarian parliamentary elections. . . 80 Table 6.4: Actual election results, tweet volume, and difference between the
nega-tive and posinega-tive tweets per party before the 2013 Bulgarian parliamen-tary elections. . . 80 Table 6.5: The number and the percentage of positive, neutral, and negative tweets
per party after the 2013 Bulgarian parliamentary elections. . . 81 Table 6.6: Election results, volume of tweets, and difference between the negative
and positive tweets per party after the 2013 Bulgarian parliamentary elections. . . 81 Table 7.1: SVM sentiment classifier performance results and average number of
features for several values of the maximumn-gram length. . . 87 Table A.1: The most relatively positive and negative sentiment-bearing terms from
the smiley-labeled Stanford dataset. . . 90 Table B.1: Statistical significance (p-values) of Granger causality correlation
be-tween positive sentiment probability and closing stock price for 8 com-panies, while changing the size of the fixed neutral zone, i.e., thetvalue from 0 to 1. Values which are lower than ap-value of 0.1, after applying the Bonferroni correction, are marked in bold. . . 93 Table C.1: Statistical significance (p-values) of Granger causality correlation
be-tween positive sentiment probability and closing stock price for 8 com-panies, while changing the reliability threshold from 0 to 1. Values which are lower than ap-value of 0.1, after applying the Bonferroni correction, are marked in bold. . . 97
xxi
List of Algorithms
xxiii
Abbreviations
API . . . Application Programming Interface
BOW . . . Bag-Of-Words
DJIA . . . Dow Jones Industrial Average EDT . . . Eastern Daylight Time EMH . . . Efficient Market Hypothesis EST . . . Eastern Standard Time GUI . . . Graphical User Interface HTML . . . HyperText Markup Language HTTP . . . HyperText Transfer Protocol ILP . . . Inductive Logic Programming IP . . . Internet Protocol
IR . . . Information Retrieval JSON . . . JavaScript Object Notation k-NN . . . k-Nearest Neighbors
LDA . . . Latent Dirichlet Allocation MAE . . . Mean Absolute Error
NASDAQ . . . National Association of Securities Dealers Automated Quotations
NB . . . Naive Bayes
NLP . . . Natural Language Processing POS . . . Part-Of-Speech
ROC . . . Receiver Operating Characteristic S&P 500 . . . Standard & Poor’s 500
SVM . . . Support Vector Machine
TF . . . Term Frequency
TF-IDF . . . Term Frequency-Inverse Document Frequency URL . . . Uniform Resource Locator
UTC . . . Coordinated Universal Time
WSDL . . . Web Services Description Language XML . . . Extensible Markup Language
xxv
Symbols in Twitter Messages
@ . . . at symbol. The at symbol is used for referring to a specific Twitter user by writing his username in the form@username.
# . . . hash symbol. Writing together the hash symbol and a phrase in a Twitter message represents a topic or a keyword associated with the message.
$ . . . dollar sign. Writing the dollar sign and a ticker symbol in Twitter messages is used for discussing stocks of a company (e.g., “$GOOG” for Google stocks).
1
Chapter 1
Introduction
The topic of this dissertation is the analysis of sentiment in streams of microblogging posts. In this chapter, we first provide a general introduction to social networking and microblogging services and application of sentiment analysis on messages from such ser-vices. Moreover, since we address sentiment analysis in data streams, we also introduce the method used to achieve this — the active learning approach. Our analyses are mainly performed in the context of finances, since we apply sentiment analysis on posts discussing the financial aspect of a company and examine whether there is a relationship between the sentiment and the company’s future stock prices. In this chapter we explain the moti-vation for studying this relation. We also state the research hypotheses, the main goals of the dissertation, and its contribution to science. Finally, we describe how the dissertation is organized.
1.1
Sentiment Analysis of Microblogging Posts
In recent years, an extremely large growth of the Internet usage has been observed.1 This phenomenon is usually attributed to the availability of new technologies and devices, simple usage and a number of benefits it brings (for example, availability of huge amounts of information, data, and fast communication with people from all around the world). Nowadays, the number of Internet users is measured in billions and it is estimated that by the end of year 2014, around 40% of the world population will use the Internet, which is nearly 3 billion people.2 For comparison, in year 1995, only 0.4% of the population (or 16 million people) was using the Internet3 (Hubbard, 2011). The Internet has changed the way we communicate, search for information, do our business. It even affects our daily life. A number of new Web sites, technologies, and tools have been developed for use on the Internet. Among them, many social networking and microblogging services have been developed and became very popular.
While microblogging services allow their users to read and post short messages, social network Web sites add a more personal feel. Using social network Web sites the users have the possibility to create personal profiles, post content (personal statuses, texts, pictures, or videos), interact with other users or applications, join different groups, etc. The most
1
Information retrieved from “World Internet population has doubled in the last 5 years”, http://royal. pingdom.com/2012/04/19/world-internet-population-has-doubled-in-the-last-5-years/, the URL accessed on September 4, 2014.
2
Information retrieved from “The world in 2014: ICT facts and figures”, http://www.itu.int/en/ITU-D/ Statistics/Documents/facts/ICTFactsFigures2014-e.pdf, the URL accessed on August 6, 2014.
3
Information retrieved from “Internet growth and stats”, http://www.allaboutmarketresearch.com/ internet.htm, the URL accessed on August 6, 2014.
2 Chapter 1. Introduction
popular two social networking Web sites are Facebook and Twitter.4 Facebook5 is a social networking Web site which was founded in 2004 and since then it has grown into a global network with 1.23 billion monthly active users (Sedghi, 2014). On the other hand, Twitter6 is both a social networking and microblogging service, founded in 2006, which rapidly gained global popularity with 271 million monthly active users (Smith, 2014). Twitter allows its users to post short messages consisting of up to 140 characters, via the Twitter website, SMS, or various applications for mobile devices. Twitter messages are known as tweets. Besides writing textual messages, the users also have the possibility to upload photos or short videos. On average, around 6,000 tweets are posted every second, leading to 500 million tweets daily, and about 200 billion tweets per year.7 Besides for the individual usage, Twitter is also particularly interesting for corporations as it allows for viral marketing and news updates (Romero, Galuba, Asur, & Huberman, 2011).
As a consequence of the popularity of the Internet, social networking, and micro-blogging Web sites, a large increase of on-line user generated content has been observed. More and more people post messages about their observations, opinions, and emotions about various subjects — individuals, companies, political parties, movements, or im-portant events. Consequently, many researchers are interested in analyzing such large amounts of data in order to gain useful knowledge from it. Data from social network and microblogging Web sites is interesting and suitable for analyses because of its large volume, popularity, and capability of near-real-time publishing. This massive amount of data represents a relevant source for gathering people’s viewpoints and opinions.
The Twitter data is particularly appropriate for our study since Twitter is the most popular microblogging service in the financial community (Sprenger, Tumasjan, Sandner, & Welpe, 2013), and we are mainly interested in the financial domain. Consequently, the analysis of Twitter data can provide the insights into opinions and discussions about finances. In order to analyze opinions in tweets, we apply sentiment analysis, which is the research area aiming at detecting the author’s attitude, emotions, or opinion about a given topic expressed in text (B. Liu, 2010, 2012; Medhat, Hassan, & Korashy, 2014; Pang, Lee, & Vaithyanathan, 2002; Pang & Lee, 2008; Turney, 2002), where the word “sentiment” represents an attitude, view, or opinion caused by emotion.
In the context of analyzing user generated content from the Internet, the task of sentiment analysis is especially challenging since such data often contains slang (Petz et al., 2012). Moreover, messages from social media Web sites are considered noisy also for other reasons; for example, they usually contain grammatical and spelling mistakes (Petz et al., 2013). Therefore, it is important to perform appropriate preprocessing of such data in order to prepare it in the best possible way as input of sentiment analysis algorithms.
A basic task in sentiment analysis is to classify text as being positive, negative, or neutral. While some approaches perform more complex analyses (e.g., determining several dimensions of emotional states, classifying a text on a scale, for example -5 (most negative) to +5 (most positive), detecting the entity or feature discussed in a text to which the sentiment is attached, etc.), in this study we address basic sentiment analysis of Twitter messages, classifying them into two (positive or negative) or three sentiment categories (positive, negative, and neutral).
There exist several approaches which can be applied to perform sentiment analysis, i.e., the machine learning, lexicon-based, and linguistic approach (Thelwall, Buckley, &
4
Information retrieved from “Top 15 Most Popular Social Networking Sites | August 2014”, http:// www.ebizmba.com/articles/social-networking-websites, the URL accessed on August 6, 2014.
5
http://www.facebook.com.
6http://www.twitter.com. 7
Information retrieved from “Internet Live Stats: Twitter Usage Statistics”, http://www. internetlivestats.com/twitter-statistics/, the URL accessed on August 7, 2014.
1.2. Twitter Sentiment Analysis in Data Streams 3
Paltoglou, 2011). The linguistic approach (Thet, Na, Khoo, & Shakthikumar, 2009; Wil-son, Wiebe, & Hwa, 2006) analyzes the grammatical structure of the text to determine its sentiment polarity. This approach tends to be computationally demanding, which is a serious drawback for use in a streaming setting. Lexicon-based methods (Smailović, Žnidaršič, & Grčar, 2011; Taboada, Brooke, Tofiloski, Voll, & Stede, 2011) employ senti-ment lexicons for determining the sentisenti-ment in text. These methods are faster, but they are usually unable to adapt to changes which may occur in data streams. The machine learning approach (Pang et al., 2002) requires a data collection for learning a classifier. In the case of supervised machine learning the data must also be labeled. For Twitter sen-timent analysis in data streams we find the supervised machine learning approach to be the most suitable one, thus this is the one we use in our study. This decision is supported also by the experiments presented in Section 3.3.1.
1.2
Twitter Sentiment Analysis in Data Streams
In this dissertation, we are interested also in dynamic tweet analysis, i.e., in adapting the Twitter sentiment analysis to data streams, where a data stream represents a sequence of data elements that continuously arrive from a data source (in our case, the Twitter API). A data stream can be interpreted as a stochastic process where new data elements arrive constantly and individually from each other (Gama, 2010).
In recent years, with the possibility of accessing the information in real-time, extracting knowledge from data streams has gained a high interest of the research community (Gaber, Zaslavsky, & Krishnaswamy, 2005). In a setting where huge amounts of data arrive continuously, the need for real-time analysis poses many challenges (Krempl et al., 2014) — for example, handling of changes in the stream, taking care of incomplete and delayed data instances, proper evaluation of stream-based algorithms, etc. Streaming data and its analysis is in several aspects different from non-streaming data. For example, in the context of data stream mining, an algorithm does not have information about future data instances and the order in which they will arrive from the data stream (Gama & Gaber, 2007; Gama, 2010). Therefore, in streaming scenario, the algorithm has to extract knowledge in the best possible way in real-time from new incoming data instances. After an instance has been used, it can be saved to the memory or discarded. In the case of saving instances to the memory, one should ensure that there are enough resources (in terms of memory space and processing power) for handling potentially huge amounts of data. A previously seen instance can be accessed again only if there exist processes for its storage and retrieval (Gama & Gaber, 2007; Gama, 2010). In contrast to data stream mining, in the non-streaming scenario, one operates on a limited collection of data instances which are already stored in a database or a file and are always accessible.
Using and analyzing stream data for sentiment analysis makes sense when the informa-tion about the changes in the sentiment is time-critical and a proper data flow is available. For example, it is beneficial to apply such analysis in streams of financial tweets in order to detect expressed opinions about stocks in real-time. In such a scenario the timing of writing an opinion about a company’s finances is important for the investors and the rele-vant tweets for analysis can be obtained from the Twitter API in real-time. In this study, in order to adapt Twitter sentiment analysis to data streams, we use the active learning approach.
Active learning (Settles & Craven, 2008; Settles, 2009, 2011b) is a well-studied research area, addressing data mining scenarios where a learning algorithm can periodically select new instances to be manually labeled by a human annotator. These labeled instances are then added to the training dataset to improve the learner’s performance on new data.
4 Chapter 1. Introduction
The aim of active learning methods is to maximize the performance of the algorithm and minimize the human labeling effort. In our study, we employ the stream-based active learning approach, meaning that the learning algorithm has to decide in real-time whether to select an incoming instance from the data stream for manual labeling or not. Therefore, the approach which would handle this scenario has to:
• have constant access to a source of data,
• have the ability to quickly and in real-time process each incoming instance and decide whether to request a label for it, and
• periodically update the model and apply it to new instances.
On the one hand, the need for using active learning is a consequence of the scarcity of hand-labeled tweets available for sentiment analysis, which prevents the use of conventional machine learning methods. Namely, it is very difficult and costly to obtain large datasets of hand-labeled tweets, especially if they are domain specific. On the other hand, the static datasets and the resulting models can soon become outdated and, therefore, continuous learning that allows for adaptations to changes with time is inevitable to keep the models up-to-date. Moreover, active learning is typically used in the scenarios where there is a large number of unlabeled data instances available, but their labeling is expensive and time consuming, which is the case for domain specific tweets that can be easily obtained through the Twitter API, but their manual labeling requires domain expertise and specific knowledge.
There are several advantages in employing stream-based active learning to sentiment analysis. First, the approach to sentiment analysis is extended with a capability of contin-uously adapting the sentiment classifier to changes in a data stream while incorporating selected new hand-labeled instances into the model. By doing so, the sentiment vocabulary is updated with time as new terms occur in the incoming instances. This way, by applying the active learning approach, the sentiment classifier can be made more adaptable and domain specific.
The main challenge of active learning is the selection of the most suitable data instances for hand-labeling in order to achieve the highest prediction accuracy, while knowing that one cannot afford (in terms of time and costs) to label all the available instances (Zhu, Zhang, Lin, & Shi, 2007). There exist several categories of querying strategies for selecting the most suitable instances for hand-labeling (Settles, 2009): uncertainty sampling, query by committee, expected model change, expected error reduction, variance reduction, and density weighted methods. A detailed survey of query strategies and active learning is given in Settles (2009), while we provide only a brief overview of query strategies based on Settles (2009). Query algorithms based on uncertainty sampling select the instances for which the current learner has the highest uncertainty (Lewis & Gale, 1994). Algorithms based on query-by-committee use disagreement among a collection of learners to select new instances for hand-labeling (Freund, Seung, Shamir, & Tishby, 1997; Seung, Opper, & Sompolinsky, 1992). Expected model change query strategy selects the instances which would change the model the most (Settles, Craven, & Ray, 2008). Furthermore, expected error reduction query strategies select the instances which reduce the expected future er-ror (Roy & McCallum, 2001). Variance reduction strategies minimize the model’s output variance (Cohn, Ghahramani, & Jordan, 1996). Finally, in the density weighted scenario, the data instances for hand-labeling are chosen from maximal-density regions of the un-labeled instances (Donmez, Carbonell, & Bennett, 2007; Settles & Craven, 2008; Xu, Yu, Tresp, Xu, & Wang, 2003). The active learning approach we apply in this dissertation combines uncertainty sampling and random sampling.
1.3. Motivation for Stock Market Analysis 5
In the context of real-time processing of data stream instances, there are additional challenges when applying the active learning approach, such as the adaptation to changes in data distribution. The changes of statistical properties of data with time, which may occur in the data stream, are called concept drift. Žliobait˙e, Bifet, Pfahringer, and Holmes (2011, 2014) propose active learning strategies that explicitly manage concept drift in data streams, and are based on uncertainty, dynamic distribution of labeling effort over time, and randomization of the search space. Our active learning approach also employs randomization of the data stream search space, but unlike Žliobait˙e et al. (2011, 2014), we organize the examples into batches.
1.3
Motivation for Stock Market Analysis
In this dissertation we are primarily interested in the financial domain as we address the challenge of predicting the future value of stock market assets in the context of the explosive growth of social media and user-generated content on the Internet. Analysis of user-generated content which discusses finances poses several challenges. On the one hand, such texts are written using the specific vocabulary, and on the other hand, there is need for real-time analysis as the timing of writing an opinion about finances is important for the investors. We apply sentiment analysis and active learning techniques on Twitter microblogging posts that discuss the financial aspects of a company and examine whether there is a relationship between the tweet sentiment and future stock closing prices of a discussed company. With the term predictive sentiment analysis we denote an approach in which sentiment analysis is used to predict a specific phenomenon or its changes.
Predicting the future values of stock market assets is a challenge which has been investigated by numerous researchers. One of the reasons for addressing this challenge is the controversy of the efficient market hypothesis (EMH) (Fama, 1965b), which claims that stocks are always traded at their fair value. Based on this market theory all stocks are perfectly priced and it is impossible for traders to constantly outperform the average market returns. This hypothesis is based on the assumption that financial markets are informationally efficient, i.e., that the asset prices always reflect all the relevant public information about an asset at investment time.
The unpredictable nature of stock market prices was first investigated by Regnault (1863) and later by Bachelier (1900). Fama, who proposed the EMH, claimed that stock price movement is unpredictable (Fama, 1965a, 1965b). However, since the EMH is con-troversial, researchers from various disciplines (including economists, statisticians, finance experts, and data miners) have been investigating the means to predict future stock market prices. The findings vary: from those claiming that stock market prices are not predictable to those presenting opposite conclusions (Butler & Malaikah, 1992; Kavussanos & Dock-ery, 2001). The indication that there may be a relationship between emotions and stock market could be explained based on two findings (Bollen, Mao, & Zeng, 2011). On the one hand, it has been shown that emotions are crucial to thinking and social behavior (Damasio, 1995), and can influence the choice of actions. On the other hand, given that the opinions and emotions are propagated through social interactions, they can also be transferred through the investors to the stock market and consequently, the general mood of a society can be reflected in stock market values. As a result, the stock market can be considered as a measure of social mood (Nofsinger, 2005). Therefore, based on these findings, it is reasonable to expect that the analysis of the public mood can be used to predict price movements in the stock market, which is the hypothesis that we investigate in this dissertation.
6 Chapter 1. Introduction
accessible, besides the stock market applications, many researchers became interested in the predictive power of microblogging messages also in other domains: prediction of elec-tion results, predicelec-tion of the financial success of movies or books, etc. For example, it was shown that the frequency of blog posts can be used to forecast spikes in on-line consumer purchasing (Gruhl, Guha, Kumar, Novak, & Tomkins, 2005). Moreover, it was shown by Tong (2001) that there is a correlation between references to movies in newsgroups and their sales. Sentiment analysis of weblog data was successfully used to predict the financial success of movies (Mishne & Glance, 2006). Twitter microblogging posts were also shown to be useful for predicting box-office profit of movies before their release (Asur & Huberman, 2010). Even crime prediction can be advanced using Twitter data (Gerber, 2014). Therefore, in addition to the stock market use case, in this dissertation we also present the results on predicting the outcome of Slovenian and Bulgarian elections based on Twitter messages.
1.4
Hypothesis and Goals
The main aim of this dissertation is to develop a methodology for static and dynamic sen-timent analysis of Twitter microblogging posts for predicting a phenomenon of interest, providing an answer to a question whether real-time sentiment analysis of tweets can be used for prediction of movements in the stock market. In the static setting, the sentiment classifier is trained using a fixed predefined training dataset and it remains unchanged throughout the experiments, while in the dynamic setting, the sentiment classifier is con-tinuously updated with the new incoming tweets from the data stream using the active learning approach.
We first addressed a static Twitter data analysis problem, which was explored in order to determine the best Twitter-specific text preprocessing setting for training the sentiment classifier. A statistical causality test in the static setting showed that sentiment in stock-related tweets can be used as an indicator of stock price movements a few days in advance, where improved results were achieved by adapting the sentiment classifier to categorize Twitter posts into three sentiment categories of positive, negative, and neutral (instead of positive and negative only). These findings were then used in the development of a stream-based active learning approach to sentiment analysis, applicable in incremental learning from continuously changing financial tweet data streams.
The following hypotheses have been investigated:
1. Appropriate selection of preprocessing steps can improve the classification accuracy. 2. The proposed static methodology for predictive sentiment analysis on tweet data
streams is capable of predicting a (financial) phenomenon of interest.
3. Identifying also the non-opinionated tweets improves their predictive power, in terms of forecasting stock market assets, as compared to the approach which assumes that all the tweets are opinionated and categorizes them as positive and negative only. 4. The active learning approach improves upon the static methodology (in terms of
adapting the sentiment classifier to a specific domain and improving the F-measure of tweet sentiment classification) and improves its predictive power by adapting to changes in data streams.
5. The developed sentiment analysis methodology is applicable in real-world applica-tions.
1.4. Hypothesis and Goals 7
The goals of this dissertation can be divided into several groups, most of them con-sisting of several sub-goals:
1. Provide a critical review of related studies.
(a) Give an overview of existing sentiment analysis approaches in general and in the domain of stock market and election results prediction in particular. The overview should be concerned with social networking and microblogging mes-sages, emphasizing the existing work which has been done on Twitter data. (b) Provide an overview of approaches to active learning, with the emphasis on
stream-based active learning.
2. Propose the most suitable approach to sentiment analysis in streams of Twitter microblogging posts in terms of the sentiment analysis algorithm and data prepro-cessing. In order to do so, discuss the characteristics of available approaches, how they fit into the use case, and perform experiments to show the performance results of the selected approaches. When the approach to sentiment analysis is selected, compare it with the publicly available tools.
(a) Select the most appropriate classification algorithm for sentiment analysis of Twitter microblogging posts.
(b) Select the most appropriate preprocessing setting for Twitter microblogging posts.
(c) Propose an approach to identifying non-opinionated Twitter microblogging posts.
(d) Provide an overview of a selection of publicly available sentiment classifiers and compare them with the developed classifier.
3. Collect, manually label, and make publicly available large collections of Twitter data. (a) Collect the appropriate financial Twitter data from the Twitter API. The queries for the API should be carefully selected in order to retrieve the most relevant results.
(b) Acquire manual labels for the selected parts of the collected Twitter dataset. (c) Provide a public URL to the data, in accordance with the Twitter rules for data
distribution.
4. Propose a new static and dynamic stream-based active learning methodology for predictive tweet sentiment analysis in finance.
(a) Propose an indicator for predictive tweet sentiment analysis in finance.
(b) Propose, implement, and evaluate static and dynamic methodology for predic-tive sentiment analysis of Twitter microblogging posts.
(c) Present a data visualization approach to detect interesting events in classified data time series.
5. Apply the sentiment analysis methodology in real-life situations and examine its suitability for different data and application domains.
8 Chapter 1. Introduction
1.5
Scientific Contributions
This thesis contributes to the sentiment analysis and active learning research, and partly to better understanding of phenomena in financial stock markets. The scientific contributions (1-6) and contributions to practice (7-9) of this dissertation are the following:
1. Overview of the state of the art of existing sentiment analysis on social networking and microblogging messages, focusing on the research concerned with Twitter data, predicting stock market values and election outcomes.
2. State of the art overview of active learning approaches for data streams.
3. A systematic assessment and proposal of the best Twitter data preprocessing setting. 4. Proposing an approach to identifying non-opinionated Twitter messages.
5. Formalization of an indicator for predictive tweet sentiment analysis in finance. 6. Formalization, implementation, and evaluation of a methodology for static and
dy-namic predictive analysis of Twitter posts.
7. Collection of manually labeled and publicly available financial Twitter data, as a first large (in the sense of labeling effort) publicly available dataset of its kind. 8. Successful application of the developed sentiment analysis approach in two real-life
domains.
9. Development of software tools and components for enabling public availability of selected parts of the research.
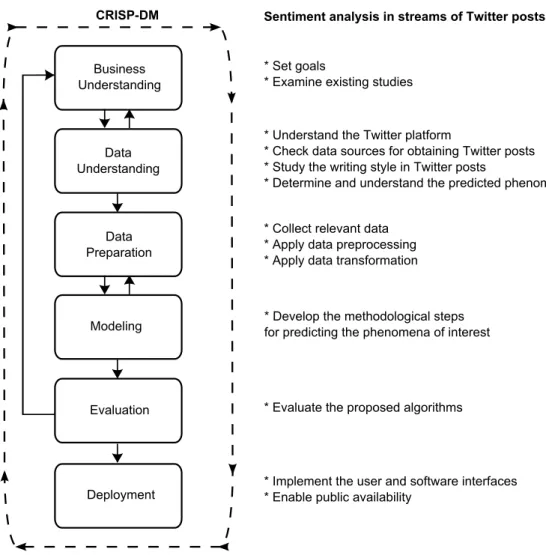
In relation to the CRISP-DM process model (Shearer, 2000), the third contribution belongs to the Data Preparation phase (and partly also to Data Understanding), and contributions 4, 5, and 6 to the Modeling phase. The Deployment phase of CRISP-DM is covered by contributions 8 and 9. Relations between the CRISP-DM process model phases and our methodological steps are presented in Figure 1.1.
In summary, the main contributions of this thesis are an approach to identifying non-opinionated Twitter messages (aplicable in both the static and dynamic setting) and a new methodology for stream-based active learning for tweet sentiment analysis in finance, which can be used on continuously changing tweet streams. A series of experiments was conducted to determine the best dynamic methodology, which was adapted to sentiment analysis of streams of financial tweets and applied to predictive stream mining in a financial stock market application. As a side effect, since there is no large labeled dataset of financial tweets publicly available, we have labeled and made publicly available a collection of financial tweets, making it the first large publicly available dataset of its kind.
The contributions of the dissertation and related research work were published in the following publications:
• Smailović, J., Žnidaršič, M., & Grčar, M. (2011) Web-based experimental platform for sentiment analysis. In Proceedings of the 3rd International Conference on In-formation Society and InIn-formation Technologies - ISIT 2011, 6 pages. Novo Mesto (Slovenia): Faculty of Information Studies.
• Smailović, J., Grčar, M., & Žnidaršič, M. (2012). Sentiment analysis on tweets in a financial domain. In Proceedings of 4th Jožef Stefan International Postgradu-ate School Students Conference (pp. 169–175). Ljubljana (Slovenia): Jožef Stefan International Postgraduate School. (Best ICT student paper award)
1.5. Scientific Contributions 9 Business Understanding Data Understanding Modeling Data Preparation Evaluation Deployment
CRISP-DM Sentiment analysis in streams of Twitter posts
* Set goals
* Examine existing studies
* Understand the Twitter platform
* Check data sources for obtaining Twitter posts * Study the writing style in Twitter posts
* Determine and understand the predicted phenomena
* Develop the methodological steps for predicting the phenomena of interest * Collect relevant data
* Apply data preprocessing * Apply data transformation
* Evaluate the proposed algorithms
* Implement the user and software interfaces * Enable public availability
Figure 1.1: The phases of sentiment analysis in streams of Twitter posts related to the CRISP-DM process model.
• Smailović, J., Grčar, M., Lavrač, N., & Žnidaršič, M. (2013). Predictive sentiment analysis of tweets: A stock market application. In Human-Computer Interaction and Knowledge Discovery in Complex, Unstructured, Big Data(pp. 77–88). Lecture Notes in Computer Science Volume 7947. Springer Berlin Heidelberg.
• Smailović, J., Grčar, M., Lavrač, N., & Žnidaršič, M. (2014). Stream-based active learning for sentiment analysis in the financial domain. Information Sciences, 285, 181-203. Elsevier.
• Kranjc, J., Smailović, J., Podpečan, V., Grčar, M., Žnidaršič, M., & Lavrač, N. (2014). Active learning for sentiment analysis on data streams: Methodology and workflow implementation in the ClowdFlows platform. DOI:10.1016/j.ipm.2014.04.001. Information Processing & Management. Elsevier.
• Sluban, B., Smailović, J., Juršič, M., Mozetič, I., & Battiston, S. (2014). Community sentiment on environmental topics in social networks. In Proceedings of the 10th International Conference on Signal Image Technology & Internet Based Systems (SITIS), 3rd International Workshop on Complex Networks and their Applications (pp. 376-382).
10 Chapter 1. Introduction
1.6
Organization of the Dissertation
The dissertation is structured as follows. Chapter 2 presents an overview of other studies related to the research presented in this dissertation. On the one hand, it discusses the studies which were concerned with sentiment analysis in stock market prediction and in election campaigns, and on the other hand, it considers studies on the active learning approaches applied to data streams.
Chapter 3 describes the developed methodology and experiments in sentiment analysis of Twitter microblogging posts. It presents the datasets, the experiments for selecting the most suitable algorithm (in terms of execution time and classification performance) for training the sentiment classifier, and the experiments that led to the choice of the best preprocessing setting for Twitter data. In this chapter, we also compare the developed static Twitter sentiment classifier with a selection of free publicly available classifiers.
In Chapter 4 we investigate whether the sentiment in Twitter posts that discuss fi-nances of a company can provide predictive information about the future stock prices of the discussed company. Time series data on stock closing prices and the sentiment in relevant tweets were adequately prepared and a statistical test was applied to examine the relationship between the two time series and assess the significance of the results. Moreover, due to the fact that financial tweets do not necessarily express positive or nega-tive opinion, we employed the concept of theneutral zone, which allows classification of a tweet also into the neutral category, thus improving the predictive power of the sentiment classifier compared to the classifier classifying Twitter posts into the positive and negative sentiment categories only. We present two definitions of the neutral zone, i.e., the fixed neutral zone and the relative neutral zone, and apply both in our experiments to determine which one provides better results.
Chapter 5 introduces incremental learning of the sentiment classifier on a stream of financial tweets by employing the active learning approach, which periodically asks an oracle (the human annotator) to manually label the examples which it finds most suitable for labeling and updating the classifier. Using this approach the sentiment classifier was made more domain specific and better adapted to a stream-based environment.
Chapter 6 presents selected parts of our work, which were made publicly available through the ClowdFlows interactive data mining platform. Moreover, Chapter 6 presents how our sentiment analysis methodology was incorporated into the PerceptionAnalytics Web platform, which provides an insight into happenings on popular social media Web sites. We also present how the developed sentiment analysis methodology was applied in two elections use cases.
The dissertation concludes in Section 7 with a summary of results, plans for further work, and lessons learned.
Finally, Appendices A, B, and C provide additional experimental results. Since in this dissertation, in several cases we use smiley-labeled tweets for training the sentiment classi-fier, in Appendix A we present empirical support for considering smiley-labeled tweets as a reasonable approximation for manually labeled tweets of positive/negative sentiment. Ap-pendix B reports experimental results of causality correlation between sentiment in tweets and closing stock price for 8 companies using the fixed neutral zone, while Appendix C provides similar experimental results, but with the application of the relative neutral zone.
11
Chapter 2
Related Work
This chapter provides an overview of the studies related to the research presented in this dissertation. First, we discuss the studies which are concerned with sentiment analysis. We provide a general introduction to this research area, and then focus on the applications in stock market prediction and in election campaigns, since these are the two main application domains of our work. Second, we discuss the studies interested in the active learning approach, with the emphasis on the cases adjusted to data streams.
2.1
Sentiment Analysis
Sentiment analysis (B. Liu, 2012; Medhat et al., 2014; Pang & Lee, 2008; Turney, 2002) is a research area that aims at detecting the authors sentiment, emotions or opinion about the events, topics or individuals expressed in text. Sentiment analysis is sometimes also referred to as opinion mining, and usually these two terms have identical meaning (Medhat et al., 2014). Nevertheless, some researchers explain that there exist small differences in notions of these two terms (Medhat et al., 2014). For example, Tsytsarau and Palpanas (2012) point out that opinion mining came from the information retrieval (IR) community and aims at first extracting and then processing opinions about an entity, while sentiment analysis originates from the natural language processing (NLP) community and is con-cerned with detecting the sentiment in given text. Moreover, Pang and Lee (2008) provide information about the terminology and the history of appearance of these two terms, but conclude that in the broad context these two terms represent the same field of study. In this dissertation we use the terms sentiment analysis and opinion mining as synonyms.
Many researchers have been studying sentiment analysis, and consequently there exist many different methods and algorithms for performing it. On the one hand, in applied research, sentiment analysis can be performed using: (i) machine learning, (ii) lexicon-based, or (iii) linguistic methods (Pang & Lee, 2008; Thelwall et al., 2011). We explain these approaches in Section 3.1.1. On the other hand, categorization of sentiment analysis techniques can be performed based on classification levels which can be: (i) document, (ii) sentence, or (iii) entity and aspect-level (B. Liu, 2012; Medhat et al., 2014). Document-level sentiment analysis (also referred to as document-Document-level sentiment classification or sentiment classification (B. Liu, 2010)) is concerned with classifying the entire opinionated document as positive or negative. In this scenario it is assumed that a document contains an opinion about a single entity. Sentence-level sentiment analysis classifies every sentence in a document as subjective or objective, and it classifies subjective sentences as positive or negative. Finally, entity and aspect-level sentiment analysis identifies sentiment related to a particular aspect of a detected entity.
12 Chapter 2. Related Work
reviews, blogs, or social networking and microblogging messages. Every data type has its own characteristics, which must be taken into account during data collection, preparation, preprocessing, and feature construction. Additional challenge in sentiment analysis is the analysis of texts containing irony and sarcasm.
Nowadays, sentiment analysis is applied in many situations — tracking and aggregating opinions about a product or a company, detecting opinions for or against some movement or political party, predicting a phenomenon of interest (book or movie profit, financial assets, etc.), and in many other situations. Data from social network and microblogging Web sites (e.g., Twitter) is especially interesting for research and applications because of its large volume, popularity, and capability of near-real-time publishing of individuals’ opinions and emotions about any subject. In recent years, many studies have analyzed sentiment expressed in such data in order to describe its content and study its relation to trends. For example, Thelwall et al. (2011) analyzed popular events in Twitter and showed that they are related to an increase in negative sentiment strength. Asur and Huberman (2010) constructed a model based on tweet-rate about particular topics for predicting profit of movies before their release. They further showed how sentiment extracted from Twitter posts can improve their predictive power. Bollen, Mao, and Pepe (2011) found that there is a relationship between the public mood (in terms of tension, depression, anger, vigor, fatigue, and confusion) expressed in Twitter posts and social, political, cultural, and economic events. Sentiment analysis of social network and microblogging messages was also applied in the context of stock markets and political elections. We discuss these cases in more detail in the following sections.
Besides for the research community, sentiment analysis has also been interesting for the industry, and consequently many sentiment analysis services have been developed. For example, in the US there are at least 20-30 companies that provide services for sentiment analysis (B. Liu, 2010).
There exist several survey papers that give an overview of sentiment analysis, discuss approaches and algorithms for sentiment analysis, and review its challenges and applica-tions; for example, the papers by Pang and Lee (2008), B. Liu (2010, 2012), Tsytsarau and Palpanas (2012), and Medhat et al. (2014). In this section, we provide an overview of studies related to this dissertation, which are concerned with sentiment analysis of social media as a predictor of future stock market indicators and election results.
2.1.1 Sentiment Analysis in Stock Market Prediction
In recent years, there has been a lot of research exploring whether sentiment analysis of social media content can be used to predict future stock market indicators. The stud-ies differ based on the collected data, applied techniques, time periods of the data, and financial indicators. In this section we provide an overview of this research.
Antweiler and M. Z. Frank (2004) analyzed messages posted on theYahoo! Finance1 and Raging Bull2 Web sites and how they are associated with stock markets. Their experiments showed that the messages do have an impact on stock returns, although it is economically small. Moreover, they showed that the messages have the capability of predicting volatility and that there is a relationship between messages disagreement and trading volume.
Sehgal and Song (2007) analyzed sentiment in messages from theYahoo! FinanceWeb site and demonstrated that sentiment and stock prices are closely correlated. The authors showed that one can employ sentiment analysis in order to make short-time predictions
1
http://finance.yahoo.com.
2.1. Sentiment Analysis 13
about stock price behavior. Their algorithm was also able to calculate the trust value of a message’s author based on his past accomplishment in predicting stock values. They also took into account that it is unrealistic for one person to be an expert for all the available stocks and that in real-life scenarios one person is usually knowledgeable only on a certain number of stocks.
Oh and Sheng (2011) analyzed sentiments in posts from Stocktwits.com3 and Yahoo! FinanceWeb sites over a period of three months and found that stock microblog sentiments may predict future stock price movements. Additionally, the authors reported several interesting observations: for example, they found that pessimistic information has higher predictive power than optimistic information, the majority of messages are posted during trading days (reaching the maximum on Thursdays) and working hours, and that online investors are over-optimistic and over-confident even in the periods of the stock market decline.
X. Zhang, Fuehres, and Gloor (2011) measured positive and negative emotions by counting emotional words in Twitter posts over a period of six months and analyzed the correlation between these measures and stock market indices such as Dow Jones, S&P 500, NASDAQ, and VIX. They noticed that the number of Twitter posts containing pos-itive words (hope and happy) is much higher than the Twitter posts containing negative words (fear, worry, nervous, anxious, and upset). The authors indicated that by inspect-ing Twitter for any kind of emotional outburst provides a predictor of the stock market performance of the following day.
Bollen, Mao, and Zeng (2011) measured mood in tweets in terms of not only positive and negative mood, but also in terms of six mood dimensions (calm, alert, sure, vital, kind, and happy) and showed that the “calm” mood dimension can predict daily up and down changes in the closing values of the Dow Jones Industrial Average (DJIA) Index. In order to demonstrate this predictive relationship the authors performed two sets of experiments. First, they applied the Granger causality analysis on all moods time series and DJIA closing values time series to check whether one time series contain predictive information about the other. Second, they compared the performance of Self-Organizing Fuzzy Neural Network for predicting the future DJIA values trained on a basis of past DJIA values alone and with the addition of mood dimensions. Chen and Lazer (2011) confirmed the results of Bollen, Mao, and Zeng (2011) and showed that even with a much simpler sentiment analysis approach, one can observe a relationship between tweet sentiment and stock market data. Mittal and Goel (2012) based their work for finding a correlation between public sentiment and the stock market on the approach of Bollen, Mao, and Zeng (2011). Their results are in some agreement with the results of Bollen, Mao, and Zeng (2011), but they indicate that not only the “calm”, but also the “happy” mood dimension has a correlation with the DJIA values.
Nann, Krauss, and Schoder (2013) calculated daily sentiment of aggregated data from multiple sources (Twitter, 11 online message boards, and Yahoo! Finance news stream), where the data was concerned with stocks of the S&P 500 index during a six-month period. In their experiments, the authors showed that the analyzed data has predictive power for stock price changes on the following day. The authors have also illustrated the possible practical application of their study by describing a trading model, which also takes into account several real-world limitations and characteristics of the stock market (e.g., transaction costs).
Sprenger et al. (2013) analyzed about 250,000 stock-related Twitter microblogging posts over a period of six months and explored association among various values describing tweets and stocks. The authors focused on tweets discussing a selection of S&P 100