University of Mississippi University of Mississippi
eGrove
eGrove
Electronic Theses and Dissertations Graduate School
2016
Order Behavior In High Frequency Markest
Order Behavior In High Frequency Markest
Brian Roseman University of Mississippi
Follow this and additional works at: https://egrove.olemiss.edu/etd
Part of the Finance Commons
Recommended Citation Recommended Citation
Roseman, Brian, "Order Behavior In High Frequency Markest" (2016). Electronic Theses and Dissertations. 562.
https://egrove.olemiss.edu/etd/562
This Dissertation is brought to you for free and open access by the Graduate School at eGrove. It has been accepted for inclusion in Electronic Theses and Dissertations by an authorized administrator of eGrove. For more information, please contact [email protected].
ORDER BEHAVIOR IN HIGH FREQUENCY MARKETS
BRIAN ROSEMAN
DISSERTATION PRESENTED IN PARTIAL FULFILLMENT OF REQUIREMENTS FOR THE DOCTOR OF PHILOSPHY IN BUSINESS ADMINSTRATION, DEPARTMENT OF
FINANCE, UNIVERSITY OF MISSISSIPPI
Copyright Brian Scott Roseman 2016 ALL RIGHTS RESERVED
ii ABSTRACT
In Part 1, I study the characteristics of short orders in stock markets. Fleeting orders are quick limit orders that remain on the limit order book for only a few seconds before being canceled, and are significantly different than more patient, static, limit orders that are added to the limit order book and await execution. I investigate the impact that fleeting orders have on spread and depth measures of market quality, and how fleeting orders differ from static orders. Attention is also given to the extent that total depth can be decomposed into the two components of fleeting and static depth. The results suggest that static orders have a positive impact on both spread and depth. However, fleeting orders have little impact on total liquidity. The results suggest that fleeting orders contribute noise to markets, and do not positively impact the spread and depth components of liquidity. This result is robust to the simultaneous issue that order submission strategies depend on current market quality conditions. In Part 2, I investigate the link between orders and trades in equity markets. A substantial body of research on limit order markets investigates the characteristics of orders and the characteristics of trades. However, there has been little research on how the characteristics of orders impact the characteristics of trades. I investigate the impact that marketable orders and limit orders have on the resulting trade characteristics. In addition, we test theoretical predictions on how market characteristics, like time of day and depth, impact order and trade characteristics. Lastly, in Part 3, I investigate the causes, and effects of intraday flash crashes. Breakdowns in financial markets occur when the market is not able to facilitate its principal responsibilities of liquidity provision and price discovery. In this paper we look at flash crashes, a special type of market breakdown. These crashes are generally non-fundamental in nature, and the market making responsibilities of liquidity and price discovery are only temporarily suspended for a short period before rebounding to pre-crash levels. This paper analyzes intraday flash crashes, primarily focusing on three aspects of flash crashes: crash frequency, crash triggers, and the impact on market quality once the crash has seceded.
iii
DEDICATION
This dissertation is dedicated to my wife, who encouraged and supported me through this process, and to my parents who have always motivated me to always give my best effort.
iv
ACKNOWLEDGEMENTS
I express my appreciation to my dissertation chair, Dr. Robert Van Ness, and to my committee members, Dr. Bonnie Van Ness, Dr. Andre Liebenberg, and Dr. Bart Garner, for their guidance, help, and support through this process.
v APPENDIX OF CONTENTS Title page ... i Acknowledgement of Copyright Abstract ... ii Dedication ... iii Acknowledgements ... iv Appendix of Contents ... v
Lists of Appendices... vii
Part 1: More Depth to Depth: Liquidity of Fleeting and Static Orders ... 1
Introduction ... 2
Background ... 7
Data and Methods ... 10
The Impact of Fleeting and Static Depth on Total Liquidity ... 18
Theoretical Implications of Fleeting Liquidity ... 29
Conclusion ... 32
References ... 34
Appendix ... 37
Part 2: Order and Trade Characteristics in Equity Markets ... 66
Introduction ... 67
Hypotheses ... 70
vi
Results ... 79
Conclusion ... 90
References ... 91
Appendix ... 94
Part 3: Breakdowns in Financial Markets: Flash Crashes and Liquidity Crises ... 121
Introduction ... 122
Background and Hypotheses... 127
Data and Methods ... 130
Results ... 136
Conclusion ... 144
References ... 146
Appendix ... 149
vii
LISTS OF APPENDICES Part 1: More Depth to Depth: Liquidity of Fleeting and Static Orders
1. Firm Summary Statistics ... 38
2. Order Characteristics ... 40
3. Depth Summary Statistics ... 42
4. Fleeting and Static Depth against Total Depth ... 45
5. Cost and Percent of Time to Complete a Round Trip Trade ... 47
6. The Contribution of Fleeting and Static liquidity on Total Liquidity ... 50
7. The Contribution of Fleeting and Static Depth on Total Depth ... 52
8. Endogeneity and Simultaneity of Depth and Fleeting Orders ... 54
9. Depth and Volume Quintiles ... 56
10. Are Fleeting Orders only Submitted Within the Spread ... 58
11. Do Fleeting Orders Create Constant Forecastable Depth ... 60
12. Fleeting and Static Order Price Competiveness... 62
13. Fleeting and Static Limit Order Book Behavior throughout the Trading Day ... 64
Part 2: An Analysis of Penny Stocks and Listed Securities Trading Under Five Dollars 1. Definitions of Trade Prints and Order Classifications ... 95
2. Daily Summary Statistics ... 97
3. Order and Trade Characteristics and Correlations ... 99
4. Determinants of Trade Characteristics ... 102
viii
6. Fill Rates and Order Sizes of Limit Orders ... 107
7. Prevalence of Limit Orders During Periods of High Depth and Low Volatility .. 109
8. Prevalence of Aggressive, Fleeting, and Marketable Orders During Fifteen Minute Periods of High Depth and Low Volatility ... 112
9. Order Aggressiveness by Time of Day ... 115
10. Intraday Order and Trade Characteristics ... 117
11. Order Aggressiveness throughout the Trading Day... 119
Part 3: Breakdowns in Financial Markets: Flash Crashes and Liquidity Crises 1. Summary Statistics of Securities Experiencing a Flash Crash ... 150
2. Summary Statistics of Flash Crashes ... 152
3. Triggers of Flash Crashes ... 154
4. Liquidity Before and During the Crash ... 156
5. Trade Pressure and Flash Crashes... 158
6. Lingering Impact of Flash Crashes ... 160
7. Matched Sample... 162
8. Contagion of Flash Crashes in Matched Sample ... 164
1
2
I. INTRODUCTION
Exchanges and institutional traders devote considerable resources into decreasing the latency of transmitting market messages and increasing the speed of order placement (Gao, Yao, and Ye (2013)). Efforts to decrease latency include placement of traders’ proprietary trading computers next to exchange servers, known as co-location, as well as development of trans-city networks (Garvey and Wu (2010)). These networks include fiber optic cables, lasers, radio waves, and microwave towers used to connect traders in New York City and other cities such as Chicago and London.1 There is not a universally held opinion on whether these advances positively or
negatively impact market quality (Jones (2013)). One externality of high speed markets is the increase in the order-trade ratio, which coincides with a decrease in the average duration of an order (Hasbrouck and Saar (2009), Hendershott, Jones, and Menkveld (2011)). Many orders are placed for microseconds and then quickly canceled, which are often referred to as fleeting orders. Quick, fleeting orders are receiving an increase in attention in the microstructure literature because of the potential impact on market quality (Hasbrouck (2013), Baruch and Glosten (2013)). Whether or not fleeting orders and low-latency orders improve market quality is the focus of this paper.
I compare the characteristics of fleeting orders against longer duration orders to study market quality in low-latency markets. Much of the literature on market quality in low-latency
1 Spread Networks has a fiber optic line that connects Chicago to New York City (Laughlin, Aguirre, Grundfest
(2014)). Hibernia Networks manufactured a high capacity trans-Atlantic fiber optic path between New York and London. McKay Brothers offers microwave towers to connect traders across different locations around the world. Anova Technologies delivers high-frequency data through laser and radio networks.
3
markets looks at the type of traders placing the order (i.e. algorithmic and/or high frequency traders) rather than the characteristics of the order, leading to conflicting conclusions on whether to classify algorithmic and high frequency traders as helpful or harmful to financial markets. Studies such as Hendershott, Jones, and Menkveld (2011), Menkveld (2013), Hendershott and Riordan (2013), and Brogaard, Hendershott, and Riordan (2014) provide evidence that high frequency and algorithmic trading help improve market quality, while studies such as O’Hara (2011), McInish and Upson (2012), Kirilenko, Kyle, Sadami, Tuzun (2014), and Gerig (2015), provide examples of potential harmful effects. The question of interest regarding market quality is not who places the orders, rather what orders are being placed, since a class of traders can pursue different order strategies, which either benefit or harm markets, at different times. I take a different approach on the subject in that I look at the orders being submitted, irrespective of the trader, and investigate how the order type impacts market quality. The empirical tests look at not only top-of-book measures (such as spread and price impact), but also depth measures, which may be more appropriate measure in high-frequency markets (O’Hara (2015)). In nearly all of the tests, static orders positively impact spread and depth, while fleeting orders have little or no positive impact on market quality and liquidity.
Empirically, I separate fleeting orders, which only provide liquidity for two seconds or less (Hasbrouck and Saar (2009)), from static orders, which provide liquidity for greater than two seconds.2 Using order-level data from NASDAQ OMX, I recreate the limit order book for the NASDAQ exchange. In addition, and in an effort to disentangle the effects of fleeting orders from the effects of static orders, I also recreate two artificial limit order books, one that comprises
2 Two seconds is arguably too long of a cutoff of fleeting orders in a low-latency market. However, given the results
of the paper, reducing the measure to one second, or even sub-seconds, would only strengthen the results and implications of the paper.
4
fleeting orders, and one that comprises patient orders. By artificially separating the limit order book into these two components, I am able to measure and compare market quality (i.e. depth, spread, price impact) of fleeting and static orders.
This approach provides a number of contributions to the literature on liquidity, limit orders markets, and high frequency trading. First, separating the order types allows for a direct comparison of the market quality of fleeting orders, which provide liquidity only for a few seconds, against the market quality of static orders, which are submitted to the limit order book for longer durations. Since both human and algorithmic traders can pursue strategies of submitting static orders and fleeting orders, separating the two order types effectively tests the impact of the order type on market quality rather than the class of trader’s impact on market quality.
A second contribution of my study is that I show depth can be separated into two components, patient depth and fleeting depth, wherein each component has a unique and varying impact on total depth and liquidity. A partitioned view of depth is more appropriate in low latency markets. Traditionally, depth is defined as the total number of shares available to trade at prices at (or near) the best bid and offer at a specific point in time. This simple definition does not, however, distinguish between starkly different types of order and trading strategies. Limit order traders can trade patiently (e.g. Glosten (1994), Handa and Schwartz (1996), and Rosu (2009)), or aggressively, as shown by recent high frequency trading papers (e.g. Hasbrouck and Saar (2009) Menkveld (2013), Baruch and Glosten (2013)).
Although my study is the first to empirically decompose depth into fleeting and static components, the existing work on limit order markets suggest that depth is composed of orders from various types of traders. Theoretical literature suggests that limit order traders pursue a number of strategies. Glosten (1994) considers patient limit order traders to be uninformed
5
investors who make a market for impatient traders who submit market orders. Impatient traders may be either informed or noisy. In Glosten’s model, limit order traders are patient and supply liquidity to impatient traders. In a different setting suggested by Rosu (2009), in which all participants are informed traders, limit orders are also submitted by patient traders. However, Rosu assumes that each trader is a liquidity trader, and information is constant and known by all market participants. In this framework, all agents incur waiting costs. Limit orders are submitted by traders with low waiting costs, and traders with high waiting costs submit market orders. However, not all limit orders are assumed to be patient. In Rosu’s model, if depth in the limit order book is high and the spread is at a minimum, then impatient traders will either submit market orders, or submit quick, fleeting, limit orders. Fleeting orders are orders that are added and quickly canceled, which are starkly different than patient limit orders that supply liquidity. Theoretical work by Baruch and Glosten (2013) show that fleeting orders are the result of liquidity supplying traders preventing their stale prices from being picked off. To avoid pickoff risk, a liquidity providing trader will cancel stale quotes and replace them with newly priced quotes. Theories by Rosu, and Baruch and Glosten suggest that liquidity and depth are composed of both patient and fleeting orders. In related empirical work, Hasbrouck and Saar (2009) observe that one third of limit orders are canceled within two seconds. Further, Hasbrouck (2013) documents flickering and volatile best bid and best offer quote prices that may be the result of high frequency traders rapidly submitting and canceling nonmarketable orders. I build upon these studies by empirically showing the impact that patient orders and fleeting orders each have on total liquidity.
The third contribution of this study is that I investigate previously untested assumptions and implications from the theoretical literature on fleeting orders and low-latency limit order markets. A major obstacle in the analysis of fleeting orders is the difficulty in constructing the
6
limit order book, and the difficulty in distinguishing between the impact that a fleeting order and static order has on total depth, which the approach in this study overcomes. In Rosu’s (2009) model, traders may switch between limit orders and market orders depending on the state of the limit order book. Fleeting orders increase when the depth in the limit order book is high. I test Rosu’s model by looking at the structure of the limit order book and composition of fleeting and static orders. I also test theoretical predictions from Baruch and Glosten (2013), who provide a number of implications on flickering quotes. In their model, flickering quotes exhibit different properties depending on the number of traders in the market. They show that although there may be fleeting orders that lead to flickering quotes, when there are many traders submitting flickering quotes, depth will appear to be static.
Although some traders may not initially decide on whether to submit a fleeting or static order, in retrospect the majority of orders are fleeting. Due to the ex-post definition of fleeting orders, there is concern of endogeneity. Simultaneity issues may arise if a trader’s order submission strategy depends on current market conditions. A liquidity supplying trader who submits an order may be managing pick-off risk by monitoring the markets for information. As market conditions change, as evidenced by changes in the limit order book, the trader will dynamically respond to the new market conditions by deleting outstanding orders and submitting new, appropriately-priced orders. Theoretical work by Baruch and Glosten (2013) support this view. Additionally, empirical work shows that high speed traders have the ability to respond to changing market conditions (i.e. Hendershott and Riordan (2013)). The simultaneity issue is that current market quality is impacted by order submissions (which is true by construction), while at the same time market conditions may impact a trader’s order submission strategy. I use two-staged least squares (2SLS) regression to simultaneously model the two endogenous relations. The results
7
are robust, further strengthening the conclusions regarding the impact of fleeting and static orders on market quality.
The paper outline is as follows. I will first review the theoretical predictions of how fleeting and static orders should impact total liquidity. I then describe the data, and major empirical methods used. The fourth section compares the impact that fleeting and static orders have on total market quality. The fifth section tests theoretical predictions regarding fleeting orders and how they should behave. Finally I conclude.
8
II. BACKGROUND
Prior research does not explicitly define depth as being comprised of two separate components of static and fleeting depth. Previous studies do, however, suggest traders pursue multiple strategies when supplying liquidity. On one hand, theoretical work suggest limit order traders may patiently supply liquidity. These traders make a market for impatient traders by placing orders and waiting for execution (i.e. Glosten (1994), Foucault, Kadan, and Kandel (2005), Handa and Schwartz (1996)). On the other hand, limit order traders may also submit fleeting orders to increase the probability of execution when the limit order book is full (Rosu (2009)) or to manage undercutting exposure (Baruch and Glosten (2013)). These studies suggest depth in low-latency markets is not the composition of uniform orders. Rather, depth is composed of two categories of orders: static depth and fleeting depth. Static depth is defined as orders that are placed, and patiently await execution, while fleeting depth is defined as the depth that is provided by traders who submit and quickly cancel orders. Each type of depth has a different impact on total liquidity.
STATIC DEPTH
Traditional theories of limit order markets assume patient liquidity providers place limit orders while marketable orders are placed by impatient liquidity demanders. In the model of Glosten (1994), limit order traders are risk averse market makers. These traders patiently place orders to provide liquidity. In the Foucault, Kadan, and Kandel (2005) framework, impatient traders submit market orders and patient traders submit limit orders, providing liquidity for the
9
impatient traders, suggesting that patient traders improve liquidity. In the Rosu (2009) model, all traders have waiting costs, and the aggressiveness of the trader is determined by whether the trader’s waiting costs are high or low. In equilibrium, impatient traders submit market orders, while patient traders submit limit orders and wait for execution from an impatient trader. Unless the limit order book is full, Rosu shows the new limit orders will be placed aggressively within the bid-ask spread.3 Orders that patiently await execution should be a positive component of depth, and orders that are placed inside the spread should improve liquidity measures such as quoted and effective spread. These studies provide theoretical support that patient depth, which is composed of static orders, should be a positive component of liquidity. I refer to this as the static depth hypothesis.
Hypothesis 1: Static depth has a positive impact on total market liquidity
FLEETING DEPTH
Fleeting orders are orders that are submitted and canceled almost immediately. Although fleeting orders are typically limit orders, the characteristics of these orders are different from limit orders in the traditional sense (Hasbrouck and Saar (2009)). Theoretical studies such as Rosu (2009) and Baruch and Glosten (2013) highlight a number of reasons that traders pursue fleeting order strategies. A special case of the Rosu theoretical model, when depth is high and the spread is at a minimum, traders will enter into a game of attrition where fleeting orders are used to entice the opposite side of the limit order book to submit a market order. Limit order traders only submit fleeting orders when the limit order book is full, and the orders are always submitted within the
3 Rosu (2009) defines the limit order book as being full when the bid-ask spread is at a minimum, nonzero tick size.
The model also assumes that there is a maximum number of limit orders allowed on the limit order book, which is not true empirically. I consider a ‘full’ limit order book to be when the spread is low and depth is high.
10
spread. Empirically, this suggests that fleeting orders are more likely for limit order books experiencing high depth or low spreads.
Baruch and Glosten (2013) develop a model where fleeting orders are the result of competing liquidity supplying traders. In Baruch and Glosten’s model, traders submit competitive orders. However, limit order traders are exposed to time sensitive risk. To avoid time sensitive risk, traders withdraw outstanding orders and submit new orders quickly. The frequent adding and cancelling of orders will yield a flickering quote, but as the number of traders that pursue this strategy increase, the aggregate quotes in the market will have stable depth and appears to be static. Baruch and Glosten’s theory suggests that during periods when there is high depth and many fleeting orders, the best bid and offer should appear static. The cumulative depth provided by fleeting orders should yield constant, forecastable, depth.
Both the theories by Baruch and Glosten (2013), and Rosu (2009) suggest that during periods of high depth and low spread, fleeting orders have a positive impact on total depth and liquidity. Rosu predicts that fleeting orders are price improving that are always submitted within the spread. Baruch and Glosten predict that fleeting orders are simply orders placed by liquidity supplying traders who are managing pick off risk. I refer to these theories collectively as the fleeting depth hypotheses.
Hypothesis 2: Fleeting depth has a positive impact on total market liquidity
Hypothesis 3: Fleeting orders are more likely when the spread is low and depth is high Hypothesis 4: Fleeting orders are only placed within the bid-ask spread
11
III. DATA AND METHODS
The empirical analysis in this paper utilizes several different databases. Since measures of depth require construction of the limit order book, I use an order-level dataset, the NASDAQ TotalView-ITCH database, which includes order submissions, deletions, updates, and executions for orders placed on the NASDAQ exchange. With this order dataset I am able to reconstruct the limit order book. Additional stock information comes from the Center for Research and Securities Prices (CRSP) and daily trading characteristics come from the Securities and Exchange Commission (SEC) Midas database. The sample comprises the three months of trading days from August through October 2014.
A number of filters are employed. Since data for the exchange used in the study is owned by NASDAQ OMX, my sample includes only NASDAQ listed securities. On the NASDAQ exchange there are approximately 2,871 NASDAQ listed securities that trade during our sample period. In order to ensure that the liquidity measures used in this study provide meaningful results, additional filters eliminate stocks that do not trade at least 1,000 shares each day of the sample, as well as stocks that do not have a closing price of five dollars for each day of the sample (similar filters as Hendershott, Jones, and Menkveld (2011)), which leaves a sample of 1,186 actively traded securities. The limit order book is created dynamically so that every order, update message, and execution is implemented into the limit order book, which yields a best bid and offer that is accurate to the nanosecond. When creating the limit order book, I remove stub-quotes from the computations. Stub-quotes are orders that have an extremely low probability of execution
12
(Egginton, Van Ness, Van Ness (2014)). At the beginning of the trading day, the data reveals that many bid orders are priced at one penny, and sell orders may exceed $100,000. These orders have a low probability of execution, and may erroneously skew the measures of depth that are used in this study. For this reason I do not use orders that are less than three dollars, or orders that are greater than $5,000 when rebuilding the limit order book. 4 The created limit order book provides depth at the top of the book and beyond the top of the book when each new message during the trading day is received. Depth is accurate to the nanosecond.
Table 1 presents the characteristics of the stocks that are used in the sample. The average stock trades at a price of $37.26, has a market capitalization of $5.67 Billion, and has 626 trades totaling 1,120,198 shares traded per day. The average stock in the sample receives 18,734 fleeting orders and 16,115 static orders each day.
SEPARATING THE LIMIT ORDER BOOK
One difficulty for studies of market quality in low-latency markets is isolating the effects of multiple sources of liquidity improvement. For example, if market quality improves (spread decreases or depth increases) following the increase in algorithmic trading, as in Hendershott, Jones, and Menvkeld (2011), the improved liquidity may be partially due to non-algorithmic traders responding to increased competition induced by the algorithmic traders.
I employ a novel way to test the effects of multiple sources of liquidity improvement. I create three separate limit order books. The first limit order book is the ‘true’ limit order book, which represents the limit order book that traders see in real time. This limit order book includes all orders added, executed, updated, and deleted. I also create two artificial limit order books, a
4 The data filters for the study eliminate stocks that do not have a closing price of five dollars. However, orders may still
13
‘fleeting’ limit order book, and a ‘static’ limit order book. The fleeting limit order book is comprised of only orders that supply liquidity for two seconds or less, while the static limit order book is comprised of only orders that provide liquidity for greater than two seconds. The argument for studying depth in this manner is that both fleeting and static orders have an impact on total liquidity, but it is uncertain which type of order is driving the characteristics of the actual limit order book. With three limit order books I am able to see at each moment what is the market quality (spread and depth) of fleeting and static orders. Using these three limit order books I am able to isolate and test the effects of short-duration and long-duration orders on total market liquidity.
I present the characteristics of orders in Table 2. These statistics are averaged by stock by day, for each statistic used, and then descriptive statistics are taken from the average stock-day observations. The average order is for 202 shares, is on the limit order book for 9 minutes and 32 seconds (572 seconds), and is placed 23 cents from the top of the limit order book. There are approximately 32 orders for every trade. Static orders are placed on the limit order book for an average of 15 minutes and 50 seconds (950 seconds), and are placed 35 cents from the top of the limit order book. Static orders have approximately 25 orders to every trade. Fleeting orders are considerably less patient and more aggressive in pricing. The average fleeting order is on the limit order book for 240 milliseconds, and is placed 9 cents from the top of the limit order book. Although fleeting orders are more aggressive in their pricing, there are approximately 67 fleeting orders submitted for every fleeting order that executes.
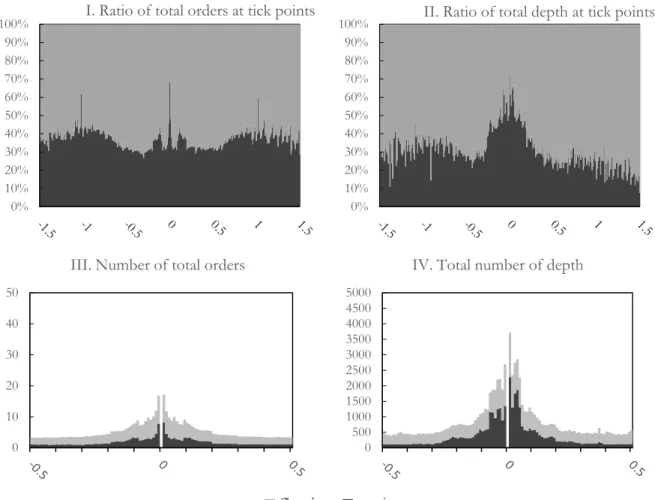
Figure 1 reports the competiveness of fleeting and static orders. The first panel reports the ratio of fleeting orders to static orders at different price points away from the BBO. Negative numbers represent the distance from the best bid price for buy limit orders, and positive numbers represent the distance from the best offer for sell limit orders. The second panel reports the ratio
14
of total depth (computed by summing the shares available for each order) at price points away from the BBO. From the first two panels, it is apparent that in general, fleeting orders outnumber static orders, with the exception being at the top of the limit order book. The third and fourth panels report the total number of fleeting and static orders, and the total depth provided by fleeting and static orders respectively. From these two panels it appears that most of the fleeting depth is at the top of the limit order book. All figures and summary statistics numbers are first averaged by stock, and then averaged across stocks.
LIQUIDITY MEAURES AND VARIABLES
A major focus of this paper is testing the differences in market quality provided by orders that are static against the market quality that is contributed from orders that are fleeting. To test the market quality of static and fleeting orders, I compute three spread measures used in Goyenko, Holden, Trzcinka (2009), as well as two additional depth measures, yielding five liquidity measure that are computed for each of the three limit order books described above. The limit order book computations yield a market quality measure for the nanosecond the limit order book is updated. For much of the empirical tests I average market quality measures to the minute. My full dataset yields the average spread and depth for each stock, each minute of the trading day for each of the limit order books computed.
The first measure is the quoted spread, the difference between the best bid and offer for stock j at time t. Quoted spread is defined as
𝑄𝑢𝑜𝑡𝑒𝑑 𝑆𝑝𝑟𝑒𝑎𝑑 = 𝑝𝑗𝑡,𝑎𝑠𝑘− 𝑝𝑗𝑡,𝑏𝑖𝑑.
(1) I compute the quoted spread using the true limit order book, as well as the quoted spread for the fleeting limit order book and the quoted spread for the static order book. Using each of the three
15
limit order books yields three different measures of quoted spread: the true quoted spread, the quoted spread of fleeting orders, and the quoted spread of static orders.
I compute the effective spread for all three limit order books as
𝐸𝑓𝑓𝑒𝑐𝑡𝑖𝑣𝑒 𝑆𝑝𝑟𝑒𝑎𝑑 = 2 ∗ |𝑝𝑗,𝑡− 𝑚𝑗,𝑡|, (2)
where the effective spread is twice the absolute distance from the price of a trade at time t to the midpoint of the BBO for stock j. The third common measure of market quality I use is the price impact that a trade has on the limit order book. In a highly liquidity market a trade will have a low price impact. Using the method of computing the price impact for three limit order books, I am able to see how fleeting orders and static orders react to information contained in trades. The price impact identifies the change in the BBO from the time of a trade to the BBO five minutes after the trade execution, which is considered the permanent component of the spread (Goyenko, Holdern, Trzcinka (2009)). I express it as a percentage of the original midpoint for stock j at time t. Price impact is defined as
𝑃𝑟𝑖𝑐𝑒 𝐼𝑚𝑝𝑎𝑐𝑡 = 2 ∗|𝑚𝑗,𝑡−𝑚𝑗,𝑡+5|
𝑚𝑗,𝑡 .
(3)
Measuring market quality only at the top of book does not fully reflect the market quality of a security. Traders wishing to execute large number of shares may be more concerned about the number of shares available to trade, rather than the cost to trade at the top of the limit order book. Therefore, limit order book depth is used as an additional measure of market quality. I use two depth measures, the first is the cost of a round trip trade (CRT), and the second is the depth-weighted average price (DWAP). The CRT is defined in Domowitz, Hansch, and Wang (2005), and reflects the ex-ante cost a trader would encounter by buying and selling q number of shares. I modify the notation of Domowitz et al. slightly, and express CRT as
16 [∑𝑘−1𝑗=1𝐷𝑗,𝑎𝑠𝑘 𝑃𝑗,𝑎𝑠𝑘 + (𝑞 − ∑𝑗=1𝑘−1𝐷𝑗,𝑎𝑠𝑘)𝑃𝑘,𝑎𝑠𝑘] − [∑𝑘 𝐷𝑗,𝑏𝑖𝑑𝑃𝑗,𝑏𝑖𝑑 ′−1 𝑗=1 + (𝑞 − ∑𝑘𝑗=1′−1𝐷𝑗,𝑏𝑖𝑑)𝑃𝑘,𝑏𝑖𝑑], (4)
where k is the number of ticks that a sell order of q shares has to travel on the ask side of the limit order book before q shares are filled, k’ is the number of ticks a buy order of q shares has to travel before being completely filled. The depth and price of tick j is represented by Dj and Pj. The first term of equation (4) is the cost to sell q shares, while the second term is the cost to buy q shares. The difference between the first and second term represents the total cost to buy and sell q shares of a security simultaneously, or the cost of a round trip trade of size q. Although Domowitz et al. consider 10 values of q between 1 and 2,701 in their depth simulations, I only consider five values due to computational constraints. I consider values of q equal to 100, 500, 1,000, 5,000 and 10,000 shares. Much of the empirical portions of this paper will focus on q values of 1,000 and 5,000. I express the CRT on a per share basis, which I define as the CRTSPREAD, as
𝐶𝑅𝑇𝑆𝑃𝑅𝐸𝐴𝐷 = 𝐶𝑅𝑇
𝑞 . (5)
CRTSPREAD can be interpreted in the same manner as quoted spread, with the exception that CRTSPREAD reflects more than the number of shares at the top of the limit order book. The CRT is computed for all the limit order books in the study. If static orders and fleeting orders have a positive impact on market quality, then the CRTSPREAD should be low.
DWAP is the second measure of limit order book market quality that I use in this study. I calculate DWAP similar to Johnson and Upson (2013) as
𝐷𝑊𝐴𝑃 =∑𝐼𝑖=1𝑃𝑖𝐷𝑖
∑𝐼𝑖=1𝐷𝑖
17
where there are I ticks on a given side of the limit order book, with a price of Pi and depth of Di at tick i. I calculate the DWAP for both the bid and ask side of the limit order book, and take the difference to get the DWAPSPREAD.
𝐷𝑊𝐴𝑃𝑠𝑝𝑟𝑒𝑎𝑑 = 𝐷𝑊𝐴𝑃𝑎𝑠𝑘− 𝐷𝑊𝐴𝑃𝑏𝑖𝑑. (7)
In total, I have three spread measures for top of book market quality: quoted spread, effective spread and price impact, as well as two spread measures that reflect depth in the limit order book: CRT and DWAP. All five measures of market quality are computed for the true limit order book, the fleeting limit order book, and the static limit order book. After computing each of the five measures for each nanosecond, they are averaged to the minute level for much of the empirical analyses.
Panel A of Table 3 presents the liquidity measures for the average stock in my sample for the NASDAQ exchange. The average stock has a quoted spread of 6 cents, effective spread of 3 cents, and a negligible price impact. The CRT100 is the per share cost that a trader can expect to pay in transaction costs from simultaneously buying and selling 100 shares, and reflects depth beyond the top of the book. If there is greater than 100 shares in depth at the best bid and best offer, then the CRT100 will equal the quoted spread. If there is less than 100 shares at the best bid and best offer, the CRT100 will be greater than the quoted spread. The average stock in the sample has a CRT100 of 7 cents. It is not always possible to complete a round trip trade due to illiquidity. A trader wishing to buy and sell 100, 500, 1,000, 5,000, and 10,000 shares can expect to pay 7, 12, 20, 136, and 190 cents respectively. The average DWAPspread is 1,052 cents. The average CRT1000 is 3.22 times the quoted spread, the CRT5000 is 20.25 times the quoted spread, and the DWAP spread is 37.23 times the quoted spread.
18
In Panels B and C of Table 3 I report the liquidity measures for the fleeting and static limit order books. The quoted spread of the static limit order book is 7 cents, while the fleeting limit order book has an average quoted spread of 20 cents. A hypothetical roundtrip trade of 100 shares against the artificial static limit order book would cost an average of 8 cents per share, while the cost of a 100 share roundtrip executed against the artificial fleeting limit order book would cost 21 cents per share. A trade of 1000 shares on the static limit order book would cost 3.63 times the quoted spread on average, while a 1000 share trade on the fleeting limit order book would cost 3.87 times the quoted spread on average.
In addition to the measures of liquidity, there are a number of other variables that I use in the study. Rosu (2009) makes predictions about the aggressiveness of an order. I define order aggressiveness similar to Griffiths, Smith, Turnball, and White (2000), who measure aggressiveness relative to the BBO. A buy order is most aggressive if it is higher than the ask price (i.e. crossing the market). A less aggressive order is placed within the BBO, and the least aggressive orders are placed less than the best bid. A similar scale of order aggressiveness is used for sell orders. I calculate minute volatility as the standard deviation of the midpoint at time t. Range is used as a measure of daily volatility, similar to O’Hara, Yao, and Ye (2014), which is the difference between the daily high and low price.
19
IV. THE IMPACT OF FLEETING AND STATIC DEPTH ON TOTAL LIQUIDITY
The empirical tests are broken into three broad categories. The first and second groups of tests are reported in this section. The first tests identify the impact that static orders and fleeting orders have on total depth, specifically addressing the hypotheses on whether fleeting and static orders impact total liquidity. These tests also compare the differences of fleeting orders against static orders. The second group considers the simultaneity issue that orders impact depth, while at the same time fleeting orders may be a function of depth. The third group of tests, reported in the following section, investigates the theoretical predictions or fleeting orders.
HOW DO FLEETING AND STATIC ORDERS IMPACT LIQUIDITY?
Many theoretical papers on limit order markets assume that patient liquidity providers improve liquidity by making a market for impatient traders who submit market orders (i.e. Glosten (1994), Foucault, Kadan, Kandel (2005)). These theories suggest that static orders should have a positive impact on total liquidity. Theory also suggests that fleeting orders, although less patient than static orders, may also have a positive impact on liquidity. Theory by Rosu (2009) and Baruch and Glosten (2013) consider fleeting orders to be price improving orders submitted by liquidity supplying traders. Rosu’s (2009) model predicts that fleeting orders are placed within the bid-ask spread, suggesting that the market quality of the fleeting limit order book should improve liquidity measures at the top of the limit order book like quoted spread, effective spread, and price impact. Theory by Baruch and Glosten (2013) suggest that fleeting orders are liquidity providing limit
20
orders placed by traders managing their pick-off risk. Although the orders may be fleeting, the trader will replace the order with a new order. If these traders are liquidity providing traders, then the cumulative market quality from fleeting orders should improve the market quality of the complete limit order book.
In Table 4, I report nine different liquidity measures for the total limit order book, as well as for the fleeting limit order book and static limit order book. The three top of book measures include the quoted spread, effective spread, and price impact. For the complete limit order book these are respectively 6.92 cents, 3.27 cents, and 26 basis points. Using the methods described in the previous section, I form two subsets of the complete limit order book. Using only static orders I form a static limit order book, and using fleeting orders I form a fleeting limit order book. I compute the same market quality measures for the two artificial limit order books as I do for the total limit order book. The quoted and effective spread for the static limit order book are respectively 7.08 cents and 3.50 cents, and for the fleeting limit order book they are respectively 21.18 and 7.43 cents. The price impact is negligible.
One of the objectives of this paper is to test the extent that static and fleeting depth each impact total depth. To test whether static orders have a positive impact on total liquidity I compare the liquidity measures of the static limit order book against the liquidity measures of the complete limit order book. If the static and fleeting limit order book have positive impacts on the complete limit order book, the differences should be insignificant. From columns 4 and 5 of Table 4, the quoted spread of the static limit order book is 0.16 cents larger than the total limit order book, and the effective spread is 0.23 cents larger. Both are statistically significant, but economically small. I repeat the test for fleeting orders, where the quoted spread is 14.26 cents larger and the effective spread 4.16 cents larger. The average fleeting quoted spread is 14 cents higher than the static limit
21
order book, and the effective spread is 3.9 cents higher. These preliminary tests suggest that on average, the static limit order book contributes to a large portion of the total limit order book. Since the total spread measure is a form of a minimum function of static and fleeting orders, it is possible for the total spread measure to be less than either of the static or fleeting spread measure on average.
In Panel B I report the depth measures. In the analyses I focus on three main measures of depth. The first two measures are the cost of a round trip trade for a 1,000 share order and the cost of round trip trade for a 5,000 share order. Both of these measures can be interpreted in a similar way as the quoted spread. The difference being that the CRT measure reflects depth beyond the top of the limit order book. The third measure is the depth weighted average price spread (DWAPspread), which is the difference between the depth weighted bid price and the depth weighted ask price. I also express these measures as a ratio over the quoted spread.
Depth measures of liquidity are not as straight forward to interpret as the top of book measures of liquidity. Fleeting and static orders may selectively provide liquidity throughout the trading day, and as a result, at a given minute during the trading day there may not be enough fleeting or static depth to complete a trade. Therefore, interpretation of depth measures should be done in conjunction with the percentage of time when a round trip trade can be made. Panel B of Table 4 reports depth measures for the complete limit order book, static limit order book, and fleeting limit order book, while Panel C reports the percent of time during the day that a trader can successfully buy and sell q number of shares. From Panel B, the total limit order book depth reveals that a trader wishing to buy and sell 1,000 shares of the average stock can expect to pay 21.67 cents per share. In addition, Panel C reports that a trader is able to complete a 1,000 share trade 100% of the time for the average stock.
22
Comparing fleeting and static orders yields interesting results. From Panel B, The cost to trade 1,000 shares using exclusively static orders would cost a trader 25.43 cents per share, while a trade using exclusively fleeting orders is 5.53 cents cheaper, at 19.91 cents per share. Comparing cost alone, however, is not sufficient. Panel C reveals that the static limit order book is able to provide 1,000 shares of depth at the bid and offer side of the limit order book 100% of the time for the average stock. The fleeting limit order book, however, can only accommodate a 1,000 share order at the bid and offer side of the limit order book 29% of the time for the average stock (Panel C, row 3). The results suggest that for the average minute, for the average stock, fleeting orders are priced competitively, but are used selectively for providing liquidity to the market.
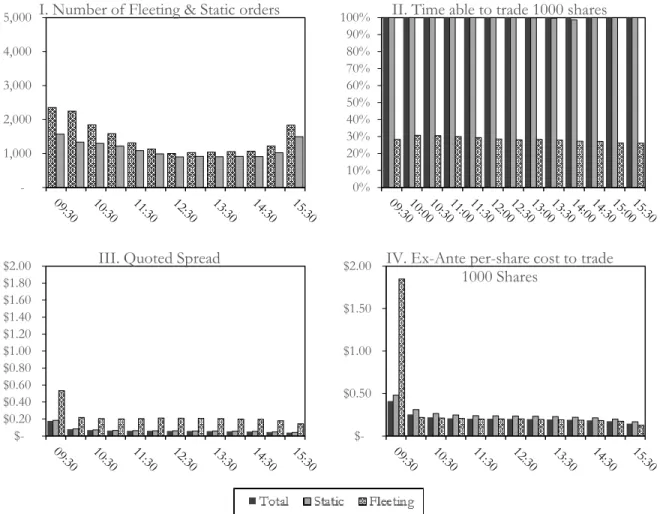
It is possible that some of these characteristics are driven by the time of the day, since markets are generally more active at the beginning and end of the trading day. Figure 2 presents some of the liquidity measures partitioned by time of day. Panel 1 shows that there are generally more orders submitted at open to close. The results in Panel B suggest that there is sufficient depth on the total limit order book and static limit order book to accommodate a 1000 share trade throughout the entirety of the trading day, but approximately only 30% of the time on the fleeting limit order book. The cost to trade, measured as the quoted spread and CRT1000 are highest in the morning, and significantly drop for the remainder of the trading day.
A concern these results is that fleeting orders are orders submitted primarily by algorithmic traders who primarily trade in large securities. 5 For example, Brogaard, Hendershott, and Riordan (2014) find that high frequency traders trade over $241 million in large capitalization securities, but only $4.8 and $0.48 million in medium and small capitalization securities. In Table 5, I report the CRT depth measures, partitioned by market capitalization quintiles. The CRT cost measure is
5 Hasbrouck and Saar (2013) find their measure of algorithmic trading, strategic runs, is highly correlated with HFTs
23
presented, along with the percentage of time available to complete the trade in brackets. The results show that fleeting orders do supply more liquidity in high capitalization securities, but the amount of time is still much lower than static orders.
Thus far I have considered fleeting and static orders as independent factors that impact total liquidity. The true limit order book that is displayed in real time is created by traders submitting both fleeting and static orders simultaneously. I address the simultaneous impact that fleeting and static orders have on total liquidity while controlling for other major influences like time of day, price, minute volatility, and stock volatility. The main regression estimates the effect that fleeting and static liquidity have on complete liquidity. I run cross-sectional minute regressions of the following form:
𝑇𝑜𝑡𝑎𝑙𝑖,𝑡 = 𝛽0+ 𝛽1𝑆𝑡𝑎𝑡𝑖𝑐𝑖,𝑡+ 𝛽2𝐹𝑙𝑒𝑒𝑡𝑖𝑛𝑔𝑖,𝑡+ 𝛽𝑥𝑋𝑖,𝑡+ 𝜆𝑖 + 𝜆𝑡+ 𝜀𝑖,𝑡 (8) where Total is the liquidity measure for the total limit order book for firm i at minute t. I use both top-of-book liquidity measures (spread and price impact) and depth liquidity measures (CRT and DWAP). Static is the liquidity measure for the static limit order book, and Fleeting is the liquidity measure for the fleeting limit order book. The regression results for top-of-book liquidity measures are reported in Table 6, and depth liquidity measures are reported in Table 7. Control variables are represented by the matrix X, and include the log of the market capitalization for firm i, log of the daily closing price, the price volatility for minute t and the daily price range. I also include fifteen minute time-of-day fixed effects and firm fixed effects.
Table 6 presents the results from estimating equation 8 using top of book liquidity measures. The dependent variable in models [1] through [3] is the quoted spread, in models [4] through [6] it is the effective spread, and I regress price impact in models [7] through [9]. The two key variables in all equations is the static and fleeting measure of liquidity, which is the same
24
liquidity measure as the dependent variable in each of the nine regressions. To account for minute volatility I include the volatility of the midpoint, and to capture daily volatility I use the stock’s range, which is the daily high price minus the daily low price. I also control for stock prices and market capitalization. Each liquidity measure is computed with the fleeting and static measure independently, as well as the measures regressed together.
The results for top of book liquidity measures are fairly consistent. Both static and fleeting liquidity measures are usually positively associated with total liquidity. However, the static limit order book has a larger impact on total liquidity. On average, a one dollar increase in the fleeting quoted spread leads to a 12.11 cent increase in the total quoted spread (with the same holding true for a decrease in spread) while a one dollar increase in the static quoted spread leads to an 55.75 cent increase in the total quoted spread (with the same holding true for a decrease in spread). The Wald statistics report that the coefficients for the static and fleeting liquidity measures are significantly different from each other. From column 6, a one dollar increase in the fleeting effective spread will increase the effective spread of the total limit order book by 0.55 cents, and a one dollar increase in the static effective spread will lead to a 49 cent increase in the total limit order book effective spread (again, the same holding true for a one dollar decrease). There are similar results for the effective spread and price impact for static depth, but fleeting depth does not have a significant impact on total liquidity. Finally, from column 9, it appears that a one percent increase in the price impact of static orders increases the price impact of the total limit order book, while fleeting orders have little effect. The top of book liquidity results in Table 6 show that static orders are positively impacting the total limit order book, which provides support for Hypothesis 1, the static depth hypothesis. However, the fleeting limit order book has little impact on the total
25
limit order book, which does not support Hypothesis 2, the fleeting depth hypothesis. I now turn to measures that account for liquidity beyond the top of the limit order book.
Table 7 presents the results from estimating equation 8 using depth liquidity measures. The specifications are identical to the models in Table 6, where depth measures are used in place of top-of-book measures. The dependent variable include the CRT1000 in models [1] through [3], the CRT5000 in models [4] through [6] and the DWAP spread in models [7] through [9]. In models [3], [6], and [9], total depth is regressed on static and fleeting depth. The results presented in model [3] show that a one dollar increase in the cost to trade 1000 shares on the static limit order book leads to a 83 cent increase in the total limit order book (with the same holding true for a one dollar decrease), while fleeting depth has no impact on the total limit order book. The results in Column [6] are even stronger, suggesting a one dollar increase in the cost of a round trip trade of 5,000 shares on the static limit order book will lead to nearly a 93 cent increase on the total limit order book. However, fleeting orders have little impact. Column 9 provides a marginal support that fleeting orders have an impact on liquidity, where a one dollar increase in the fleeting DWAP spread will lead to an increase in the total limit order book DWAP spread by 13.63 cents, which is significant at the 1% level.
The results displayed in tables 6 and 7 have interesting implications. Both the top-of-book and depth measures of liquidity show a consistent and strong relation between the static limit order book, which provides ample support for the static depth hypothesis, which states that static orders have a positive and significant impact on total liquidity. Static orders are consistently at the top of the limit order book, providing competitive prices for traders. Static orders also remain on the limit order book to allow traders to complete large roundtrip trades. Since there is a week and often insignificant relation between the fleeting limit order book and total limit order book, I find little
26
support for the fleeting depth hypothesis. Fleeting orders have a small impact on top of book of liquidity measures, and in most of the model specifications fleeting orders do not contribute significantly to the depth of the total limit order book. It is important to note that although there isn’t a strong positive relation, there isn’t a strong negative relation either. This would suggest that fleeting orders may more appropriately be described as contributing noise to the markets, rather than contributing to depth and liquidity.
SIMULTANEITY OF FLEETING AND TOTAL LIQUIDITY
The results of the tests so far are assume an exogenous relation between fleeting orders and current spread and depth, since fleeting orders are defined ex-post. However, there is concern of endogeneity due to simultaneity. By construction, fleeting and static orders impact limit order book depth, and the results presented so far address this relation. But, it is possible that the current state of the limit order book will directly impact the behavior of orders, in particular fleeting orders. Hendershott and Riordan (2013) find that when spreads are narrow, algorithmic and high frequency traders are less likely to cancel outstanding orders. If fleeting orders are submitted by computers and algorithms, then the number of fleeting orders should be lower when spreads are narrow and current liquidity is high. Additionally, one could argue that traders initially submit orders with no intent of the order being a fleeting order. However, as market parameters and the limit order book changes, traders will revise their orders by canceling their current order and submiting new orders reflecting new information. This view is in agreement with theory by Baruch and Glosten (2013). I therefore attempt to control for this possible endogeneity problem.
27
This subsection reports two different approaches to test for potential endogeneity. The first robustness test I employ uses the prior period’s fleeting and static liquidity on the current period’s total liquidity. I run the following regression:
𝑇𝑜𝑡𝑎𝑙𝑖,𝑡 = 𝛽0+ 𝛽1𝑆𝑡𝑎𝑡𝑖𝑐𝑖,𝑡−1+ 𝛽2𝐹𝑙𝑒𝑒𝑡𝑖𝑛𝑔𝑖,𝑡−1+ 𝛽𝑥𝑿𝑖,𝑡+ 𝜆𝑖+ 𝜆𝑡+ 𝜀𝑖,𝑡, (9) where Total is the measure of liquidity for the entire limit order book. Static and Fleeting are the liquidity measures for the static and fleeting limit order book for the one minute period prior. The logic of this test is that fleeting orders from the previous minute are a function of the complete limit order book at that time period. Using lagged measures of Static and Fleeting liquidity eliminates contemporaneous correlation, since there is no feasible mechanism for the prior period fleeting orders to be impacted by current period liquidity. Column 1 of Table 8 reports the results for the top of book measure, quoted spread. Column 2 report the results for the depth measure CRT 1000. The results for the quoted book are similar to the results displayed in Table 6, where a one dollar increase in the static spread increase the total spread by 33 cents, and the fleeting spread has little impact. The depth measures do not show any significant relation in this specification.
The second test I employ attempts to model the simultaneous impact of fleeting orders on depth, and the impact of depth on fleeting order submission strategies. In order to alleviate concerns regarding an endogeneity bias, I estimate the simultaneous equation using two-stage least squares (2SLS).6 The system of equations estimated is:
6 For robustness I regress the entire system of equations in a 3SLS framework. The magnitude and significance of
28 1st Stage: 𝐹𝑙𝑒𝑒𝑡𝑖𝑛𝑔𝑖,𝑡 = 𝛽0+ 𝛽1𝐹𝑙𝑒𝑒𝑡𝑖𝑛𝑔𝑆𝑝𝑟𝑒𝑎𝑑𝑖,𝑡−1+ 𝛽2𝑇𝑜𝑡𝑎𝑙𝑆𝑝𝑟𝑒𝑎𝑑𝑖,𝑡−1 + 𝛽3𝐹𝑙𝑒𝑒𝑡𝑖𝑛𝑔𝐷𝑒𝑝𝑡ℎ𝑖,𝑡−1+ 𝛽4𝑇𝑜𝑡𝑎𝑙𝐷𝑒𝑝𝑡ℎ𝑖,𝑡−1+ 𝛽𝑥𝑋𝑖,𝑡 + 𝜆𝑖 + 𝜆𝑡+ 𝜀𝑖,𝑡 (10) 2nd Stage: 𝑇𝑜𝑡𝑎𝑙𝑖,𝑡 = 𝛽0+ 𝛽1𝑆𝑡𝑎𝑡𝑖𝑐𝑖,𝑡+ 𝛽2𝐹𝑙𝑒𝑒𝑡𝑖𝑛𝑔̂ 𝑖,𝑡+ 𝛽𝑥𝑋𝑖,𝑡+ 𝜆𝑖 + 𝜆𝑡+ 𝜀𝑖,𝑡, (11)
where equation (10) is the first stage of the system estimated. In this system I regress the current period measure of fleeting order liquidity on the prior period liquidity measures of fleeting order and total limit order book liquidity. I use both spread and depth as exogenous variables. Since there is no economic mechanism in which prior period liquidity can be impacted by current period liquidity, and they are highly correlated with current period fleeting order strategies, all four variables satisfy necessary conditions to be used as instrumental variables. In addition to the four instruments, I include the matrix of control variables X.
The predicted value for fleeting liquidity is then used as on exogenous variable in the second stage of the regression, as shown in equation (11). In this stage I regress total liquidity on static orders and fleeting orders.7 The results are presented in columns 3 through 9 of Table 8. I use multiple depth measures to test for robustness. A number of interesting results are presented when controlling for the possibility of fleeting orders responding to current liquidity characteristics. The strong impact of static liquidity on total market liquidity remains for both top of book measures (columns [3] through [5]) and depth measures (columns [6] through [9]). However, fleeting orders provide mixed results. There is evidence that fleeting order have a marginal positive impact on liquidity, which is evident in the effective spread, and the DWAP
7 Static orders do not have the same concern of endogeneity that fleeting orders do. Economic and theoretical
reasoning do not suggest that static orders constantly revise their order submission strategies in the way that fleeting orders do.
29
ratio, and there is evidence of a negative impact in price impact and the cost to trade 5000 shares. The remaining models show an insignificant relation between fleeting orders and the market quality of the limit order book. In general, the results and the implications are similar to those from Tables 6 and 7, which is that fleeting orders do not have a significant positive impact on liquidity. I therefore conclude that the results are not subject to simultaneity issue of traders adjusting their orders depending on the current market liquidity.
30
V. THEORETICAL IMPLICATIONS OF FLEETING LIQUIDITY
In this section I test the theoretical predictions on fleeting orders. Rosu (2009) predicts that fleeting orders only occur when the spread is low, and depth is high. Rosu also predicts that fleeting orders are only submitted within the bid-ask spread. Baruch and Glosten (2013) predict that when there are a many fleeting orders, the depth provided by fleeting orders should be static and constant.
First, I test the prediction of Rosu (2009) that fleeting orders only occur when the limit order book is full (spread is at a minimum nonzero tick size). Empirically it is unlikely for a limit order book to ever be classified as full, since this would require the exchange to set a cap on the number of orders allowed on the limit order book. Therefore I test this theory by comparing fleeting orders during periods of high depth relative to periods of low depth. I partition fleeting orders for a given stock-day into depth quintiles. I test Rosu’s theory by comparing the ratio of fleeting orders to static orders during the minutes that experienced the highest depth against the minutes that experience the lowest depth. Panel A and B in Table 9 display the results for sorting on the cost of a round trip trade, while Panel C reports the results for sorting based off of quoted spread.
When partitioning depth according to the CRT1000, there are 1,981 more fleeting orders submitted during periods with high liquidity relative to low liquidity. The same holds true for static orders, where there are 2,095 more static orders submitted during periods of high liquidity. Comparing number of orders alone doesn’t effectively test the theory, since by construction, there are more order submitted during periods of higher depth. Therefore, in order to better test the
31
theory we look at the ratio of fleeting to static orders, since the theory suggests that traders will switch from patient orders to impatient static orders during periods of high depth. The third row in Table 9 shows that during periods of high liquidity there are approximately .74 fleeting orders to every static orders, but during low liquidity there are 1.09 fleeting orders to every static order. The difference is highly significant. These results are consistent when partitioning by CRT5000, and by spread. Since fleeting orders provide a larger proportion of order flow when depth is low, there is no support for Hypothesis 3. The results from Table 9 provide little evidence supporting the prediction of Rosu (2009) that fleeting orders only occur when depth is high.
A second prediction of Rosu (2009) is that fleeting orders are only submitted within the bid-ask spread, which is identified as Hypothesis 4 in this study. To test this theory I separate all orders into one of three categories: orders that improve the BBO (submitted within the spread), orders that match the BBO, and orders behind the BBO. I calculate the number of fleeting, static, and total orders that fit into these three categories. I also calculate the percent of fleeting orders, static orders, and total orders that are in these categories. Table 10 reports the results. Approximately 14% of fleeting orders, and 9% of static orders are submitted within the bid-ask spread, making 11% of total orders being price improving orders. In addition, over 39% of fleeting orders match the BBO. Static orders are a little less with 31% of the orders matching the BBO. Finally, 47% of fleeting orders are behind the BBO while 60% of static orders are behind the BBO. All differences are all significant at the 1% level. The results do not provide strong evidence for Rosu (2009), which is admittedly a strong prediction. Although not all of fleeting orders are submitted within the spread, over half of fleeting orders are competitive orders, with 53% being priced at the top of the book or better. The results from Table 10 provide marginal support for Hypothesis 4 that fleeting orders are priced within the bid-ask spread.
32
The final theoretical prediction I test is from Baruch and Glosten (2013), who predict that fleeting orders may lead to forecastable and constant depth. The theory suggests that when there are only a few traders submitting fleeting orders, quotes will flicker and depth will not be constant. However, as the number of traders submitting fleeting orders increase, depth will be constant and quotes will appear static. I test this theory by partitioning stock-days into three fleeting order partitions based on the number of fleeting orders. In each partition I calculate the volatility of the total quoted spread, the static quoted spread, and the fleeting quoted spread. If depth is constant and forecastable when there are many fleeting orders, then the volatility of the fleeting quoted spread should be low, and indifferent from the total quoted spread in the highest tercile of fleeting orders.
Table 11 reports the results of this test. Column 1 displays the lowest tercile of fleeting orders during a stock day. In the lowest tercile of fleeting orders, the quoted spread is 0.53 cents. However, during periods when there are large numbers of fleeting orders, the quoted spread increases to 3.25 cents. The theory of Baruch and Glosten (2013) suggests that the top of book depth and spread should be more constant when there are high numbers of fleeting orders and flickering quotes, however we find that depth becomes less forecastable and less constant. These results further support the notion that fleeting orders introduce noise into financial markets.
33
VI. CONCLUSION
This paper investigates market quality in low latency markets. One of the externalities of low-latency markets is fleeting orders, which are orders that only provide liquidity for a few seconds before being canceled. I compare the characteristics of fleeting orders against longer duration orders to study market quality in low-latency markets. Theory by Rosu (2009) and Baruch and Glosten (2013) suggest that liquidity providing traders may submit fleeting orders and static orders, and should have a positive impact on market liquidity. Empirically, I separate short duration (fleeting) orders from long duration (static) orders to isolate the impact that each type of order has on market quality. In addition to comparing fleeting orders against static orders, I determine how much each type of order contributes on total liquidity.
The results suggest that static orders have a large and significant impact on total liquidity. The best bid and best offer prices are largely determined by static orders. Additionally, static orders significantly contribute to the total depth in the market. I find little support that fleeting orders positively impact liquidity. Fleeting orders have little to no impact on the best bid and offer, and do not provide depth for traders submitting large trades. The results suggest that fleeting orders provide more noise than liquidity.
There is concern that fleeting orders and total market liquidity are endogenous. Fleeting orders by construction impact market liquidity, however, if fleeting orders are submitted by traders who monitor current market activity, then there is a simultaneity issue. I employ two-stage least squares to model the endogeneity. The results are robust to any issues of simultaneity.
34
This paper also tests previously untested implications of the theoretical literature on fleeting orders. Rosu (2009) predicts that fleeting orders are more likely when depth is high and spread is low. I find that there are more fleeting orders submitted when depth is high, as well as more static orders. However, the ratio of fleeting orders to static orders is higher when depth is low. Rosu (2009) also predicts that fleeting orders are only submitted within the bid-ask spread. I find that approximately 15% of fleeting orders are submitted within the bid-ask spread, which is not statistically different than the number of static orders submitted within the bid-ask spread. These results only partially support the theory by Rosu. Baruch and Glosten (2013) predict that large numbers of fleeting orders should have constant and forecastable depth. I find that during periods of high fleeting order activity, volatility of the best bid and offer for the total limit order book and fleeting limit order book increase, which does not support the theory by Baruch and Glosten, and adds to the notion that fleeting orders are introducing noise to financial markets.
35