Literacy Boost
Pakistan
Year 1 Report
April 2011
Shahzad Mithani, Imtiaz Alam, Jalal Afsar Babar, Amy Jo
Dowd, Jessi Hanson, & Cecilia Ochoa
With special thanks to the team of enumerators: Hidayat Ullah, Aisha
Bibi, Asma Safdar, Intizar Ahmad, and Shakeel Ahmad
Executive Summary
In 2010, Save the Children began implementing the Literacy Boost program – an intervention focused on working with teachers and communities to improve children’s reading skills – in Allai tehsil, part of the Battagram District in Khyber Pakhtunkhwa Province (formerly called the Northwestern Frontier Province), Pakistan.
Literacy Boost features a set of adaptable emergent literacy and early grade assessments used to detail the skills present when Literacy Boost begins and chart progress throughout the intervention. Baseline data were collected in 15 schools in December 2009, and endline data were collected a year later, December 2010. There are 5 comparison schools and 10
intervention schools. The schools in the sample are from a larger group of 150 schools being supported by the Partnership for Reconstruction and Development of Allai (PRDA), a multi-sector project funded by the Netherlands government. It is important to note that the comparison schools also received school improvement assistance through the PRDA, but not the reading skills-focused, mother tongue (Pashto)-supportive interventions that were
introduced only in the 10 Literacy Boost schools. Pashto-focused pieces of the Literacy Boost intervention included the development of beginning reading primers; and the conduct of intensive 6-day Pashto language training sessions on the use of Pashto in the classroom in
partnership with the Provincial Institute for Teacher Education (PITE) under the Elementary and Secondary Education Department of Ministry of Education Department Khyber Pakhtunkhwa Province.
This study reports on the difference in learning during the 2010 school year between PRDA beneficiaries and PRDA + Literacy Boost beneficiaries. There is no control group of student who received no educational intervention. The 15 schools covered by the evaluation were identified by Save the Children program staff in 2009 based on accessibility, location, stability of teaching staff, enrollment size and community response.
Background information shows the children from Literacy Boost and comparison schools come from similar socioeconomic backgrounds and literacy environments. At baseline, comparison school students had significantly higher average scores than Literacy Boost schools students in: concepts about print, letter knowledge, Urdu fluency and accuracy, and reading and oral comprehension in both Pashto and Urdu. Additionally, comparison students at baseline also demonstrated higher average scores in all other measures. Yet at endline, the children in Literacy Boost schools significantly outperformed their comparison school peers in both end of year scores and gain in scores during the year in: concepts about print, letter knowledge, Pashto fluency, accuracy, and reading comprehension, as well as Urdu fluency, accuracy, and reading comprehension. Literacy Boost enabled students to overcome the significant deficits they began with on these skills.
The Pakistan and DECD teams set a benchmark at the 75th percentile score for each score in the baseline sample and challenged themselves to have most children reading at this level or higher by year’s end. We used this data-generated benchmark because the baseline represents a first foray into measuring these skills among Pashto-speakers learning to read Urdu in school.
The endline data collection confirms a substantial gain in skills among Literacy Boost students— in many cases exceeding the 75th percentile benchmark.
Literacy Boost demonstrated positive effects on girls’ reading skills, promoting their learning even in a context where girls face great challenges. Girls in Literacy Boost schools had better reading skills development across the skills and greater learning in both Urdu and Pashto compared to girls in comparison schools. Results were mixed when comparing the gains of Literacy Boost girls versus boys—further monitoring will be needed to ensure that both girls and boys are able to consistently participate in and benefit from Literacy Boost activities. Endline results demonstrated the positive impact on learning of participation in Literacy Boost Reading Camps and Reading Buddies. Children who participated in these activities more frequently had higher average reading scores in many assessment elements as well as
demonstration of positive reading behaviors such as being able to name their favorite story or book, its title, and provide a summary.
These positive results offer evidence that Literacy Boost action in schools and communities benefits children and promotes a culture of reading. The bullets below detail the impact skill by skill:
• Concepts about print: Literacy Boost students’ baseline scores were significantly below comparison school scores, but Literacy Boost supported significantly greater concepts about print learning because they improved by 5.6 points on average compared to 1.7 point gain experienced by comparison schools.
• Letter knowledge: Literacy Boost promoted significantly higher end of year average letter knowledge scores and letter learning during the school year, as Literacy Boost students learned 13.2 letters on average compared to 2.2 letters in comparison schools.
• Pashto Fluency: No one read much Pashto at baseline and Literacy Boost and comparison scores were equal. At the start of the school year, 90 percent of Literacy Boost students qualified as non-readers in Pashto against the 87 percent of comparison school students. By endline, Literacy Boost Pashto non-readers fell to 13 percent, significantly below
comparison schools with 56 percent non-readers. Further, Literacy Boost students read at a rate of 31 words per minute, significantly faster than comparison school students and above the program benchmark. We conclude that Literacy Boost promoted higher end of year Pashto fluency and supported greater Pashto fluency learning during the school year.
• Pashto accuracy: As the Literacy Boost Pashto accuracy scores at baseline were significantly below comparison school scores, and endline, they read 60.7 percent of the passage words correctly, significantly more and in fact more than twice the percent read correctly by comparison children at 21.8 percent. We conclude that Literacy Boost promoted higher end of year Pashto accuracy and supported greater Pashto accuracy learning during the school year.
• Pashto comprehension: The program supported students to become fluent and accurate enough Pashto readers to answer reading comprehension questions after reading the text themselves. This was not the case for 93 percent of Literacy Boost students at baseline, but it was for 90 percent at endline. Literacy Boost also promoted significantly higher end of
comparison school students who averaged 2.21 answers correct. The assessment further identified children struggling to both read and understand spoken Pashto.
• Urdu Fluency: Literacy Boost baseline Urdu fluency scores were significantly below comparison school scores, yet Literacy Boost promoted higher end of year Urdu fluency at 47 words per minute compared to 37 words per minute in comparison schools, and
supported greater Urdu fluency learning during the school year. Further, 73 percent of Literacy Boost qualified as Urdu non-readers at baseline (reading 0 WPM of the passage) while significantly fewer, only 49 percent of comparison students were non-readers. Yet by close of year, the percentage of non-readers in Literacy Boost schools was significantly lower than comparison schools, 7 percent verses 13 percent.
• Urdu accuracy: Literacy Boost promoted higher end of year Urdu accuracy scores on average and supported greater Urdu accuracy learning during the school year, as Literacy Boost students progressed from 17.15 of words read correctly on average percent to 77.89 percent while comparison school students progressed from 37.24 percent accuracy to 65.82 percent accuracy.
• Urdu comprehension: As with Pashto, Literacy Boost supported students to become fluent and accurate enough Urdu readers to answer reading comprehension questions after reading the text themselves. It also promoted significantly higher end of year Urdu
comprehension (2 of four questions correct versus 1 in comparison schools). There is still room for improvement in both Urdu and Pashto comprehension.
• Impact for Girls: Literacy Boost girls at baseline demonstrated more limited reading skills than comparison girls in: concepts about print, letter knowledge, and accuracy and fluency in both Urdu and Pashto. Yet at endline, girls in Literacy Boost schools showed significantly higher learning outcomes than girls in comparison schools in: concepts about print, letter knowledge, Pashto fluency, accuracy and comprehension, and Urdu comprehension. Moreover, Literacy Boost girls began significantly below comparison school girls in Urdu fluency, yet by endline Literacy Boost significantly outperformed their peers. The program promoted higher end of year Urdu reading scores on average and supported greater Urdu learning during the school year.
Qualitative research processes such as focus group discussions and key informant interviews were also conducted at the time of the endline to determine stakeholder perceptions of changes that had taken place in children’s literacy and learning environments through Literacy Boost. Parents, teachers and community reading facilitators interviewed all noted that children were now more confident and participative learners. Some stakeholders added that Literacy Boost helped to make children’s attendance in school more regular because they were motivated to participate in after-school reading activities such as Reading Camps. Children appreciated most the availability of books and the opportunity to practice their language skills through Reading Camps. Parents were particularly enthusiastic about the village-level
community reading awareness sessions that had been introduced through Literacy Boost, which allowed them to learn parental behaviors and interactions they could do with their children at home to support their learning, even if they were not literate themselves.
Contents
Introduction ... 5
Save the Children assistance to Literacy Boost and comparison schools ... 8
Student Background Findings ... 9
Absence at Endline ... 10
Household Literacy Environment ... 10
Impact on Student Learning Outcomes ... 12
Concepts about Print (CAP) ... 13
Letter Knowledge ... 14
Pashto Fluency ... 15
Pashto Accuracy ... 16
Pashto Reading Comprehension ... 16
Pashto Oral Comprehension ... 17
Urdu Fluency ... 18
Urdu Accuracy ... 19
Urdu Reading Comprehension ... 19
Urdu Oral Comprehension ... 20
Impact on Boys and Girls ... 22
Literacy Boost Girls versus Boys ... 22
Literacy Boost Girls versus Comparison Girls ... 23
Impact on Student Reading Habits ... 24
Relationships between Student Background, Household Literacy and Reading Skills ... 26
Learning Letters ... 26
Learning to read Pashto Fluently ... 27
Learning to read Pashto with Accuracy ... 28
Learning to read Urdu Fluently ... 29
Learning to comprehend Urdu text ... 30
Stakeholder perceptions about Literacy Boost impact... 31
Changes in children: the effect of Book Banks, Reading Buddies and Reading Camps ... 32
Changes among parents: the effect of community mobilization and community reading awareness sessions . 34 Changes in teaching practices: the effects of teacher training sessions focused on the 5 core skills of reading ... 31
Introduction
In 2010, Save the Children began implementing the Literacy Boost program – an intervention focused on working with teachers and communities to improve children’s reading skills – in Allai tehsil, Battagram District of the Khyber Pakhtunkhwa (KP) Province in Pakistan. The Literacy Boost assessment features emergent literacy and early grade reading assessments used to detail the skills present when Literacy Boost begins and to chart progress throughout the intervention. These data are also used to adapt the intervention’s teacher training and
community activities. Literacy Boost was implemented in 10 schools with a focus on children in grades 1 to 3. Key interventions implemented in the 10 schools included:
• a 9-module teacher training on explicit reading instruction, conducted in monthly cycles;
• development of Pashto reading primers and alphabet charts;
• provision of community-based Book Banks containing Urdu storybooks and Pashto reading primers;
• establishing a Reading Buddy system in schools in which older children read to younger children;
• conducting weekly Reading Camps run by trained Reading Camp Leaders
• conducting regular community reading awareness sessions with parents
• conducting Story Time activities in the community.
In addition to these Literacy Boost-specific interventions, the 10 pilot schools and 5 comparison schools also received general teaching-learning materials assistance, a 6-day teacher training on active learning strategies, and School Health & Nutrition interventions as part of the
Partnership for the Recovery and Development of Allai (PRDA) project, which Save the Children was implementing in 150 schools throughout the Allai tehsil.
This report details the end of school year reading skills and characteristics of the students in 10 Literacy Boost intervention schools and 5 comparison schools within the area, in order to compare the impact of the Literacy Boost program on children’s reading and literacy
development. The background data collected at baseline and at endline demonstrated that the children from Literacy Boost and comparison schools share similar socioeconomic backgrounds and literacy environments.1 The 2009 baseline further established that students in Literacy Boost schools scored lower than their peers from comparison schools on average on the majority of assessment components. Significant deficits were present in: concepts about print, letter knowledge, Urdu fluency and accuracy, and reading and oral comprehension in both Pashto and Urdu. Pashto fluency and accuracy was lower as well, but not significantly so. It was therefore the goal of Literacy Boost during the 2010 school year to demonstrate higher relative achievement where scores were equal at baseline or, to close the gap represented by these significantly lower scores in Literacy Boost sites.
1Full information on the children was recollected to triangulate any differences. The only notable difference is
Save the Children assistance to Literacy Boost and comparison schools
As was noted earlier, all 15 schools in this study were part of the PRDA intervention area. They all received a standard package of assistance provided to all 150 PRDA-assisted schools. Specifically, these included:
• School Health & Nutrition interventions such as deworming, Vitamin A supplementation, water and sanitation facilities and child-focused health education;
• Provision of teaching-learning materials for classrooms, including libraries-in-a-box with Urdu books, wall charts in Urdu and English, math manipulatives, and Urdu alphabet cards; • A 6-day teacher training on basic pedagogy and active learning strategies, covering a total of
27 topics.
Literacy Boost schools also received intensive early grades reading-specific interventions targeting children from grades 1 to 3 both in the classroom and in the community. These additional interventions involved children, their parents and teachers.
Children in Literacy Boost schools:
1. were paired off with older students to form Reading Buddies, who would practice reading with them after school.
2. were assigned to attend weekly Reading Camps facilitated by Reading Camp Leaders, where they were exposed to read aloud activities, discussions about the stories read, games focused on the five reading skills, songs/poems, and writing/drawing tasks through journaling.
3. were able to use and bring home materials from community-based Book Banks that
included Pashto reading primers developed by the Provincial Institute for Teacher Education (PITE) under the Elementary and Secondary Education Department of Ministry of Education Department Khyber Pakhtunkhwa, as well as commercially available Urdu storybooks.
Parents:
1. participated in the community mobilization sessions where findings from the baseline reading assessments were shared to underscore the urgency of supporting children’s reading through Literacy Boost
2. were invited to attend five community reading awareness sessions, conducted by Community Reading Facilitators recruited locally for this purpose.
Teachers:
1. were trained on how to explicitly teach the five core reading skills through monthly training sessions, using the 9-module Literacy Boost teacher training toolkit.
2. were visited regularly by Save the Children staff, who also followed up on the Reading Buddy activities and observed classes to check that reading strategies imparted during the training were being used in classrooms and strengthen this practice.
3. received Pashto reading primers and a special alphabet chart that included both Urdu and Pashto letters.
The partnership with PITE on Pashto materials creation and Pashto language instruction was pursued to strengthen Ministry of Education (MoE) involvement in and ownership of the
Literacy Boost materials that were being developed. By involving PITE, Save the Children efforts to promote the use of Pashto in children’s literacy acquisition gained stronger support within the MoE. This may have also spurred the recent policy push from the provincial MoE to promote the use of Pashto as a language of instruction from grade 1 to 12 in the KP province, in districts where Pashto is the dominant mother tongue.
Three Save the Children Allai staff were tapped to focus on Literacy Boost activities in the 10 schools—two males and one female. Due to the cultural context in Allai, activities with older girls, female teachers and mothers had to be conducted separately, thus the importance of having a female staff member oversee those activities. For this same reason, the Allai team had to recruit female Reading Camp Leaders (RCLs) and female Community Reading Facilitators (CRFs) for all 10 schools implementing Literacy Boost, in consultation with key leaders and community members in the different villages or union councils.
Involving female community members in project implementation is relatively new in Allai, and initially challenging. Because there are few girls’ secondary schools in Allai, there were not as many females with sufficient literacy skills that could be recruited. Once qualified females were found, the SC staff had to explain to village leaders, husbands and fathers the purpose and urgency of these activities. The female RCLs and CRFs also needed to be trained in their respective homes or communities, in keeping with cultural norms; this meant that activities for girls’ schools, female teachers and mothers were slightly delayed in starting up. By the time of the endline, however, activities led by female community members were in full swing, and enjoyed the support of community leaders as well as parents in the villages.
Because all schools in the study had some intervention, this report provides information on how students receiving a broad range of Save the Children education assistance are faring in terms of their reading skills, and then investigates what value-added Literacy Boost
interventions can bring to improve reading outcomes among students in this subset of Save the Children-assisted schools. Throughout this report, we refer to these two set of schools as Literacy Boost schools and comparison schools.
Methodology
The 15 schools in this study were selected from a larger set of 150 schools in Allai based on accessibility, location, stability of teaching staff, enrollment size, and community responsiveness. Because the intent was to field test the Literacy Boost model as adapted to the Allai/Khyber Pakhtunkhwa Province context, the 15 chosen schools were a mix of girls’ government primary schools (GGPS) and government primary schools (GPS). The Pakistan team selected these schools in consultation with the Education District Office (EDO), and were a mix of average performing and better performing schools in the area. From these 15 schools, ten schools were selected for Literacy Boost implementation as they were situated in groups of two or three in close proximity and therefore logistically feasible to support. The five remaining schools became the comparison group for the study.
Baseline reading assessments were conducted at the end of the 2009 school year among a total of 243 grade 2 pupils from the 15 schools. The study targeted a sample of 20 children per school. Where schools had more than 20 grade 2 students, the sample was randomly selected; where schools had less than 20 grade 2 enrollees, all grade 2 students were assessed. Of the 243 children assessed at baseline, 166 were from Literacy Boost schools and 77 were from comparison schools.
Endline reading assessments were conducted a full year later, at the end of the 2010 school year. The study sought out the same children who were assessed at baseline, who were now in grade 3, to track their progress over time. A total of 239 children were assessed at endline, using a replacement methodology when baseline children were missing to enable consideration of school-based averages over time. There are 190 children for whom we have baseline and endline data. Of the 53 baseline children who were not available at endline, 21 were sick, 22 had dropped out, and 10 were absent for various other reasons. The absence rate in
comparison schools was 13 percent, higher than the 7.8 percent absence rate in Literacy Boost schools, while dropout rates were similar at 9 percent in both school types.
This report will focus on the 190 students assessed at both baseline and endline, and compare means using t-tests to analyze the comparability of the two groups to investigate Literacy Boost impact on reading skills and habits. It will then present results of multilevel regression models that account for clustering in schools to explore relationships between reading skills, reading habits and background factors. In addition to the quantitative reading assessment data, the Save the Children team conducted 8 key informant interviews, informal classroom observations in 6 schools, and 8 focus group discussions among Literacy Boost participants during the endline phase. These processes yielded more information about changes in literacy and learning practice in the pilot communities. This report also documents findings from those interviews and group discussions.
A note about benchmarks
While Save the Children has used this approach to reading assessment in Malawi, Nepal, Ethiopia, Philippines, Haiti, Mali, Vietnam, Guatemala, Uganda, Yemen, Bangladesh, and Mozambique, comparison across countries and languages is less helpful than more detailed contextual information for setting expectations of impact. For each measure used in these assessments, the baseline established the upper end of the range of scores (the 75th percentile) as a benchmark, or a reasonable estimate of what is currently possible among these children. In the presentation of each skill, this report will consider whether the groups of students in each school type met this benchmark. At the end of the results section, we will review our first year progress in meeting these goals and consider appropriate targets for year 2.
Student Background Findings
Table 1 summarizes student background data, and presents the average for the Literacy Boost and comparison schools.
Table 1: Student Background Data
Literacy Boost
N=135 Comparison N=55
Age (yrs.) 10.23 10.45**
Height (cm) 131.36 157.08
Weight (kg) 26.85 29.29
Female 36% (64% Male) 36% (64% Male)
Pashto-Speaking 96% 93%*
Gojri-Speaking 4% 7%*
Work before school 19% 24%
Distance to school (1-120 min.) 19.96 17.21
Household size (rooms) (1-9) 3.39 3.53
Have livestock 84% 82%
Types of Livestock (0-14) 2.33 2.65
Household appliances (0-15) 1.84 2.22
(Significant difference of p=*<.05, **<.01)
Comparison school children are slightly older than the Literacy Boost children who, based on height and weight, are less physically developed – although this may be simply explained by the age difference.
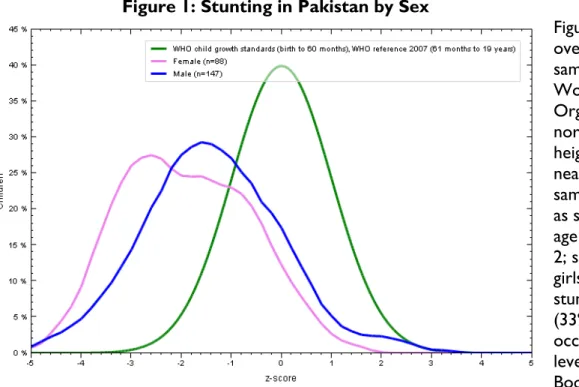
Figure 1: Stunting in Pakistan by Sex
Figure 1 shows that overall children in the sample are below the World Health
Organization (WHO) norms for their height by age and nearly a third of the sample are classified as stunted (height by age zscore less than -2; significantly more girls (53%) are stunted than boys (33%). Stunting occurs at similar levels in Literacy Boost (32%) and
comparison groups (29%), as does wastage but at much lower levels. Looking at body mass index (BMI) by age, 10% of all children and 10% of children within each group the children are wasted (too thin), based on established WHO standards.
Literacy Boost and comparison school students have similar socio-economic statuses (SES). The treatment groups show small differences in the percentage whose families own livestock,
household appliances and the number of types of livestock, all indications of their SES status, but these differences are not large. Over 90 percent of children in each group speak Pashto in their homes, with small groups of Gojri-speakers in each. At baseline, 4 children (1 girl in a Literacy Boost school and 3 boys in comparison schools), report speaking Kohistani at home, but a year later three of them report speaking Pashto at home and one was not present. In addition, some children report speaking a mixture of Gojri and Pashto, so language might be more fluid for some children than previously acknowledged. Note that Urdu is the language of instruction in the schools and given the prevalence of Pashto in the population, the assessments and interventions were conducted in both Pashto and Urdu.
Absence at Endline
There is an interesting trend to note vis-à-vis absence at endline, SES and gender. Students not in school at the time of the posttest come from homes with fewer/no livestock, which is more frequent for the girls. Those absent at endline also had fewer appliances (1.45) than those who were present at the end of the year (1.88). These findings suggest that SES, gender and the opportunity cost of consistent attendance play a role in determining school participation in these communities.
Overall, the 21.8 percent of the students absent are absent at endline, 21.8 of boys are absent and 21.7 percent of girls are absent. Within groups, however, a higher percentage of Literacy Boost girls (22% girls versus 17% boys) and comparison boys (20% girls versus 31% boys) are absent. In both Literacy Boost and comparison schools, the absent girls were older than their classroom peers, but their average scores for letter knowledge and concepts about print were similar to their classroom peers’ baseline average. The boys who were absent tended to be lower performers on average compared to their classroom peers. While these differences were not significant, they require further study to determine whether those with low learning
outcomes are leaving school or attending less frequently. It is important to note for further analyses of gender and efficiency that these absent girls also had more years of school, including higher grade repetition rates than the boys. Programmatically it is important to consider that Literacy Boost schools had a higher percentage of absent girls than comparison schools.
Household Literacy Environment
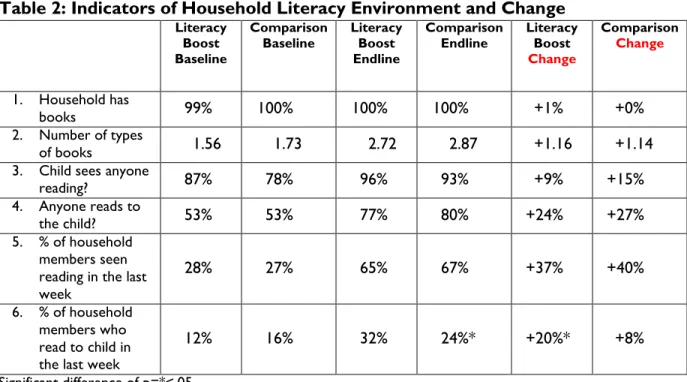
Table 2 demonstrates the change in household literacy environments between beginning and end of year by group. At baseline, both Literacy Boost and comparison schools were similar in all indicators. Nearly all children had books at home, but the variety of books was limited. While the children saw people reading, the frequency was also low as demonstrated by the low percentage of household members seen reading in a week. Even lower was the percentage of household members who read to the child.
Table 2: Indicators of Household Literacy Environment and Change
Literacy
Boost Baseline
Comparison
Baseline Literacy Boost Endline
Comparison
Endline Literacy Boost Change Comparison Change 1. Household has books 99% 100% 100% 100% +1% +0% 2. Number of types of books 1.56 1.73 2.72 2.87 +1.16 +1.14
3. Child sees anyone
reading? 87% 78% 96% 93% +9% +15%
4. Anyone reads to
the child? 53% 53% 77% 80% +24% +27%
5. % of household members seen reading in the last week
28% 27% 65% 67% +37% +40%
6. % of household members who read to child in the last week
12% 16% 32% 24%* +20%* +8%
Significant difference of p=*<.05
By the end of the year, there was a noticeable change in the majority of the indicators towards a more supportive literacy environment. Interestingly, this happened in all schools studied and in many cases to a greater extent in comparison schools. Overall, there are more types of books, a greater percentage of people reading in the home and reading to children, in Allai. According to the Pakistan team, PRDA’s provision of Urdu library materials to all schools, and the fact that baseline reading assessment findings were shared to both Literacy Boost and comparison group schools, may have sparked a heightened concern about reading in both school types. Note that while more comparison school children changed their answer to whether they saw people reading (indicator #4) and were read to (indicator #5), a significantly greater percentage of household members read to the child last week (indicator #6) (p=.030). The 20 percent change in the percentage of people in the home reading to the child last week means that in a household of 10, two more people read to a Literacy Boost student last week than was the case when the same child was asked this a year ago. In comparison schools, 1 in 10 more read to the child. Literacy Boost generated more reading action to support students’ learning, and this practice of reading to children is one of the behaviors promoted by Literacy Boost’s community reading awareness sessions. This may explain the marked increase in this particular indicator among Literacy Boost schools.
Impact on Student Learning Outcomes
At baseline, Literacy Boost schools were outperformed by comparison schools in the six reading skills in Figure 2, making the goal of Literacy Boost to close the gap between treatment and comparison schools. The team further set the 75th percentile of each score’s range (95th percentile in the case of Pashto fluency and accuracy, as well as Urdu comprehension, where baseline scores were at or near zero) as the desired improvement for Literacy Boost students. The results from the endline demonstrate that on average children from the Literacy Boost schools (white columns) consistently surpassed these goals (red lines). Further, they achieved significantly higher average scores in all learning outcomes than their comparison peers as well as demonstrating significantly higher gains (end of year score – beginning of year score) over the academic year.
Figure 2: Endline Reading Skills Scores by School Type with Benchmark 13 40 31 67 43 86 11 34 10 24 37 72 0 10 20 30 40 50 60 70 80 90 Concepts about Print Letter Identificatin Pashto fluency Pashto accuracy
Urdu fluency Urdu accuracy
avg
. sco
re
Literacy Boost Comparison
^ Due to the newness of Pashto reading, the 75th percentile is 0 at baseline, so the 95th percentile is used.
Figure 2 demonstrates that at endline, students in Literacy Boost schools on average
outperformed comparison school students and surpassed the benchmark (demonstrated by the red line). The greatest progress was made in fluency and accuracy in both languages. At
baseline, scores on these skills were dominated by zeros, and Figure 3 shows the progress that children in each type of school made in demonstrating some reading of connected text.
The red arrows highlight the progress Literacy Boost made by supporting children’s reading in their mother tongue as well as the language of instruction (LOI). Not only did the more than 90 percent who read Pashto with no fluency or accuracy decrease to 13 percent, but the more than 70 percent who did not read Urdu with any fluency or accuracy decreased to 7 percent. Students in comparison schools made progress as well, but by year’s end, there remained a greater percentage of nonreaders in these schools. We now review results for each skill as well as for oral/reading comprehension.
Concepts about Print
Concepts about Print (CAP) measures children’s emergent literacy skills by asking children to assist in getting ready to read a book. Both Literacy Boost and comparison school students on average were able to identify more concepts about print at endline, especially more advanced concepts such as the direction in which to read and turning to specific sections or page numbers. Comparison students at baseline significantly
outperformed Literacy Boost students on average, and by the end of the year, they met the 75th percentile (11 concepts about print mastered, noted in Figure 4 by
Figure 3. Percentage of Students Scoring Zero on Reading Skills by School Type 90% 90% 72% 72% 13% 13% 7% 7% 88% 88% 48% 48% 59% 61% 13% 13% 0% 10% 20% 30% 40% 50% 60% 70% 80% 90% 100%
Pashto Fluency Pashto Accuracy Urdu Fluency Urdu Accuracy
Literacy Boost zeros baseline Literacy Boost zeros endline Comparison zeros baseline Comparison zeros endline
Figure 4: Average CAP Score
6.9 12.5 5.7 9.4 11.0 1.7 0 2 4 6 8 10 12 14
Baseline Final Gain
A vg . C A P s co re
the red line). Literacy Boost students exceeded this goal scoring significantly higher than their peers with a significantly larger gain of 5.7 points compared to the 1.5 point gain by comparison students (p=.000).
As Literacy Boost school student scores at baseline were significantly below comparison school scores, we conclude that Literacy Boost promoted higher end of year average concepts about print scores and supported greater concepts about print learning during the school year.
Letter Knowledge
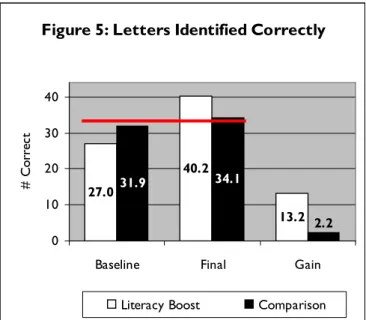
Figure 5 shows that at baseline, Literacy Boost students identified an average of 27 letters correctly (of 44), significantly less than the comparison group average of 32 letters. At endline Literacy Boost students identified 40 letters on average compared to the comparison’s 34, demonstrating a significantly higher gain score (13.2 verses 2.2) (p=0.00).
As Literacy Boost school student scores at baseline were significantly below comparison school scores, we conclude that Literacy Boost promoted higher end of year average letter knowledge scores and supported greater letter knowledge learning during the school year.
At baseline, each letter was known by 70 percent or more of the children. However, fewer than 5 percent of children knew nine key letters (numbers : 7, 12, 20, 21, 24, 27, 32, 41, and 42). Literacy Boost students on average made large progress on most of these least identified letters, with over 80 percent identification at endline, four (13, 21, 24, and 41) remain a challenge and require further attention.
Alphabet learning materials developed locally
Figure 5: Letters Identified Correctly
27.0 40.2 13.2 31.9 34.1 2.2 0 10 20 30 40
Baseline Final Gain
#
C
orre
ct
Pashto Fluency
Reading fluency is indicated by the number of words in a connected text that a child can read correctly in a minute. At both baseline and endline, reading fluency was assessed in two languages—Urdu and Pashto. Pashto is the dominant home language of students in both Literacy Boost and comparison schools. While most children speak Pashto, few if any are able to read in their mother tongue at baseline as available materials are written in Urdu, the language of instruction (LOI).
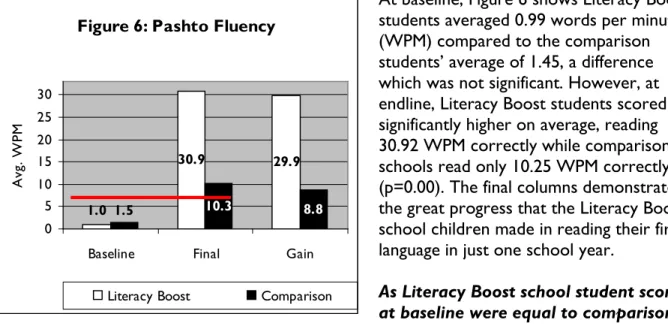
At baseline, Figure 6 shows Literacy Boost students averaged 0.99 words per minute (WPM) compared to the comparison students’ average of 1.45, a difference which was not significant. However, at endline, Literacy Boost students scored significantly higher on average, reading 30.92 WPM correctly while comparison schools read only 10.25 WPM correctly (p=0.00). The final columns demonstrate the great progress that the Literacy Boost school children made in reading their first language in just one school year.
As Literacy Boost school student scores at baseline were equal to comparison school scores, we conclude that Literacy Boost promoted higher end of year Pashto fluency and supported greater Pashto fluency learning during the school year. In addition, as noted in Figure 3 above, the
number of students qualifying as non-readers (reading 0 words correctly in a minute) at endline is much lower in Literacy Boost schools than in comparison schools. At the start of the school year, 90 percent of Literacy Boost students were Pashto non-readers as were 87 percent of comparison school students. It is not surprising that such a high percentage of students in both groups qualify as non-readers at baseline, as Pashto is not the LOI, and Pashto learning materials were not common. By endline, Literacy Boost Pashto non-readers fell to 13 percent, significantly
below comparison schools with 56 percent non-readers. This large gain in Pashto fluency for Literacy Boost students may be attributed to the program emphasis on reading materials and reading instruction in the mother tongue. Literacy Boost students were exposed to more instruction, practice, and materials in Pashto than their comparison peers.
Save the Children staff member works with kids at a Reading Camp Figure 6: Pashto Fluency
1.0 30.9 29.9 8.8 10.3 1.5 0 5 10 15 20 25 30
Baseline Final Gain
A
vg.
WP
M
Young girls focus on reading and writing during free time in class Overall, 47 children, a quarter of the sample, could not read any words of Pashto at the end of the school year, and of these 51 percent are girls. Within the two groups, 10 of 16 Literacy Boost nonreaders are girls, and 14 of 33 comparison school nonreaders are girls. Literacy Boost needs to better support these students to develop these basic skills in their mother tongue.
Pashto Accuracy
Accuracy is the percentage of the reading passage words read correctly, regardless of time. Reading accuracy is based upon the reading of the same text as fluency above, but the child continues after the first minute and the percentage of words read correctly is computed. Literacy Boost school children were only able to read 2.9 percent of the passage words correctly at baseline, significantly fewer compared to the 6.8 percent read correctly by
comparison children. Similar to the gain in Pashto fluency, Literacy Boost children demonstrate great improvement in accuracy. By December, they read 60.7 percent of the passage words correctly, significantly more and in fact more than twice the percent read correctly by comparison children at 21.8 percent (p=0.000).
As Literacy Boost school student scores at baseline were significantly below comparison school scores, we conclude that Literacy Boost promoted higher end of year Pashto accuracy and supported greater Pashto accuracy learning during the school year.
Pashto Reading Comprehension
Comprehension is evaluated using a series of four questions at the end of the reading passage. At baseline, 17 of the 190 children assessed at both points in time answered these questions after reading the Pashto passage themselves. Ten of these 17 were Literacy Boost students who answered 1.9 questions correctly on average, significantly lower than the seven comparison students who answered 2.86 questions correctly on average.
Figure 7 shows how this small sample grew during the course of the year. Literacy Boost reversed the ratio of students read to because they could not read
themselves: at baseline, nine in ten Literacy Boost and comparison students were read to and at endline one in ten Literacy Boost students were read to. Literacy Boost students averaged 2.79 answers correct, significantly higher than comparison school students who averaged 2.21 answers correct (p=0.013).
Literacy Boost supported students to become fluent and accurate enough Pashto readers to answer reading comprehension questions after reading the text themselves. It also promoted higher end of year Pashto comprehension.
Pashto Oral Comprehension
The large number of students in the Pashto nonreader category at baseline made Pashto oral comprehension, the ability to answer questions after the Pashto text is read to the child, a greater focus. At baseline, Literacy Boost students answered 1.21 questions correctly on average; significantly fewer than comparison students who scored 1.69 correct on average (p=.029). More than a third of Literacy Boost students answered zero questions correctly in their mother tongue, while among comparison school students a third answered three or four questions correctly, leading to the conclusion that Literacy Boost oral language development activities would be important for developing children’s vocabulary, confidence of expression and background knowledge so they could demonstrate these skills at the end of the school year. At endline, only 44 children were read the Pashto text by the assessor and have oral
comprehension scores. Thirteen of these students were from Literacy Boost schools and averaged 2.15 percent answers correct; while 31 were from comparison schools and answered 2.52 percent of questions correctly, a higher end score than that among Literacy Boost
nonreaders that is not significant. However, neither group reached the benchmark set of three of four questions answered correctly. Among the small group of Literacy Boost nonreaders at both points in time, there was an increase in the average percentage of oral comprehension questions answered correctly from 1.67 to 2.4 (and from 1.69 to 2.48 in comparison schools). However more programmatic effort should be applied in Year 2 to improve these struggling readers’ Pashto oral comprehension skills— or better yet, bring them out of the nonreader category entirely.
Figure 7. Percent of Students in each School Type Answering Pashto Comprehension Questions
after Reading Text to Self
7% 90% 13% 44% 0% 20% 40% 60% 80% 100% baseline endline
Urdu Fluency
Similar to the approach used for Pashto fluency, accuracy and comprehension, these skill scores result from the reading of an Urdu passage and answering questions. At baseline, Figure 8 shows that the comparison group on average outperformed Literacy Boost students. They read
significantly faster at 14.02 WPM correct compared to Literacy Boost’s average of 5.99 WPM correct (p=.002). Baseline Urdu fluency ranged between 0 and 70 words, with just under half of the comparison students and over 75 percent of Literacy Boost
students reading zero words correctly in a minute. Urdu is the dominant language of instruction within these schools, and it was clear that Literacy Boost had a great challenge ahead to address low reading fluency in Urdu. By endline, Literacy Boost
schools’ children read significantly faster at an average of 47.26 WPM correct compared to the comparison school average of 37.25 WPM correct, (p=.001). This average surpasses the Urdu fluency 75th percentile of 14 WPM (shown in Figure 8 by the red line) established at baseline as the Year 1 literacy aim. As Literacy Boost school student scores at baseline were significantly below comparison school scores, we conclude that Literacy Boost promoted higher end of year Urdu fluency and supported greater Urdu fluency learning during the school year. Recall from Figure 3 that at baseline,
73 percent of Literacy Boost qualified as Urdu non-readers (reading 0 WPM of the passage) while significantly fewer, only 49 percent of comparison students were non-readers. Yet by close of year, the percentage of non-readers in Literacy Boost schools was significantly lower than comparison schools, 7 percent versus 13
percent. Literacy Boost nonreaders decreased by 67 percentage points; while comparison school
Figure 8: Urdu Fluency
6.0 47.3 42.5 14.0 37.3 23.2 0 10 20 30 40 50
Baseline Final Gain
A
vg.
WP
M
Urdu Accuracy
At baseline, students in comparison schools once again significantly outperformed Literacy Boost school students in reading accuracy. On average, they read 37.24 percent of words correctly while Literacy Boost students averaged 17.15 percent (p=.001). The baseline report noted that because 75 percent of the Literacy Boost students could not read any words in the text, even small steps forward in decoding would assist to bring more children out of the “nonreader” category.
By the end of the year, Literacy Boost students significantly outperformed their peers, reading 77.89 percent of words correctly on average compared to 65.82 percent in comparison schools (p=.002).
Because the Literacy Boost students began with average scores significantly below comparison schools in Urdu accuracy, we conclude that Literacy Boost promoted higher end of year Urdu accuracy scores on average and supported greater Urdu accuracy learning during the school year.
Urdu Reading Comprehension
None of the sampled children spoke only Urdu at home, so exposure to the language as well as their comprehension performance mostly reflects their time in school. Figure 9 shows how the
group of children answering the questions after reading the text themselves grew in each school type. Students in the Literacy Boost schools overwhelmingly moved into reading Urdu and now face the greater challenge of demonstrating comprehension. At baseline, the average
comprehension in both groups was below one question answered correctly,
demonstrating the enormous issue of low Urdu reading comprehension. At endline, Literacy Boost school students answered 2.16 questions correctly on average, significantly higher than comparison school students whose average was 0.96 questions correct (p=.000). Literacy Boost children’s performance also surpassed the benchmark of 1 answer correct on average established at baseline, while comparison schools fell just shy of this benchmark.
Figure 9. Percent of Students in each School Type Answering Urdu Comprehension Questions after
Reading Text to Self
25% 94% 51% 87% 0% 20% 40% 60% 80% 100% baseline endline
Literacy Boost supported students to become fluent and accurate enough Urdu readers to answer reading comprehension questions after reading the text themselves. It also promoted higher end of year Urdu comprehension.
Urdu Oral Comprehension
When assessors had to read the Urdu text to the child who was struggling, on average oral comprehension of Urdu was very low and children did not answer a question correctly at baseline. These findings suggested that a major task for Literacy Boost during the 2010 school year was to support children to read, interact and comprehend in the language of instruction. At endline, only 7 Literacy Boost and 7 comparison students needed to be read the text by the assessors. Among all 14 children assessed for oral comprehension, there was one Literacy Boost and one comparison school student who answered a single question correctly; the rest scored zero. This completes the picture of what a great struggle both reading and oral
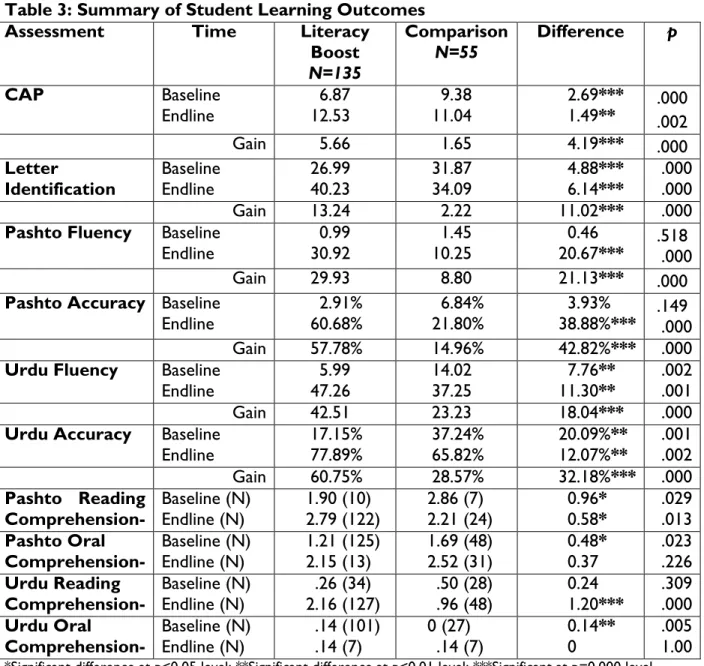
Across key reading skills, Literacy Boost schools were able to demonstrate improved scores after a year of implementation. In many cases, these gains were significantly higher than the gains posted by the comparison group schools. Table 3 summarizes these findings before we move to an analysis of impact for boys and girls.
Table 3: Summary of Student Learning Outcomes
Assessment Time Literacy
Boost N=135 Comparison N=55 Difference p CAP Baseline Endline 12.53 6.87 11.04 9.38 2.691.49***** .000 .002 Gain 5.66 1.65 4.19*** .000 Letter
Identification Baseline Endline 26.99 40.23 31.87 34.09 4.886.14****** .000 .000
Gain 13.24 2.22 11.02*** .000
Pashto Fluency Baseline
Endline 30.92 0.99 10.25 1.45 20.670.46 *** .518 .000
Gain 29.93 8.80 21.13*** .000
Pashto Accuracy Baseline
Endline 60.68% 2.91% 21.80% 6.84% 38.88%3.93% *** .149 .000
Gain 57.78% 14.96% 42.82%*** .000
Urdu Fluency Baseline
Endline 47.26 5.99 14.02 37.25 11.307.76**** .002 .001
Gain 42.51 23.23 18.04*** .000
Urdu Accuracy Baseline
Endline 17.15% 77.89% 37.24% 65.82% 20.09%12.07%**** .001 .002
Gain 60.75% 28.57% 32.18%*** .000
Pashto Reading
Comprehension- Baseline (N) Endline (N) 1.90 (10) 2.79 (122) 2.86 (7) 2.21 (24) 0.960.58** .029 .013 Pashto Oral
Comprehension- Baseline (N) Endline (N) 1.21 (125) 2.15 (13) 1.69 (48) 2.52 (31) 0.480.37 * .023 .226 Urdu Reading
Comprehension- Baseline (N) Endline (N) 2.16 (127) .26 (34) .50 (28) .96 (48) 0.241.20*** .309 .000 Urdu Oral
Comprehension- Baseline (N) Endline (N) .14 (101) .14 (7) 0 (27) .14 (7) 0.140 ** .005 1.00
Impact on Boys and Girls
Girls in Pakistan face the greatest challenges to their education. In this section, we consider whether Literacy Boost benefitted girls and boys equally well, and whether girls in Literacy Boost schools fared better during the 2010 school year than their comparison school counterparts.
Literacy Boost Girls versus Boys
Among the Literacy Boost students assessed, 52 (39 percent) are girls. Both girls and boys have been in school the same number of years, but significantly more girls repeated grade 1 than boys (27% versus 13%, p=0.000). Literacy Boost girls are also slightly older, yet boys have significantly more livestock and variety of animals than their female peers, indicating higher SES. More girls in Literacy Boost schools had chores before school than boys: 30 percent compared to 11 (p=.005), meaning less time and energy available for studying, which could contribute to lower academic performance.
Table 4 offers a picture of how girls’ participation in Literacy Boost compares to that of boys. Girls in Literacy Boost schools had less frequent attendance in Reading Buddy activities and significantly less frequent attendance in Reading Camp activities. Girls also posted lower average gains in concepts about print, letter knowledge, and Pashto fluency and accuracy, but had a higher average gain than boys in Urdu fluency and accuracy. These differences are not significant, but it would be useful to look into possible factors for these gain differences between Literacy Boost boys and girls.
Table 4: Participation and Reading Skills Average Gains by Gender
Girls (N=52) Boys (N=83)
Frequency of Reading Buddy attendance 7.26 7.76
Frequency of Reading Camp attendance 5.8 7.38*
CAP Gain 5.17 5.96
Letter Knowledge Gain 11.92 14.07
Pashto Fluency (WPM) Gain 28.19 31.02
Pashto Accuracy Gain 54% 60%
Urdu Fluency (WPM) Gain 44.38 41.88
Urdu Accuracy Gain 65% 58%
Pashto Comprehension Posttest Score 2.75 2.71
Urdu Comprehension Posttest Score 2.23 1.84
Significant difference of p=*<.05, **<.01, ***<.001, ****.000
Note that at the end of the school year, girls also demonstrate greater average comprehension than boys in both languages, but not significantly so. The higher Urdu reading comprehension score is particularly impressive given that more girls (73 percent) than boys (30 percent) made the switch from “Urdu non-reader” to “Urdu reader,” progress that will benefit school
Literacy Boost Girls versus Comparison Girls
Literacy Boost girls at baseline demonstrated more limited reading skills than comparison girls in concepts about print, letter knowledge, and accuracy and fluency in both Urdu and Pashto. Yet at endline, girls in Literacy Boost schools showed significantly higher learning outcomes than girls in comparison schools in concepts about print, letter knowledge, Pashto fluency, accuracy (as shown in Figure 10), as well as Pashto and Urdu comprehension.
At the end of the year, only 19 percent of Literacy Boost girls could not read any words per minute in Pashto, in contrast to the nearly 70 percent of comparison school girls who were unable to read a word in Pashto. This is to be expected, given that it was only in Literacy Boost schools that Pashto reading had been a focus of intervention.
Both female groups had access to Urdu texts and reading materials throughout the year as part of the PRDA program. At baseline, Literacy Boost girls read significantly slower in Urdu at an average of 4 WPM correct compared to girls in comparison schools who read 12 WPM. They
also read with 11 percent accuracy, significantly less than the 29 percent accuracy among girls in comparison schools. Figure 11 shows that by endline, Literacy Boost girls read 48 WPM with 76 percent accuracy, while the
Figure 10: Girls' Reading Skill Gains by School Type
5 12 28 54 44 66 1 2 4 7 32 41 0 10 20 30 40 50 60 70
CAP Letters Pashto fluency Pashto Accuracy (%)
Urdu fluency Urdu Accuracy (%) Average
Literacy Boost Comparison
Figure 11. Girls’ Urdu Fluency and Accuracy by School Type
4 49 44 11 76 66 12 10 32 29 70 41 0 20 40 60 80
Baseline Endline Gain Baseline Endline Gain Urdu Fluency Urdu Accuracy (% points)
A
ve
ra
ge
comparison school girls read 40 WPM with 70 percent accuracy.
The girls in Literacy Boost schools gained 44 WPM and 66 percentage points in accuracy, making significantly greater progress during the 2010 school year than girls in comparison schools.
Literacy Boost girls on average also surpassed the 75th percentile benchmarks for these assessments as seen in Figure 11. Further, Urdu non-readers decreased by 73 percent among Literacy Boost girls, significantly more than comparison girls’ 55 percent decrease (p=.021). This suggests that Literacy Boost led to important learning benefits for girls, who often confront more difficult hurdles in their access to quality education in Pakistan.
Because the Literacy Boost girls began significantly below comparison school girls in Urdu fluency and accuracy, we conclude that Literacy Boost promoted higher end of year Urdu reading scores on average and supported greater Urdu learning during the school year.
Impact on Student Reading Habits
At endline, questions were added to the student background questionnaire to gauge children’s reading habits and practices. Because both groups had access to PRDA-provided Urdu
storybooks through the libraries-in-a-box, all children were asked if they had borrowed books to take home; they were also asked to name and summarize a favorite book or story. Only Literacy Boost students were asked about Reading Buddies and Reading Camps, since these were activities that only they had access to.
Table 5 shows large differences between children in Literacy Boost versus comparison schools. Significantly more Literacy Boost students than comparison school students could name their favorite book or story. Significantly more Literacy Boost students summarized for the assessor what the story was about. Children reported that they came to know their favorite book or story by: reading it themselves (50%), through Reading Camps (43%), with a Reading Buddy (11%) or having it read to them (10%).
Table 5: Student Active Reading Indicators Literacy Boost Comparison
Able to name a favorite book or story 94%**** 67%
Able to give the title of their favorite story 89%**** 51%
Able to summarize their favorite story 80%**** 42%
Borrowed books to take home 85% 87%
How often do you borrow books in a month? 2.8* 2.2
Do you have a Reading Buddy? (yes) 98% n/a
If yes, how often do you do Reading Buddy activities in a
month? 7.4 n/a
Did you participate in Reading camp? (yes) 96% n/a
How often do you attend Reading Camp in a month? 6.6 n/a
Literacy Boost children had access to both school library boxes and Community Book Banks. While they report a lower percentage of them report borrowing books to take home than comparison school students, those who did borrow books did so significantly more frequently than their peers (p=.046). We conclude that Literacy Boost enhanced children’s exposure to and experience with reading.
Ninety-eight percent of children in Literacy Boost schools reported that they had a Reading Buddy, and that they met with this partner for reading activities more than seven times a month on average. Literacy Boost students on average participated nearly seven times a month in the camps, and as many as 12 times per month, where adult community
volunteers led reading activities and games.
Literacy Boost girls demonstrated better reading habits than comparison school girls. They reported borrowing a book three times a month while comparison school girls did so only twice a month. Boys in both school types borrowed between two and three times with no difference between the two
groups. More than 92 percent of Literacy Boost girls and boys could name their favorite story or book, and more than 80 percent could give a summary; while just over half of comparison school girls and boys could name a favorite story but fewer than half could give a summary.
Relationships between Student Background, Household Literacy and Reading Skills At baseline, a multi-level model was used to account for the clustering of children in schools and found that significant predictors of key reading skills (i.e., concepts about print mastered and letter knowledge) were the number of book types in the home and the percentage of household members who read to the student in the last week. We consider these relationships at the end of one year of the Literacy Boost intervention to evaluate whether the same or different factors influenced learning during the 2010 school year. Further, while at baseline there was insufficient variation in reading fluency, accuracy and comprehension to consider influential factors, at endline we can do so now with an eye to understanding Literacy Boost’s contribution to learning.
Learning Letters
Our model at baseline found that book types and household members reading to the student predict letter knowledge, controlling for SES. At endline, this remains true for the comparison group. However, among Literacy Boost students, we find that age, sex and frequency of reading camp participation predict letter knowledge.
Figure 12 shows that among 8 year olds in Literacy Boost schools (girls in bright blue at bottom, boys in red across the middle), two sessions of reading camp attendance is associated with a gain of 2.68 letters, while for 10 year olds
(purple and pink) it is a gain of just 1.43 letters and among 11 year olds (yellow and green) nearly no gain. Girls (lines with pink dots) are predicted to learn 4.25 letters fewer than boys on average. This model holds controlling for book types, SES, and household members reading to the student and explains 14.59 percent of the variation in letter gain scores. Frequency of Literacy Boost reading camp attendance is associated with relatively greater letter knowledge learning for younger learners and has overshadowed the household and its variety of readers and books as an important predictor of progress on this skill. A quarter of the Literacy Boost sample reported attending Reading Camps four or fewer times a month (most are female), so attention to enhancing their participation may better support their skills development.
Figure 12: Letter Knowledge Gain by Reading Camp Frequency, Age and Sex
0 2 4 6 8 10 12 14 4 6 8
Reading Camp Attendace per Month
le tt er s g ai ne d boys aged 8 boys aged 9 boys aged 10 girls aged 8 girls aged 9 girls aged 10
Learning to read Pashto Fluently
Looking at factors influencing Pashto fluency progress, we again fit a model using only Literacy Boost student data in an attempt to understand relationships bewteen the program’s promoted access to Pashto texts and practice and gains in Pashto skills.
The distance between the bright and navy blue lines in Figure 13 show that among Literacy Boost students, predicted gain in Pashto fluency is 6.38 words greater if they borrow books four times a month than if they do so twice.
Further, the figure shows that children with no appliances at home are estimated to gain 1.83 words per minute for each reading camp activity attended per month, while those with one appliance at home gain an estimated one word and those with two appliances a third of a word on average. In fact, those with no appliances have higher estimated gains relative to peers if they attend 5 or more reading camp activities per month, a difference that gets larger the more camp activities they attended. This suggests that exposure to frequent reading activities benefits most the learning of children challenged by poverty or lower socio-economic status.
This model also has a main effect of doing homework or other tasks to prepare for class before going to school; those children who report doing so have a predicted Pashto fluency gain of 10.9 words higher than those who did not. Children were asked if they did work before going to school, and then elaborate on what that work was. Several children said that the work they did before going to school was related to class preparation. While the interview question was intended to determine if morning chores were having a negative impact on learning,
differentiating between morning schoolwork and morning chores helped us see the impact of this additional practice at home. The model holds when controlling for sex, labor and other background factors, and explains 24.42 percent of the variation in Pashto fluency gains.
Figure 13: Pashto Fluency Gain by Book Borrowing Frequency, Socioeconomic Status and Frequency of
Reading Camp Attendance
18 20 22 24 26 28 30 32 34 36 38 2 4 6 8
Reading Camp Activities per Month
w or ds pe r m inut e g ai ne d 0 appliances, borrows twice a month 1 appliance, borrows twice a month 2 appliances, borrows twice a month
0 appliances, four times/ month
Learning to read Pashto with Accuracy
Literacy Boost students had very different exposure to Pashto print during the school year. As a result, this model too is fit using only data for Literacy Boost students.Predicted gain in Pashto Accuracy is greater for each time per month a student borrows a book for those who have fewer than 4 book types in their homes (78 percent of Literacy Boost students). Figure 14 shows that this effect is greatest among those who have the fewest books (blue at bottom).
Figure 14. Gain in Pashto Reading Accuracy by Book Types and Borrowing Frequency
40 45 50 55 60 65 70 75 1 2 3 4
times per month borrowed books
pe rc ent ag e po int g ai n 1 book type 2 book types 3 book types 4 book types
For every time a child with 1 book type at home borrows a book each month, the predicted accuracy gain is 5.11 percentage points, while for those with four book types at home the estimate is only .06 percentage points. While not causal, this finding suggests Literacy Boost book banks are having the greatest benefit among those children whose exposure to print is most limited.
As with Pashto fluency, this model also has a main effect of doing homework before going to school. Those who report doing so have a predicted Pashto accuracy gain 14.33 percentage points higher than those who did not, again supporting the notion that practice at home is important for Pashto reading skills development. This model holds controlling for SES and other background factors and explains 15.38 percent of the variation in Pashto accuracy gain.
Learning to read Urdu Fluently
We first consider factors influencing Urdu fluency progress in the entire sample and find an esimated 2.99 word per minute gain for every instance of book borrowing the children engaged in per month. This model held when controlling for sex, SES and other background factors and explained 8.45 percent of the variation in Urdu fluency scores.
Among the Literacy Boost students, frequency of reading camp participation as well as
frequency of borrowing books predict Urdu fluency learning and vary by age. Figure 15 shows that 8 year old Literacy Boost students’ predicted Urdu fluency gains are 2.26 words per minute greater for every additional attendance at camp session, while they are 1.18 among 9 year olds and 0 for 10 year olds.
Figure 15: Urdu Fluency Gains by Age, Borrowing and Frequency of Reading Camp Attendance
25 30 35 40 45 50
8 years 9 years 10 years
w or ds pe r m inut e g ai ne d
camp 4 times, borrow twice camp 6 times, borrow twice camp 6 times, borrow 4 times camp 8 times, borrow twice
Across all age groups, the doubling of borrowing frequency from twice to four times per month (the jump in each group of columns from the red to the yellow column) is associated with a predicted gain of 5.72 words per minute. This model holds while controlling for sex, SES, and other background factors and explains 12.31 percent of the variation in Urdu fluency scores. The differences in effects by age could be interpreted to signal that the younger children are gaining Urdu fluency through practice at reading camp sessions. The more they attend, the more they have guidance and are motivated to practice, the better they become. While older students may prefer to practice outside of camps using borowed books – or they may have reached a threshold at which they can read independently to enhance their fluency. This should be investigated to consider whether as the readers in Allai develop the program requires additional materials and/or means through which to promote reading for children of all ages.
Learning to comprehend Urdu text
Finally, we consider influences upon learning to comprehend Urdu during the 2010 school year and find that the trend is similar to that for Urdu fluency above, with an addition of a gender difference. Figure 16 shows that increasing camp attendance and book borrowing frequencies among 9 olds is associated with a predicted comprehension gain of 0.37 questions answered correctly per two monthly sessions (blue column to yellow column or yellow to orange) and 0.31 questions per two additional instances of borrowing (blue column to red or yellow to green).
The difference in estimated girls and boys gain scores among 9 year olds is 0.27 questions as can be seen in the difference between the first two blue columns. Among 10 year olds, this difference is smaller -- 0.15 questions. The gender difference is smaller at this age, as is the estimated gain associated with more 2 more camp sessions (blue to yellow). The estimated gain associated with two more instances of borrowing books (blue to red or yellow to green) remains 0.31 questions.
This model, like those before it, holds when controlling for SES, sex and other background characteristics and it explains 16.62 percent of the variation in Urdu comprehension scores.
Figure 16: Urdu Comprehension Gains by Age, Borrowing and Frequency of Reading Camp Attendance
0 0.5 1 1.5 2 2.5
8 years 9 years 10 years
ga in in q ue st io ns a ns we red c or rec tly
camp 4 times, borrow twice camp 4 times, borrow 4 times camp 6 times, borrow twice camp 6 times, borrow 4 times camp 8 times, borrow twice