lication in the following source:
Jiang, Rui
,
Chung, Edward
, &
Lee, Jinwoo (Brian)
(2012) Local on-ramp
queue management strategy with mainline speed recovery. In
Procedia
-Social and Behavioral Sciences
, ELSEVIER, Changsha, China, pp.
201-209.
This file was downloaded from:
http://eprints.qut.edu.au/61002/
c
Copyright 2012 Elsevier
Notice:
Changes introduced as a result of publishing processes such as
copy-editing and formatting may not be reflected in this document. For a
definitive version of this work, please refer to the published source:
Procedia
Social and
Behavioral
Sciences
Procedia - Social and Behavioral Sciences 00 (2012) 000–000www.elsevier.com/locate/procedia
The 8th International Conference on Traffic & Transportation Studies, 2012
Local On-ramp Queue Management Strategy with Mainline
Speed Recovery
Rui Jiang
*, Edward Chung, Jinwoo (Brian) Lee
Smart Transport Research Centre, Science and Engineering Faulty, Queensland University of Technology
Abstract
Ramp metering is an effective motorway control tool beneficial for mainline traffic, but the long on-ramp queues created interfere with surface traffic profoundly. This study deals with the conflict between mainline benefits and the costs of on-ramp and surface traffic. A novel local on-ramp queue management strategy with mainline speed recovery is proposed. Microscopic simulation is used to test the new strategy and compare it with other strategies. Simulation results reveal that the ramp metering with queue management strategy provides a good balance between the mainline and on-ramp performances.
© 2011 Published by Elsevier Ltd. Selection and/or peer-review under responsibility of [name organizer]
Keywords: Ramp Metering, On-ramp Queue Management, Recovery
1.Introduction
Ramp metering is an access control for motorways in which a traffic signal located on on-ramps regulates the rate of vehicles entering the motorway. Ramp metering is an effective traffic management tool to efficiently exploit the existing motorway capacity, which has been proved to be a cost-effective means of motorway control (Papageorgiou & Kotsialos, 2002). However, the nature of ramp metering and the way in which control algorithms operate, restrict the entry of ramp traffic to the motorway mainline and thus creates queues of vehicles, especially during the peak hours. Long on-ramp queues may cause queue spillover onto the adjacent surface streets and interfere with arterial traffic there. This is perhaps the most undesirable effect of ramp metering operations. Consequently, a proper on-ramp queue management strategy must be incorporated in any field-implemented ramp metering system.
* Rui Jiang. Tel.: +61 7 3138 2103;.
A commonly used on-ramp queue management strategy is the so-called “queue flush or override” method. This method is enabled by placing a detector close to the upstream end of the ramp. If the measured detector occupancy exceeds a threshold, it determines that the queue has reached the detector location and increases the metering rate to the maximum level to clear the traffic queue. Although this simple method can effectively eliminate queue spillover, sudden increases and oscillations in the metering rate adversely affects the mainline traffic and diminishes the main purpose of ramp metering (Chaudhary, Tian, Messer, & Chu, 2004; Gordon, 1996; Tian, Messer, & Balke, 2004).
A recent study (Spiliopoulou, Manolis, Papamichail, & Papageorgiou, 2010) proposed an on-ramp queue controller, which could regulate on-ramp queues smoother with both real-time queue estimation and on-ramp demand prediction one time step ahead. Although the controller is much more sophisticated than simple “queue flush”, the queue controller simply overrides the normal metering control to put on-ramp queue length as a new control objective when activated. Once queue control activated, there is no consideration of mainline traffic conditions when determining metering rate. Accordingly, this arbitrary replacement of control objective could still lead to adverse impacts on mainline traffic and reduces the initial benefits of applying ramp metering.
This paper incorporates a new concept of mainline speed recovery into on-ramp queue management strategy, which aims to balance between the main purpose of ramp metering (avoiding mainline congestion) and the purpose of employing queue management (preventing queue spillover and potential street blockages). This new concept is investigated and compared with other queue management strategies in a microscopic simulation environment (using the commercial microscopic traffic simulator AIMSUN). This study uses a calibrated test-bed, Marquis Street on-ramp in the southbound of the Pacific Motorway, Brisbane. This on-ramp experiences high traffic volumes at both mainline and on-ramp during afternoon peak hours every day, and therefore the local transport authority considers it as a potential location of installing ramp metering system.
The rest of the paper is structured as follows. Section 2 firstly presents ALINEA, the selected local ramp metering algorithm in brief. A general ramp detector requirement for ramp metering operation with queue management and the queue length dynamic equation are then introduced. In Section 3, the local on-ramp queue management strategy is described. The concept of mainline speed recovery is presented in Section 4 with a mechanism of connecting local ramp metering and queue management strategy. Simulation setups and results are stated in the following section. The final section summarises the main conclusions.
2.Problem Formulation
2.1.ALINEA
ALINEA (Papageorgiou, Hadj-Salem, & Blosseville, 1991) is the most successful and widely used local ramp metering algorithm. Consequently, this study selects ALINEA as the basic framework for the local ramp metering. ALINEA is a feedback-based local ramp metering strategy that bases its real-time decisions on measurements of occupancy that are collected from the freeway mainstream, downstream of the on-ramp nose. Compared with other local ramp metering algorithm, ALINEA has two main advantages. Firstly, ALINEA is less sensitive to disturbances (i.e., fluctuated traffic conditions) due to its feedback nature, which makes the algorithm highly robust. Secondly, ALINEA is very simple and computationally efficient. ALINEA determines the metering rate, r, for the k-th interval, r(k), using the following simple formula.
Author name / Procedia - Social and Behavioral Sciences 00 (2012) 000–000 3
Where, is a regulator parameter ( ); is the desired occupancy of the mainline detector; is the mainline occupancy measurement; and is the update cycle of metering rate. The best location for these measurements is where a potential mainstream congestion caused by merging vehicles from the on-ramp is typically appearing first (Spiliopoulou, et al., 2010).
2.2.Ramp Detector Requirement and Queue Dynamics
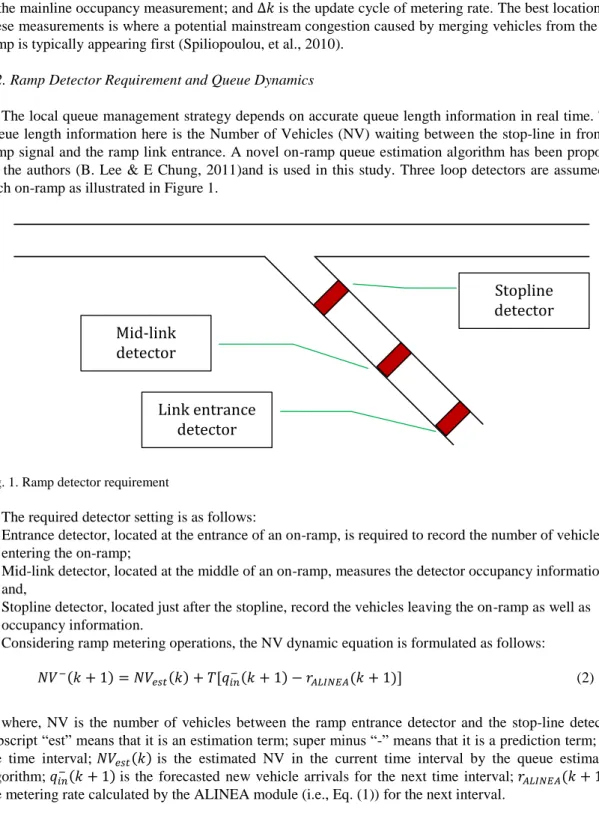
The local queue management strategy depends on accurate queue length information in real time. The queue length information here is the Number of Vehicles (NV) waiting between the stop-line in front of ramp signal and the ramp link entrance. A novel on-ramp queue estimation algorithm has been proposed by the authors (B. Lee & E Chung, 2011)and is used in this study. Three loop detectors are assumed in each on-ramp as illustrated in Figure 1.
Stopline
detector
Mid-link
detector
Link entrance
detector
Fig. 1. Ramp detector requirement
The required detector setting is as follows:
Entrance detector, located at the entrance of an on-ramp, is required to record the number of vehicles entering the on-ramp;
Mid-link detector, located at the middle of an on-ramp, measures the detector occupancy information; and,
Stopline detector, located just after the stopline, record the vehicles leaving the on-ramp as well as occupancy information.
Considering ramp metering operations, the NV dynamic equation is formulated as follows:
(2) where, NV is the number of vehicles between the ramp entrance detector and the stop-line detector; subscript “est” means that it is an estimation term; super minus “-” means that it is a prediction term; k is the time interval; is the estimated NV in the current time interval by the queue estimation algorithm; is the forecasted new vehicle arrivals for the next time interval; is the metering rate calculated by the ALINEA module (i.e., Eq. (1)) for the next interval.
Note that the double exponential smoothing technique is used to forecast new vehicle arrivals. The basic principle of smoothing techniques is a continuous revision of a forecast in the light of more recent experience. Exponential smooth techniques assign exponentially decreasing weights to older observations. In other words, more recent observations are given more weight in forecasting than older observations. More detailed information about the double exponential smoothing technique can be found elsewhere (B. Lee & E. Chung, 2011).
3.Queue Management Strategy
The control objective of queue management is to maintain the on-ramp queue size to an acceptable degree and to prevent queue spillover onto adjacent surface streets. In this section, when to apply queue management and how to modify metering rate are presented.
3.1.Conditions of Activation Queue Management
Obviously, queue management should be operated only when on-ramp queue length is becoming critical. Therefore, a simple rule is required for determination of activating queue management strategy.
The outcomes of Equation (2) are the estimated queue size in the next interval. Activation and deactivation of queue management is determined by comparing those computation results, , with pre-defined thresholds in this study:
For activation of queue management, must be greater than ;
For deactivation of queue management, must be less than . Where is the maximum storage of the on-ramp in terms of the number of vehicles.
3.2.Queue Control
In order to reduce on-ramp queues, the queue management strategy modifies the basic metering rate if queue management is determined to be required. . The metering rate calculated by the metering control module is increased by an increment. The amount of increment is determined by the following equation.
(3) where, is the candidate metering rate increment for the next time interval ; is the metering rate increment applied in the current interval; is the target NV ( ; K is a coefficient converting the number of overflow vehicles [ to a metering rate. The coefficient value is set at 20 in this study.
According to Equation (3), the calculated increments may increase exponentially if the queue size (or
NV) does not reduce under the target NV. In addition, the increment applies to the basic metering rate only when the calculated results are positive. In other words, the queue management module only increases the basic metering rate. This can be expressed in an equation as follows:
(4)
Where, is the metering rate increment that applies to the basic metering rate for the next time interval (k+1).
Author name / Procedia - Social and Behavioral Sciences 00 (2012) 000–000 5
The above scheme can effectively reduce the risk of queue spillover. However, when the onset of queue spillover is imminent, the queue management strategy alternatively amends the queue management scheme to queue flush.
(5)
Where, is the metering rate for the next interval; is the time occupancy measurement from the ramp entrance detector; and, is the maximum metering rate.
4.Mainline Speed Recovery
When applying ramp metering actions, long on-ramp queues are most likely created by restricted metering rate and relatively high arriving traffic flow. Under such conditions, it is appropriate to assume that both mainline and ramp demands are at high levels. Given dense mainline traffic and high ramp demand are at the same time, ramp metering actions and queue management strategies are actually against each other. With high mainline volumes, ramp metering algorithms, like ALINEA, requires limiting ramp traffic entering so that no breakdown happens at merge area; with the creation of long on-ramp queues, queue management strategies needs increased metering rate to release long queues. When on-ramp queue is becoming critical, previous queue management strategies just simply override ramp metering operations. This way of operating queue management may cause immediate flow breakdown and further restrict the access of on-ramp traffic to the mainline as a result. Therefore, it is a question how to balance between ramp metering and queue management.
A concept of mainline speed recovery is introduced with the principle of suspending queue management temporarily when the mainline traffic condition deteriorates. Once evidence of potential breakdown is identified, this new strategy switches the ramp metering control back to the basic metering control module without queue management. By doing this, it is trying to recover mainline traffic condition quickly and keeping the benefits of ramp metering. At the same time, on-ramp queue spillover is considered as the recovery cost, and a pre-defined period is set as the highest affordable recovery cost threshold. Once the total spillover time has reached or exceeded the pre-defined threshold, the suspension of queue management is over written for considering surface traffic. This is because when the spillover threshold is reached, it is of high possibility that mainline free flow traffic cannot be maintained without serious interfering with surface traffic. Usually, this is the peak traffic condition in which both motorways and arterial roads are experiencing huge traffic volumes, and congestions are unavoidable.
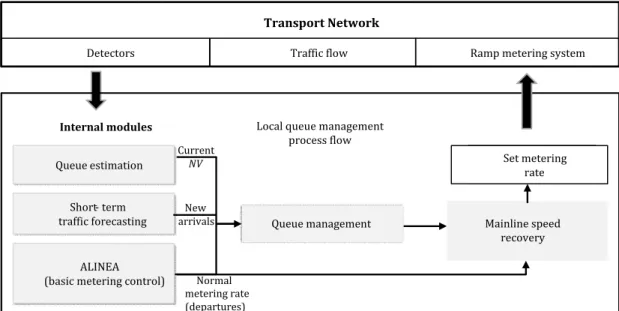
In this study, the queue management suspension becomes effective when the mainline average vehicle speed is less than 45 km/hour. The suspension time setting is 300 seconds. The process flow of local on-ramp queue management strategy with mainline speed recovery is demonstrated in Figure 2.
5.Simulation Tests
The proposed estimation algorithm is tested using a microscopic traffic simulator, AIMSUN. As the microscopic traffic simulator has strong ability in describing vehicle reactions and movements, it is a reasonable tool for mimicking ramp metering and traffic queue dynamics. In this section, simulation setup is introduced first, and then the results are presented.
5.1.Simulation Setup
In this sub-section, the test network is introduced firstly, following with test scenarios, and performance measures are listed.
Current NV New arrivals Normal metering rate (departures) Queue estimation Short- term traffic forecasting ALINEA (basic metering control)
Set normal metering Transport Network
Detectors Traffic flow Ramp metering system
Internal modules
Set metering rate
Queue management Mainline speed recovery Local queue management
process flow
Fig. 2. Local On-ramp Queue Management Strategy Process Flow
Test Network
The test network is Marquis St. on-ramp in the Southbound of the Pacific Motorway (M3) in Brisbane, Queensland. The M3 connects Logan city and the Brisbane CBD, which services a large volume of commuter traffic in both morning and evening peak periods, leading to heavy recurrent congestion. Among the M3, Marquis St. on-ramp witnesses both high mainline and ramp volumes during afternoon peak hours. Additionally, the selected on-ramp is a two-lane on-ramp over 285 meters from ramp metering point to the link entrance, which gives enough storage space for ramp metering and queue management (see Figure 3). Therefore, this on-ramp is considered as a proper location for applying ramp metering with queue management.
A complete scenario to depict the real traffic demand on the network was developed in terms of traffic state according to the PTDS (Public Transport Data Source) database. The selected case day was 15th March 2010, this being a regular business day (Monday) with major educational institutions running, good weather prevailing (no rain) and no incidents reported. The afternoon peak scenario starts from 2:00pm to 7:00pm with time intervals of 15 minutes.
Test Scenarios
In order to comprehensively understand the interaction of ramp metering and queue management and demonstrate benefits of the proposed queue management strategy, four strategies are tested, which are listed as follows:
Author name / Procedia - Social and Behavioral Sciences 00 (2012) 000–000 7 Base case: without ramp metering and serious mainline congestion expected;
Basic ramp metering: the basic ALINEA module only without queue management;
Queue flush (QF): the basic ALINEA module with a simple queue flush type queue management;
Queue management strategy (QM): the basic ALINEA module with local on-ramp queue management with mainline speed recovery.
Fig. 3. Marquis Street On-ramp
Each test strategy was simulated 20 replications and the average calculated in order to eliminate influences of random seeds in micro-simulation.
Performance Measures
4 performance measures used in this study are listed below:
Mainline speed: Mainline speed measures the mainline traffic condition in order to evaluate the metering benefit. The average speed is calculated for whole mainline section.
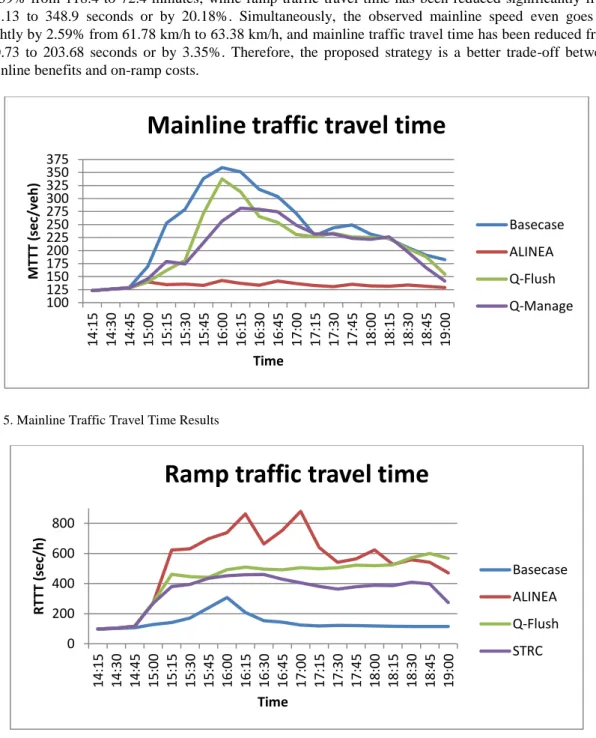
Mainline traffic travel time: This is the travel time for mainline traffic volumes in the network, which starts from mainline entrance and ends at the network exit.
Ramp traffic travel time: Ramp traffic travel time is measured from the entrance of the on-ramp to the end of the network for only the on-ramp traffic.
Queue spillover time: On-ramp queue spillover is the major drawback of ramp metering which impacts arterial traffic. The main objective of queue management is to reduce or even avoid queue spill-back so as to minimize the impact on arterial roads. In this study, the total queue spill-back time is defined as the total time when 1-min time occupancy of the ramp entrance detector is over 70%.
The first measure looks at mainline traffic conditions, while the second one focuses on the impact on mainline volume only. On-ramp performances are examined by the other two measures. Only queue spillover time is measured for the whole simulation period, while others are aggregated every 15 minutes.
5.2.Results and Analysis
Table 1 presents the overall simulation results of the Marquis Street on-ramp, and Figure 4-6 illustrate mainline speed, mainline traffic travel time and ramp traffic travel time for every 15 minutes.
Overall, the ALINEA strategy demonstrated that it can improve the mainline traffic flow but with significant disadvantages to the ramp traffic. Since this strategy determines the metering rate in consideration of the mainline traffic condition only, it naturally increases the ramp travel time. As a result, the mainline traffic speed improves from 56.11 to 87.82 km/h or by 56.51%, and mainline traffic travel time reduces from 238.87 to 133.46 seconds or by 44.12%. However, the ramp traffic travel time increases by 281% from 143.06 to 545.06 seconds per vehicle, and the total queue spillover period also increases significantly from zero to 270.25 minutes. Therefore, ALINEA makes mainline traffic enjoy the benefits, while ramp traffic and surface traffic suffer from long queues.
Table 1 Simulation Results of Marquis Street On-ramp
Performance Measures Ramp Metering Strategies
Base Case ALINEA Q-Flush Q-Manage Mainline speed (km/h) 56.11 87.82 61.78 63.38 Mainline traffic travel time (s) 238.87 133.46 210.73 203.68 Ramp traffic travel time (s) 143.06 545.06 437.13 348.90 Queue spillover time (minute) 0.00 270.25 128.50 73.55
Fig. 4. Mainline Speed Results
The queue flush strategy alleviates the disadvantage of ramp metering to some degree, but the mainline benefit declines as a trade-off. The queue spillover period reduces by 52.45% from 270.25 to 128.5 minutes, but the mainline speed also decreases by 29.65% from 87.82 to 61.78 km/h. This trade-off can also been seen by the increases in mainline traffic travel time (from 133.46 to 210.73 seconds) and the corresponding fall of ramp traffic travel time (from 545.06 to 437.13 seconds).
20 30 40 50 60 70 80 90 100 14: 15 14: 30 14 :45 15: 00 15: 15 15 :30 15: 45 16: 00 16 :15 16: 30 16: 45 17 :00 17: 15 17: 30 17 :45 18: 00 18: 15 18 :30 18: 45 19: 00 M ai n lin e Sp d (k m /h ) Time
Mainline Speed
Basecase ALINEA Q-Flush Q-ManageAuthor name / Procedia - Social and Behavioral Sciences 00 (2012) 000–000 9
The proposed queue management strategy demonstrates a good balance between the mainline and on-ramp performances. The advanced queue management scheme enables much improved queue management over the queue flush strategy, while providing a similar level of mainline speed improvement. The queue spillover period reduces significantly compared with the queue flush strategy: by 39% from 118.4 to 72.4 minutes, while ramp traffic travel time has been reduced significantly from 437.13 to 348.9 seconds or by 20.18%. Simultaneously, the observed mainline speed even goes up slightly by 2.59% from 61.78 km/h to 63.38 km/h, and mainline traffic travel time has been reduced from 210.73 to 203.68 seconds or by 3.35%. Therefore, the proposed strategy is a better trade-off between mainline benefits and on-ramp costs.
Fig. 5. Mainline Traffic Travel Time Results
Fig. 6. Ramp Traffic Travel Time Results
100 125 150 175 200 225 250 275 300 325 350 375 14: 15 14: 30 14: 45 15: 00 15: 15 15: 30 15: 45 16: 00 16: 15 16: 30 16: 45 17: 00 17: 15 17: 30 17 :45 18: 00 18: 15 18: 30 18: 45 19: 00 M TTT (sec /v e h ) Time
Mainline traffic travel time
Basecase ALINEA Q-Flush Q-Manage 0 200 400 600 800 14: 15 14: 30 14: 45 15: 00 15: 15 15: 30 15: 45 16: 00 16: 15 16: 30 16: 45 17: 00 17 :15 17: 30 17: 45 18: 00 18: 15 18 :30 18: 45 19: 00 R TTT (sec /h ) Time
Ramp traffic travel time
Basecase ALINEA Q-Flush STRC
6.Conclusions
This paper presents a local queue management strategy, and a new concept of mainline speed recovery is proposed to balance the conflict between ramp metering and queue management. Microscopic simulation results suggest the smart queue management strategy can achieve a good balance between the mainline and on-ramp performances.
Acknowledgements
The authors would like to acknowledge the award of the Smart Transport Research Centre’s scholarship to Rui JIANG towards this research effort.
References
Chaudhary, N. A., Tian, Z., Messer, C. J., & Chu, C. L. (2004). Ramp metering algorithms and approaches for Texas. Texas: Texas Transportation Institute
Gordon, R. L. (1996). Algorithm for controlling spillback from ramp meters. Transportation Research Record: Journal of the Transportation Research Board, 1554, 162-171.
Lee, B., & Chung, E. (2011). Managed Motorway Project - Local Ramp Metering Final Report. Brisbane: Smart Transport Research Centre, Faculty of Built Environment & Engineering, Queensland University of Technology.
Lee, B., & Chung, E. (2011). Managed Motorways - Variable Speed Limit sub-project Final Report. Brisbane: Smart Transport Research Centre, Faculty of Built Environment & Engineering, Queensland University of Technology.
Papageorgiou, M., Hadj-Salem, H., & Blosseville, J. M. (1991). ALINEA: A local feedback control law for on-ramp metering. Transportation Research Record(1320).
Papageorgiou, M., & Kotsialos, A. (2002). Freeway ramp metering: An overview. IEEE Transactions on Intelligent Transportation Systems, 3(4), 271-281.
Spiliopoulou, A. D., Manolis, D., Papamichail, I., & Papageorgiou, M. (2010). Queue management techniques for metered freeway on-ramps. Transportation Research Record: Journal of the Transportation Research Board, 2178, 40-48.
Tian, Z., Messer, C., & Balke, K. (2004). Modeling impact of ramp metering queues on diamond interchange operations. Transportation Research Record, 1867, 172-182.