The Effect of Driving Simulator Fidelity on
Training Effectiveness
R. Wade Allen*, George D. Park*, Marcia L. Cook*, Dary Fiorentino**
*Systems Technology, Inc.; **Southern California Research Institute
Abstract
The degree of driving simulator fidelity certainly has some effect on its potential training effectiveness. This paper describes post -training accident analysis results for a project that has been previously presented at DSC conferences. Training involved three simulator configurations: 1) an instrumented cab with wide angle projected display; 2) a wide field of view desktop system with a three monitor display; 3) a single monitor, narrow field of view desktop system. Training results have been published previously that show some differences in performance between simulator configurations. Accident results were obtained for the teen drivers trained in this experiment from the Department of Motor Vehicles in the State of California, USA. The accident rate of the simulator trained subjects is compared with published California teen driver accident rates for the general state population and also published data from the Nova Scotia province of Canada. The accident rate of the teen driver subject population trained in the instrumented cab simulator configuration was only one third that of the general teen driver population. The accident rate of teen drivers trained with the desktop wide field of view configuration was 77% of the general teen driver accident rate. The accident rate of the teen drivers trained on the single monitor desk top system was about equal to that of the general population. The paper describes the training regimens and simulator configurations and gives a detailed analysis of the accident data.
Résumé
Le degré de fidèlité du simulateur de conduite aux conditions réelles a un effet incontestable sur son efficacité potentielle pour l’apprentissage. Cet article décrit les résultats de l’analyse du taux d’accidents post-formation pour un projet deja présenté aux conférences de DSC. Cette formation comprenais trois configurations de simulateur : 1) un taxi équipé d’un tableau de bord avec affichage projeté à grand angle; 2) un ordinateur avec champ visuel étendu sur trois moniteurs ; 3) un ordinateur avec un seul moniteur affichant un champ de vision étroit. Des résultats précédemment publiés de cette formation montrent quelques différences de performance entre les configurations différentes du simulateur. Les statistiques d'accidents pour les conducteurs adolescents de cette expérience ont été obtenus auprès du « department of motor vehicles » de l'état amèricain de Californie. Le taux d’accidents de ces sujets est comparé aux taux d'accidents des adolescents Californiens ainsi qu’aux données publiées de la province de la Nouvelle-Écosse du Canada. Le taux d'accidents des adolescents entraînés dans la configuration simulateur/taxi représentait seulement un tiers de celui de la population générale des conducteur adolescents. Le taux d'accidents des conducteurs adolescents entraînés dans la configuration ordinateur/champ visuel étendu représentait 77% du taux d'accidents de la population générale des conducteur adolescents. Le taux d'accidents des conducteurs adolescents qui se sont exercé sur le système du moniteur simple était environ égal à celui de la population générale. L'article décrit le déroulement de formation et les configurations de simulateur et donne une analyse détaillée des données portant sur les accidents.
Introduction
Training teenagers in safe driving practices is a difficult problem and involves issues that vary substantially from more professional training in the military and commercial fields. With older subjects training in a more professional context, there is typically a selection process and a degree of professionalism and motivation for learning not found with the general teenage population. Teenagers are primarily motivated to obtain their license and the freedom to drive, and are not cognizant of the dangers in the driving environment. Accident rates for teenagers tend to be about 8-10% per year (i.e. 8-10 accidents per 100 drivers per year) while for experienced middle aged drivers the rate is on the order 4-5% ( 1). When driving mileage exposure is taken into account the difference is even more dramatic with teen accident rates about 5 times higher than mature drivers (1).
Past research suggests that the teen crash risk effect of inexperience overshadows the effect of immaturity in the first year of driving, while immaturity becomes more important when teen drivers get some experience and build confidence in driving. While teen driving behavior may look like intentional risk taking, in reality it may result from their inability to assess risk ( 2, 3). Young novice drivers take risks because of their immaturity and get into hazardous situations, and then fail to avoid crashes because of their inexperience ( 4, 5). To add to the teen driving safety problem, school districts are cutting back on driver education because of budget problems, and teens are now relying more and more on commercial driving schools, computerized and online courses, and driving with parents ( 6). Home study is available in many states, and based on an exit examination it has been found that using interactive technology to teach driver education results in superior learning ( 6). It has also been suggested that self-directed, self-paced teaching methods may be more effective than conventional classroom instruction for teaching the highest-risk young drivers as conventional classes may bore these students in the early stages of learning to drive ( 7).
In general there seems to be some difficulty in justifying the effectiveness of driver education, although it still has popular appeal ( 8). Driver education may help beginning drivers acquire driving skills, but the standard driver education course does not appear to produce safer drivers ( 9). Graduated driver licensing seems to be controlling exposure such that accident rates are lower due to night time and passenger restrictions, and for extended supervised driving practice. Motor vehicle crashes are significantly higher among young drivers during the first year of licensure, and crash risks decline with increased experience. However, the more newly licensed teenagers drive, the greater their risk exposure. This produces an interesting dilemma about how to provide young drivers with driving experience without significantly increasing their crash risk ( 10). Driving simulation may be the solution to this dilemma, since exposure to hazardous driving conditions can be simulated in a controlled and repetitive way without risk.
Background
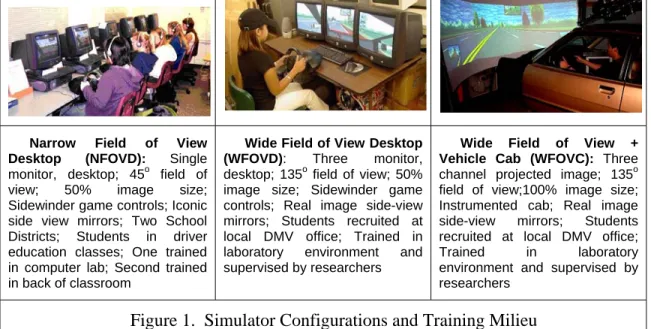
Recent review has continued to reveal the risk encountered by novice drivers ( 11). This review has also acknowledged the application of technology in driver education. Simulation is a potential technology that could advance novice driver skills before they drive in the real world. The research project of interest in this paper was instituted several years ago to investigate whether simulator training can impart knowledge and skills to novice drivers that will transfer to real world driving. The training phase of this project has been reported previously ( 12- 16) and involved simulators with three levels of fidelity. As illustrated in Figure 1 the simulator configurations included 1) a desktop, single monitor or narrow field of view configuration (NFOVD); 2) a desktop three monitor or wide field of view configuration (WFOVD); 3) an instrumented cab with projected wide field of view display (WFOVC). The first phase of this project was reported on in ( 12), and the detailed training results were reported in ( 15). Data on the accident rates of our simulator trained subjects were obtained from the California State Department of Motor Vehicles (DMV). The analysis of this data is reported in this paper and compared with general teen accident rates reported elsewhere ( 1, 17).
Narrow Field of View Desktop (NFOVD): Single monitor, desktop; 45o field of view; 50% image size; Sidewinder game controls; Iconic side view mirrors; Two School Districts; Students in driver education classes; One trained in computer lab; Second trained in back of classroom
Wide Field of View Desktop (WFOVD): Three monitor, desktop; 135o field of view; 50% image size; Sidewinder game controls; Real image side-view mirrors; Students recruited at local DMV office; Trained in laboratory environment and supervised by researchers
Wide Field of View + Vehicle Cab (WFOVC): Three channel projected image; 135o field of view;100% image size; Instrumented cab; Real image side-view mirrors; Students recruited at local DMV office; Trained in laboratory environment and supervised by researchers
Figure 1. Simulator Configurations and Training Milieu
We originally intended to get accident data for control groups in geographical areas consistent with our simulator trained experimental population. However, to date we have not been able to get this data from the California DMV, although we have received accident data for our simulator trained subjects as will be discussed subsequently. In lieu of control data, we have attempted to get equivalent control data via the published literature. Two studies appear to have useful comparative novice driver accident rates, one for the state of California, USA (1) by Janke, et al., and the other for the Canadian province of Nova Scotia (17) by Mayhew, et al. both published in 2003. The basic data, reported as accidents per driver, is illustrated in Figure 2 a). The Canadian data was reported on a monthly basis for the first 24 months after licensure, and the California data is reported on a yearly basis for four years after licensure. Because the California data are reported for a year, they have been plotted at the six month intervals to be
y = 0.0132x-0.2679 R2 = 0.9225
y = -7.96E-07x2 + 5.62E-06x + 7.57E-03 R2 = 9.99E-01 0.0% 0.5% 1.0% 1.5% 0 12 24 36 4
Months from Licensure
Ac ci de nt Ra te per Dr iv e r (%) 8
Janke, et al. 2003 Mayhew, et al., 2003
a) Accident rates per driver
y = 0.00697x + 0.01637 R2 = 0.99349 y = 0.00696x + 0.01035R2 = 0.99895 0 0.1 0.2 0.3 0.4 0 10 20 30 40
Months After Licensure
Cumulat
ive Accident
Rate (%)
50 Janke, et al., 2003 Mayhew, et al., 2003
b) Cumulative accident rates per driver
The Mayhew data in Figure 2 a) show the severity of the novice driver accident rate in the first few months after licensure. According to the exponential regression function shown in Figure 2 a) for the Mayhew data the accident rate in the first month is over twice the rate in the 24th month. The regression function for the Janke, et al. data show an initial accident rate of 0.0075 accidents per driver per month or 0.091 accidents per driver per year which is consistent with (1). The Janke, et al. data also show that the novice driver accident rate in the first year is about two times the accident rate of middle aged drivers. The Figure 2 a) data are actually cumulative for each time period, so another way of looking at this data is to consider the cumulative distributions in Figure 2 b). The cumulative distributions show the rate at which accidents are occurring, and beyond the first six months this accumulation rate is about equal for the two data sets. The regression analysis summarized in Figure 2 b) shows that both data sets have the about the same accumulation rate of accidents at approximately 0.0070 accidents per driver per month, or 0.084 (8.4%) accidents per driver per year. This is consistent with the yearly rates reported by Janke, et al. (1). The data interpretation in Figure 2 b) is a useful format upon which to compare the accident data analysis in this research project.
Past research indicates that driving simulation training that allows for the commission of errors gives better transfer to on road driving tests than training designed not to elicit errors ( 18). There is also other evidence from the literature that training is more effective when subjects learn from the commission of errors ( 19). The key to setting up scenarios to allow for learning from errors in a driving simulation is the ability to control independent variables (time and special relationships) that determine the severity of hazardous situations. Driving scenarios in the training phase of this study were designed to be difficult for untrained drivers and lead to errors, but permit successful execution by trained drivers ( 16). The difficulty of the scenarios was such that drivers made many errors during their first encounters, and learned to minimize errors as training progressed and their skills improved. Students were required to drive a minimum of six scenarios before their performance was graded for meeting graduation criteria. The subjects could drive up to three more scenarios in order to reach a passing score. About 79% of the subjects achieved a passing score by the ninth trial (16).
Training system performance has previously been reported for this study, e.g. (12), and simulator sickness rates have also been published (20). Maneuvering variables such as hard cornering and hard braking were improved with higher simulator fidelity and were best with the wide field of view full size projected display. Errors such as turn indicator misuse and accidents were reduced with increased fidelity. Drivers also tended to drive the simulator more conservatively with increased fidelity. Better fidelity here is considered to include full size displays, wide field of view and realistic side view mirrors as illustrated in Figure 1. Simulator sickness rates were relatively low for all configurations. Given the previously published training performance, the basic questions to be addressed here are 1) whether the simulator training transfers to real world driving and results in reduced accident rates, and 2) whether simulator configuration influences training effectiveness?
Methods
This study obtained simulator training performance results on over 500 novice drivers. The training system platform was designed to permit teaching perceptual, psychomotor and cognitive skills to novice drivers and to be administered by driver education instructors with no prior background in running human subject experiments. The PC platform was designed to provide orientation, subject record keeping, training, performance measurement and evaluation of driver behaviour (12). The simulator component of the platform presented subjects with cognitively complex driving situations. These situations involved hazardous, time critical pedestrian, traffic and signal conflicts contained in nine driving scenarios. The order of the events was counter balanced between scenarios to minimize anticipation of upcoming situations. The scenarios were designed to train critical driving skills, including situation awareness, hazard perception, risk assessment, and decision making under time pressure as discuss elsewhere (14).
Training System
An automated training system was developed that would log in subjects, establish a database, administer orientation material, administer driving simulator scenarios, record driving performance, and compare subject data to criteria that would determine acceptable training performance ( 12). After logging in, subjects were administered orientation material that presented information necessary for driving the simulation, including: traffic control devices (signs, signals and markings), rules of the road, lane changing, turning and use of turn indicators, and hazard recognition, situation awareness and defensive driving. The orientation ended with information on the performance scoring system and use of the driving controls.
Driving Simulation
The driving simulation has been described elsewhere ( 12). The first exposure was a familiarization run which slowly introduced the student to steering and speed control, then intersections with traffic control devices, and finally traffic and pedestrian conflicts. After the familiarization run the training system presented the student with standardized training scenarios. The students were presented six 12-15 minute training scenarios with performance scores displayed at the end of each run. Performance was evaluated at the end of the sixth scenario, and if the students met the performance criteria (e.g. no accidents, no tickets and acceptable average speed) then they were graduated. If not, the application presented up to three additional trials. On any additional trial the students were graduated if they met the performance criteria. If the students drove all of the additional trials and did not meet the performance criteria, they were admonished to drive carefully in the future and acknowledged for their participation. The overall graduation rate was 79% (14).
Driving Scenarios
Driving scenarios were created with a scenario definition language (SDL) that allows the specification and control of critical hazards (21). The SDL allows driving scenarios to be conveniently described in terms of roadway alignment, and include events for traffic control devices (signals, signs, and markings), roadside objects, traffic, and pedestrians. In addition the temporal properties of the traffic, traffic signals, and pedestrians were triggered relative to the subject’s own vehicle in order to control the severity (timing) of hazard conflicts. The SDL also allows situations to be counter balanced between scenarios so that subjects could not learn patterns of up coming events over successive trials. The application was designed to select a different variation every time a given subject was administered an additional run. The characteristics of the driving scenarios, including critical events, have been described previously (14). The SDL also allows specification of performance measures. Performance measures included elements such as lane and speed deviations, speed limit and traffic signal violations, turn signal errors, hard cornering and braking, accidents, run completion time and median time to collision for all vehicle encounters. Some performance measures were also used as graduation criteria (i.e. no accidents, less than three violations, and less than 10 turn signal errors).
The driving scenarios were designed to be about 10-15 minutes in length depending on the driver’s speed. They were about 34,000 feet in length and at a speed of 45 mph could be completed in about 8.5 minutes. There were sections where subjects could go faster, and sections where subjects had to slow or stop for intersections, traffic and pedestrians which extended the driving time to roughly 12-15 minutes. The scenarios involve 155 approaching vehicles and 107 interacting vehicles going the same direction as the subjects. The vehicles were relatively evenly distributed throughout the scenarios. There were also 67 pedestrians distributed throughout the scenarios. The trigger times for pedestrians moving in front of the subject’s vehicle were designed to present challenging decisions to subjects (e.g. typical time to encounter of 3-6 seconds). The signal light trigger timings were designed to give relatively critical stop or go decisions (e.g. typical time to intersection of 3-6 seconds). Curve severity was designed to be challenging as subjects went faster than the general speed limit of 45 mph.
Subject Population and Training Sites
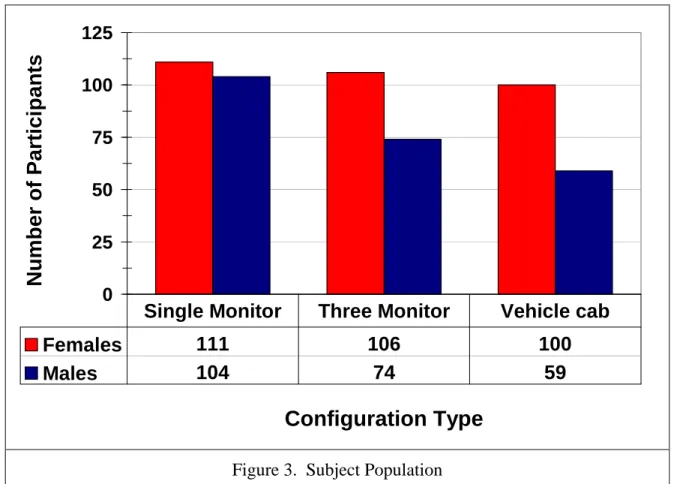
Subjects trained in two research laboratories and two school districts. The research laboratory subjects were recruited from local Department of Motor Vehicle offices, while the high school district subjects were all registered in high school driver education classes. Subjects recruited from the DMV offices were trained in two research laboratories, one with the wide field of view in a vehicle cab configuration, the other with the wide field of view desk top configuration (Figure 1). The subjects in the high school driver education classes were trained on the single monitor (narrow field of view) desk top configuration (Figure 1). The population had a slight bias towards females, and there was some variation in the total number of subjects driving each configuration. Figure 3 shows the participant distribution by simulator configuration and gender. The
recruitment of subjects was limited by time and logistics and in each case we attempted to maximize the number of subjects.
0 25 50 75 100 125
Configuration Type
Nu
mber of
Part
icipan
ts
Females 111 106 100 Males 104 74 59Single Monitor Three Monitor Vehicle cab
Figure 3. Subject Population
Accident Results
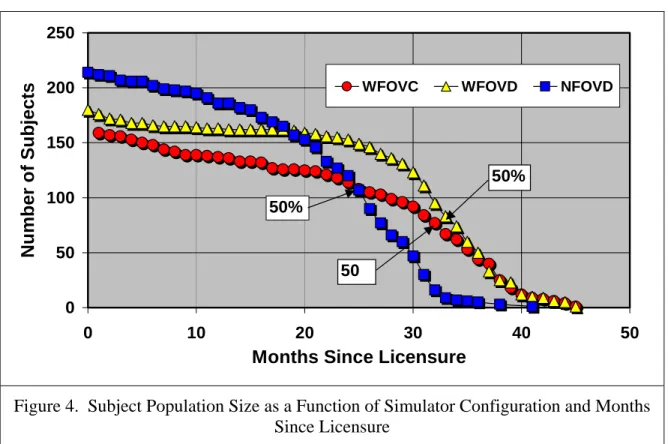
Accident data for our student population was obtained from the state of California Department of Motor Vehicles in October 2006. This allowed over two years of accident experience for each group. The licensed subject population for the accident data varied between groups and over time as shown in Figure 4. We did not have control over subjects getting their driver’s license, and the Figure 4 data are a consequence of some subjects getting their licenses later than others. The high school driver education students (NFOVD) represented the largest population, but generally obtained their licenses later than the DMV recruitment groups (WFOVC and WFOVD) and so their population size fell off the fastest as a function of time since licensure. The 50% point of each population is indicated in Figure 4. This occurred at 25 months for the NFOVD group, while WFOVC group half size point occurred at 32 months and the NFOVD group half size point occurred at 33 months. These half size population points will be used as a limit on computing accident rates as will be discussed below.
0 50 100 150 200 250 0 10 20 30 40 5
Months Since Licensure
Nu mb er o f Subj ects 0 WFOVC WFOVD NFOVD
50%
50
50%
Figure 4. Subject Population Size as a Function of Simulator Configuration and Months Since Licensure
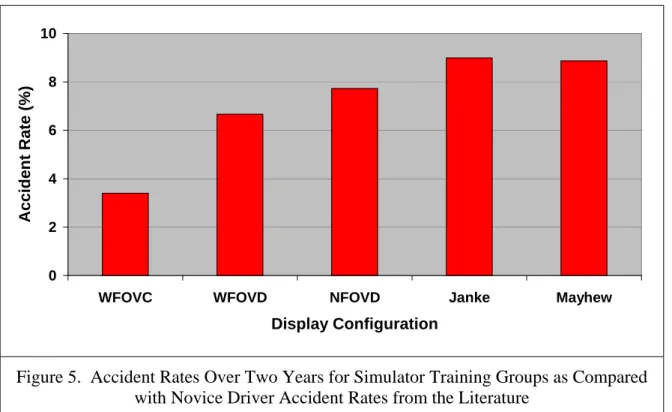
Figure 5 shows accident rates over the first two years of driving for our simulator trained groups as compared with data of traditionally trained novice drivers in California ( 1) and the Canadian province of Nova Scotia ( 17). The lowest accident rate is found with the WFOVC group trained in an instrumented cab with a full size projected roadway display as shown in Figure 1. The WFOVD group has the next lowest accident rate and were trained on the wide field of view desktop system shown in Figure 1. The accident rates for the single monitor training groups were marginally lower than accident rates from the literature for drivers trained by traditional methods. The accident rates for our simulator groups in Figure 5 are for nominally two years. These are good averages for the data from the literature, but are problematic as suggested by the distributions for the number of students in the simulator training group populations illustrated in Figure 4. The population size of our simulator trained subjects declines because some subjects delayed longer than others to obtain their license. Because of this we need to compute accident rates on a time increment basis, taking into account the population size at each time increment as discussed below.
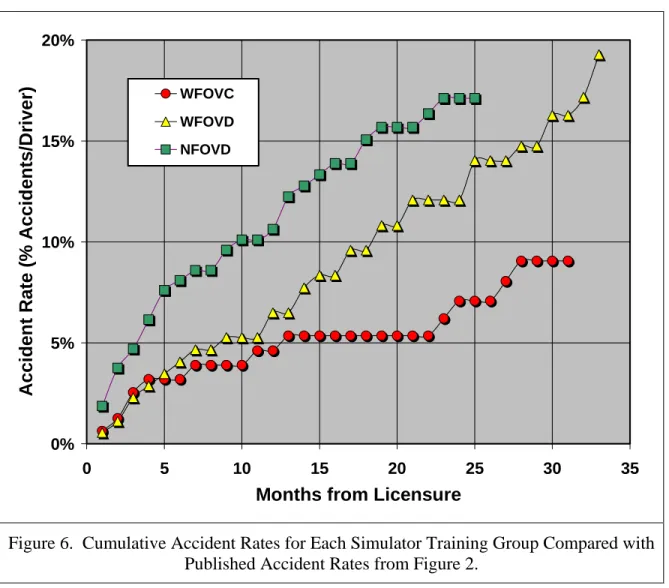
Our declining population size with time was accounted for by computing accident rates per driver on a month by month basis according to the month by month population size given in Figure 4. For each simulator configuration group the total accidents for that group for any given month were divided by the population size of that group during that time period. The cumulative accident rates were then plotted as illustrated in Figure 6. These distributions illustrate the frequency with which accidents accumulate in each of the populations. Here we see the rate of accumulation of accidents for each simulator configuration training group. Initially, the WFOVC and WFOVD groups have a similar accident history, but beyond about six months the WFOVC (Cab + wide filed of view
projected display) shows the lowest accident rate. The NFOVD (narrow field of view desk top) configuration shows the highest initial accident rate, and the highest longer term accident rate.
0 2 4 6 8 10
WFOVC WFOVD NFOVD Janke Mayhew
Display Configuration Ac c ide nt Ra te (%)
Figure 5. Accident Rates Over Two Years for Simulator Training Groups as Compared with Novice Driver Accident Rates from the Literature
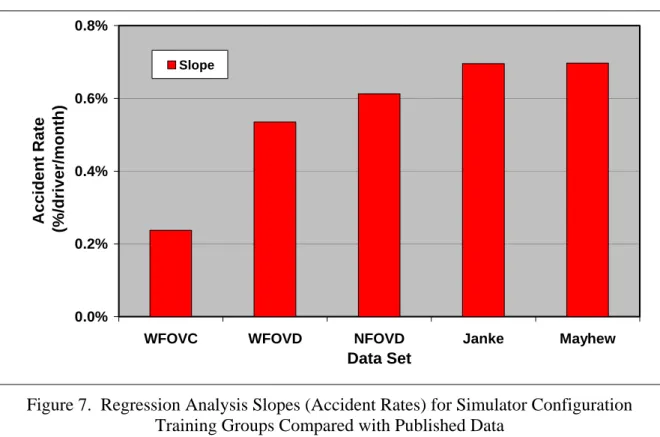
The accident rates of the simulator configuration training groups were compared with the published California ( 1) and Canadian ( 17) accident rates by linear regression analysis. Regression analysis results are summarized in Table 1. Here we see first that the correlations are quite high so that the results are fairly reliable. The confidence intervals indicate that accident rates, represented by the regression slope, of the WFOVC and WFOVD groups are reliably lower than the traditionally trained drivers in California and Canada based on non-overlapping confidence intervals. The accident rate of the WFOVC group is also reliably lower than the WFOVD group. Even the NFOVD slope is marginally lower than the published data sets, although the initial intercept is definitely higher, which suggests a higher initial accident rate but a lower accumulation rate. The regression slopes are plotted in Figure 7.
Discussion
The results of this study suggest that simulator training can lower novice driver accident rates. The experimental design involved a between groups comparison of simulator configurations. There are definite differences in accident rate between the three simulator configuration groups. There are also some uncontrolled variables between these groups since the narrow field of view desktop systems were run in schools, while the wide field of view systems were run in simulator laboratories. The simulator laboratories recruited subjects from DMV offices, and their geographical locations suggest similar ethnic compositions. The vehicle cab + full sized projected wide field of view display gave an accident rate less than half that of the three monitor desktop system
0% 5% 10% 15% 20% 0 5 10 15 20 25 30 35
Months from Licensure
Acci den t Rate (% Acci d e nts/ Dri ver) WFOVC WFOVD NFOVD
Figure 6. Cumulative Accident Rates for Each Simulator Training Group Compared with Published Accident Rates from Figure 2.
Table 1. Linear Regression Analysis Summary of Accident Rates for Each Simulator Configuration Training Group as Compared with Published Accident Rates Data Set R2 Coefficients P-value Lower 95% Upper 95%
Mayhew ( 17) 0.993 Intercept 0.01637 0.0000 0.01280 0.01993 Slope 0.00697 0.0000 0.00672 0.00722 Janke ( 1) 0.999 Intercept 0.01035 0.1868 -0.01219 0.03289 Slope 0.00696 0.0005 0.00627 0.00764 WFOV/Cab 0.918 Intercept 0.01778 0.0000 0.01303 0.02254 Slope 0.00237 0.0000 0.00211 0.00264 WFOV/Desktop 0.986 Intercept 0.00795 0.0009 0.00351 0.01240 Slope 0.00535 0.0000 0.00512 0.00558 NFOV/Desktop Intercept 0.035365 0.0000 0.02830 0.04243 0.968 Slope 0.006125 0.0000 0.00563 0.00662
0.0% 0.2% 0.4% 0.6% 0.8%
WFOVC WFOVD NFOVD Janke Mayhew
Data Set Acc ident Rate ( % /driver/mo nt h ) Slope
Figure 7. Regression Analysis Slopes (Accident Rates) for Simulator Configuration Training Groups Compared with Published Data
which had about 77% of the accident rate of published conventionally trained novice driver accident rates. The vehicle cab training group’s accident rate was about 34% of the published data which is a rather dramatic reduction even considering the possibility of the influence of uncontrolled variables.
These results have implications for training simulator display configurations and more broadly for simulator fidelity. At a minimum it would appear that full sized projected displays are significantly superior in their training value to minified monitor presentations. The wide field of view also seems to be important, as the groups trained on the single monitor display only had some slight improvement in accident rate. Previous analysis of the training data has shown some downsides to the single monitor training where drivers seem to drive faster than with the wide field of view displays which could relate to peripheral cues ( 16).
The value of the instrumented cab and surround is unknown at this time, and is a significant confounding variable. It would appear at a minimum that simulators for driver training should have wide aspect ratio displays scaled and positioned to give real world image sizing and including real image side view mirrors (not icons as presented by the single monitor desktop configuration herein). There are other confounding variables with each of the simulator training groups involving their selection, supervision and administration of training as listed in Figure 1. The simulator training with the higher fidelity configurations occurred in research laboratories and was administered by research staff, and subjects were recruited at local California Department of Motor Vehicle offices. The single monitor systems were deployed in high schools as part of their driver
education classes. Students and teachers did report enthusiasm for the simulator training system, and it did seem to integrate in well with their traditional curriculum.
Concluding Remarks
This research indicates that driving simulator training appears to influence novice driver accident rates. The simulator training considered here involved repeated exposure to critical hazards designed to teach situation awareness, hazard perception and decision making under time pressure that allowed novice drivers to learn from their errors. The results show that training efficacy varied with simulation fidelity, and that the most effective training seems to depend on full sized, wide field of view driving display images with real (not iconic) rear view mirror imagery. The effects of simulator surround and controls and the training milieu were confounding variables in this research and their effect is not clear. The simulation training was administered within a self administered training system that was found acceptable by teachers and students. Simulator sickness rates have been previously shown to be relatively low.
These results do not lead to a definite description of an appropriate simulator configuration, but near full size imagery is definitely indicated. Large, wide aspect ratio (9x16) images may provide an affordable answer to this requirement and can be provided by flat panel and projected displays. The advent and popularity of HDTV is driving down the cost of large, flat panel displays, which will result in affordable, full size, wide angle displays in the near future. Furthermore, desktop game port controls are getting more sophisticated, and may provide an affordable, acceptable control solution for low cost applications.
Acknowledgement
This research was funding by the US Centers for Disease Control and Prevention under research grant number 5 R44 CE00111-03 entitled “A PC Based Low Cost Simulator for Driver’s Education”.
References
1. Janke, M.K., Masten, S.V., McKenzie, D.M., Gebers, M.A., Kelsey, S.L. Teen and
Senior Drivers. CA Department of Motor Vehicles, Sacramento, CA,
CAL-DMV-RSS-03-194, March 2003.
2. Arnett, J.J., “Developmental Sources of Crash Risk in Young Drivers,” Injury Prevention, 8 (Supplement II), pp.ii17-ii23, 2002.
3. Williams, A.F. and Ferguson, S.A., “Rationale for Graduated Licensing and Risks it Should Address,” Injury Prevention, 8 (Supplement II), pp.ii9-ii16, 2002.
4. Mayhew, D.R. and Simpson, H.M., Youth and Road Crashes: Reducing the Risks from Inexperience, Immaturity and Alcohol, Ottawa, Ontario: Traffic Injury Research Foundation, 1999.
5. Williams, A. F, “Teenage drivers: patterns of risk,” Journal of Safety Research, 34(1), 5-15.
6. Masten, S. V., & Chapman, E. A., The Effectiveness of Home-Study Driver
Education Compared to Classroom Instruction: The Impact on Student Knowledge, Skills, and Attitudes, Final Report No. CAL-DMV-RSS-03-203, Sacramento, California Department of Motor Vehicles, 2003.
7. Lonero, L. P., “Beginning driver education: Driver education content,”
Transportation Research E Circular: Driver Education at the Crossroads (No. E-C024), pp. 17-21, Transportation Research Board, Washington, DC, 2001. 8. Williams, A.F. and Ferguson, S.A. “Driver education renaissance?” Injury
Prevention,10:4-7, 2004.
9. Hedlund, J., Compton, R., “Graduated driver licensing research in 2004 and 2005,” Journal of Safety Research, 36, pp. 109-119, 2005.
10. Simons-Morton, B.G., Hartos, J.L. “How well do parents manage young driver crash risks?” Journal of Safety Research, 34, pp. 91-97, 2003.
11. National Research Council, “Preventing Teen Motor Crashes – Workshop Report,” Program Committee for a Workshop on Contributions from the Behavioral and Social Sciences in Reducing and Preventing Teen Motor Crashes, Board on Children, Youth, and Families, Division of Behavioral and Social Sciences and Education, Institute of Medicine and the Transportation Research Board, The National Academies Press, Washington, DC, 2007.
12. Allen, R. W., Rosenthal, T. J., Park, G. D., Cook, M. L., Fiorentino, D. D., & Viirre, E. (2003). Experience with a Low Cost, PC Based System for Young Driver
Training. In L. Dorn (Ed.), Driver Behaviour and Training (Vol. I). Hampshire, UK: Ashgate Publishing Limited.
13. Allen, R.W., Guibert, M.R., et al. (2006), “A User Configurable PC Platform for Driver Assessment and Training,” Proceedings of the Driving Simulation Conference Asia/Pacific, Tsukuba, Japan, May/June 2006.
14. Park, G.D., Cook, M.L., et al., “Automated assessment and training of novice drivers,” Advances in Transportation Studies an international Journal, 2006 Special Issue, pp. 87-96, University of Roma Tre (Italy).
15. Allen, R. W., Cook, M. L., & Park, G. D. (2005). Novice Driver Performance Improvement with Simulator Training. In L. Dorn (Ed.), Driver Behaviour and Training (Vol. II). Hampshire, UK: Ashgate Publishing Limited.
16. Park, George D., Allen, R.W., et al., “Training effectiveness: How does driving simulator fidelity influence driver performance?” Proceedings of the Human Factors and Ergonomic Society 49th Annual Meeting, September 2005.
17. Mayhew, D.R., Simpson, H.M., Pak, A., (2003). Changes in Collision Rates among Novice Drivers During the First Months of Driving. Accident Analysis and
Prevention, 35, 683-691.
18. Ivancic, K. and Hesketh, B., (2000) “Learning from errors in a driving simulation: effects on driving skill and self-confidence,” Ergonomics, vol. 43, no. 12, pp. 1966-1984.
19. Joung, W. and Hesketh, B., (2006) “Using ‘War Stories” to Train for Adaptive Performance: Is it Better to Learn from Error or Success,” Applied Psychology: An International Review, 55 (2), 282-302.
20. Park, G. D., Rosenthal, T. J., Allen, R. W., Cook, M. L., Fiorentino, D. D., & Viirre, E. (2004, September 20-24,). Simulator Sickness Results Obtained During a Novice Driver Training Study. Paper presented at the Human Factors Ergonomics Society 48th Annual Meeting, New Orleans. (STI-P-637)
21. Park, G., Rosenthal, T.J. and Aponso, B.L. (2004), “Developing Driving Scenarios for Research, Training and Clinical Applications,” Advances in Transportation Studies an International Journal, 2004 Special Issue, December, pp 19-28, Aracne, Rome, Italy.