University of Rhode Island University of Rhode Island
DigitalCommons@URI
DigitalCommons@URI
Open Access Master's Theses 2017Evaluation of Geospatial Features for Forecasting Parking
Evaluation of Geospatial Features for Forecasting Parking
Occupancy Using Social Media Data
Occupancy Using Social Media Data
Johannes Riedel
University of Rhode Island, [email protected]
Follow this and additional works at: https://digitalcommons.uri.edu/theses
Recommended Citation Recommended Citation
Riedel, Johannes, "Evaluation of Geospatial Features for Forecasting Parking Occupancy Using Social Media Data" (2017). Open Access Master's Theses. Paper 1055.
https://digitalcommons.uri.edu/theses/1055
EVALUATION OF GEOSPATIAL FEATURES FOR FORECASTING PARKING OCCUPANCY USING SOCIAL MEDIA DATA
BY
JOHANNES RIEDEL
A THESIS SUBMITTED IN PARTIAL FULFILLMENT OF THE REQUIREMENTS FOR THE DEGREE OF
MASTER OF SCIENCE IN
INDUSTRIAL AND SYSTEMS ENGINEERING
UNIVERSITY OF RHODE ISLAND 2017
MASTER OF SCIENCE THESIS OF
JOHANNES RIEDEL
APPROVED:
Thesis Committee:
Major Professor Jyh-Hone Wang
Valerie Maier-Speredelozzi Christopher Hunter
Nasser H. Zawia
DEAN OF THE GRADUATE SCHOOL
UNIVERSITY OF RHODE ISLAND 2017
ABSTRACT
Urbanization and growing individual mobility are globally active trends that intensify the needs for transportation in cities. In this context, parking space has become a scarce resource. Drivers searching for open parking spots cause about one third of the total traffic in urban areas. This creates significant fuel consumption, greenhouse gas emissions and time loss. Intelligent Transportation Systems with particular focus on parking are a promising approach to overcome the information asymmetry and lead drivers directly to available parking spots. This requires highly accurate occupancy data for parking areas on a geographically extended scale.
The ultimate goal of this thesis is to improve the modeling of parking occu-pancy by extraction of meaningful features from raw data in social media. The research focus is set to points of interest and public events in urban areas. First, robust methodologies are developed for the acquisition and benchmarking of large-scale social media data. This includes exploratory data analysis and testing of Face-book as a leading platform against alternative online data sources. Here, a multi-stage approach for the identification of duplicates in heterogeneous data sources is applied. Secondly, a diverse set of feature extraction methodologies is developed that integrates a variety of secondary data sources and findings in the literature. This comprises the adjustment of online popularity attributes for social media ob-jects based on external data and the extraction of parking-related attributes based on text mining. Additionally, historical parking events from Floating Car Data are cross-referenced to thematic similarities among objects and adequate feature sets are derived. This includes the category-specific transformation of historical parking patterns into characteristic time- and object-dependent features. Also, text-based topic modeling using Latent Dirichlet Allocation is applied on social media data to
extract thematic object similarities as probabilistic input features for parking de-mand modeling. In the final evaluation phase, ground truth occupancy data for a selection of off- and on-street locations is used to compare machine learning models trained with varying input feature sets. A baseline and extended set are compared while the latter includes extracted social media features. These models account for the prediction of parking occupancy over different timeframes. Random for-est learning machines that include social media features are found to outperform the tested baseline models for both off- and on-street parking demand modeling. Particularly event topic probabilities and category-specific parking events on an hourly basis are identified to be valuable.
Contents
ABSTRACT . . . ii
Contents . . . iv
List of Figures . . . viii
List of Tables . . . xi
Chapter 1 Introduction . . . 1
1.1 Urban relevancy of parking space availability . . . 1
1.2 AIPARK parking information platform . . . 2
1.3 Research design . . . 4
1.3.1 Primary research questions addressed . . . 4
1.3.2 General methodological overview . . . 5
2 Contextual background . . . 7
2.1 Popular solutions to the urban parking problem . . . 7
2.1.1 Parking guidance systems . . . 7
2.1.2 Stationary sensors . . . 8
2.1.3 Crowdsensing . . . 9
2.2 Introduction to data mining . . . 10
2.2.1 Cross Industry Standard Process for Data Mining . . . . 10
2.2.2 General concepts in machine learning . . . 12
2.2.3 General procedure for data source selection and feature integration . . . 13
Page
2.2.4 General concepts in feature engineering . . . 15
2.2.5 General concepts in text mining . . . 19
2.3 Geospatial information in social media platforms . . . 23
2.3.1 Characteristics of volunteered geographic information . . 23
2.3.2 Mobility characteristics of social media users . . . 25
2.3.3 Interaction characteristics of social media users . . . 27
2.4 Modal split in Germany . . . 28
3 Literature review . . . 31
3.1 Modal split modeling . . . 31
3.2 Modeling of driver behavior . . . 36
3.3 Event influence on the parking situation . . . 37
3.3.1 Estimation of event popularity based on social media data 37 3.3.2 Event influence on parking demand . . . 41
3.4 Points of interest influence on the parking situation . . . 43
3.5 Modeling parking occupancy . . . 44
4 Data Acquisition . . . 47
4.1 Preliminary evaluation of leading online data sources . . . 47
4.2 Facebook POI data . . . 50
4.2.1 Data acquisition . . . 50
4.2.2 Data characteristics . . . 53
4.3 Facebook event data . . . 57
4.3.1 Data acquisition . . . 57
Page
4.4 Reference data . . . 64
4.4.1 OpenStreetMap . . . 64
4.4.2 Eventbrite . . . 64
4.4.3 Ticketmaster . . . 66
4.5 Summary of data collected . . . 67
5 Data source benchmark . . . 69
5.1 Duplicate identification techniques . . . 69
5.1.1 Context matching . . . 70
5.1.2 Name matching . . . 70
5.1.3 Categorical matching . . . 72
5.2 Benchmark results . . . 74
5.2.1 POI data sources . . . 74
5.2.2 Event data sources . . . 77
6 Feature engineering . . . 82
6.1 Feature extraction roadmap . . . 82
6.2 Adjusted popularity measures . . . 84
6.2.1 Adjustment using a reference data source . . . 85
6.2.2 Adjustment using domain knowledge . . . 88
6.3 Text mining for feature extraction . . . 89
6.3.1 Target group attributes . . . 90
6.3.2 Event content attributes . . . 92
6.3.3 Estimation of sample size required . . . 95
Page
6.4.1 Parking events as direct modal split indicator . . . 97
6.4.2 Category-specific parking demand for POIs . . . 99
6.4.3 Category-specific parking demand for events . . . 102
6.4.4 Parking demand from topic models . . . 104
6.5 Summary of extracted features . . . 109
7 Feature evaluation . . . 111
7.1 Feature evaluation workflow . . . 111
7.2 Off-street evaluation . . . 113 7.3 On-street evaluation . . . 116 8 Discussion . . . 119 8.1 Data acquistion . . . 119 8.2 Database benchmark . . . 120 8.3 Feature engineering . . . 121
8.3.1 Adjusted popularity measures . . . 121
8.3.2 Text mining for feature extraction . . . 122
8.3.3 Thematic modal split modeling . . . 124
8.4 Feature evaluation . . . 126
8.5 Conclusion and contributions . . . 129
8.6 Future work . . . 130
LIST OF REFERENCES . . . 133
APPENDIX BIBLIOGRAPHY . . . 156
List of Figures
Figure Page
1 Elements of the AIPARK platform . . . 2
2 General phases of the developed research methodology . . . 5
3 CRISP-DM top-level phases . . . 11
4 Key limitations and decision points for modeling . . . 14
5 General checklist for feature engineering . . . 18
6 Mobility-specific representativeness of Facebook . . . 26
7 Modal split in Germany by travel purpose 2008 . . . 29
8 Modal split in Germany by age group 2008 . . . 30
9 Relevant influence factors on the preference of car-related travel 32 10 Relevant influence factors on event attendance . . . 38
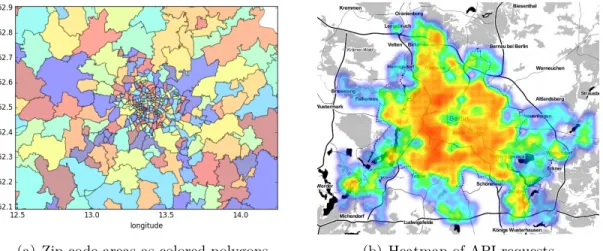
11 Facebook API request characteristics . . . 51
12 API requests per zip code area for the city of Berlin . . . 52
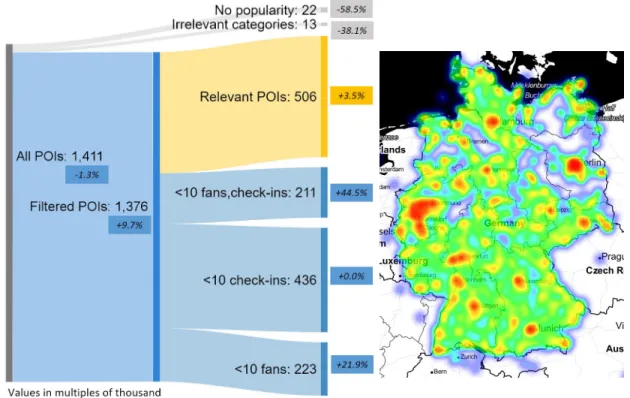
13 Facebook POI characteristics . . . 54
14 Most popular Facebook POI categories . . . 56
15 Facebook event data quality and popularity . . . 60
16 Distribution of event occurrence by superior categories . . . 61
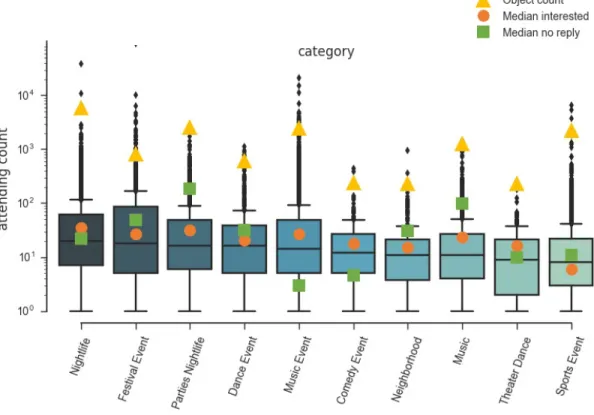
17 Ten most popular Facebook event categories . . . 62
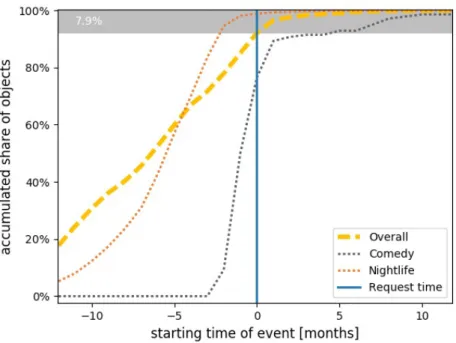
18 Facebook event distribution relative to the request time . . . 63
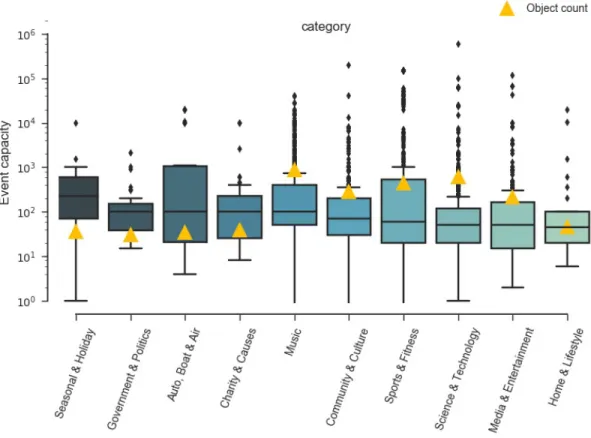
19 Eventbrite event capacity distribution . . . 65
20 Ticketmaster median ticket prices for the most represented event categories . . . 67
Figure Page
21 Labeled dataset for duplicate identification . . . 76
22 POI duplicate identification results . . . 77
23 Labeled Ticketmaster event matches . . . 79
24 Labeled Eventbrite event matches . . . 80
25 Event duplicate identification results . . . 81
26 Interconnection between social media data and parking demand with extracted feature sets . . . 83
27 Adjusted popularity with reference data source . . . 86
28 Facebook POI popularity adjustment factor distribution . . . . 87
29 Event domain knowledge from Doorkeeper . . . 89
30 Classification accuracy for outdoor attribute . . . 94
31 Classification accuracy by number of samples considered . . . . 96
32 Cross-referencing parking events to Facebook objects . . . 99
33 Parking events at shopping malls during and after opening hours per weekday . . . 101
34 Parking events at shopping malls per hour and weekday . . . . 102
35 Classifier accuracies for event category reconstruction by num-ber of features considered . . . 104
36 Obtained perplexity of LDA models by number of topics and training set . . . 106
37 Topic distribution and most relevant features . . . 107
38 Probabilistic parking event distribution per topic (0.5 km focus polygons) . . . 108
39 Summary of extracted features . . . 110
Figure Page 41 Random forest off-street prediction performance in different
fea-ture configurations . . . 114 42 Random forest on-street prediction performance in different
fea-ture and target configurations . . . 117 F1 Distribution of zip code areas in Germany by size . . . 150 F2 Assignment of Facebook event categories to superior segments . 151 F3 Sample assignment of Facebook and OSM categories regarding
POIs . . . 152 F4 Trend line for check-in rate by event size on Doorkeeper platform154 F5 Classification accuracy for alcohol attribute . . . 154 F6 Probabilistic parking event distribution per topic (2.0 km focus
List of Tables
Table Page
1 Leading online data sources in relevant areas . . . 47
2 Explained variance by feature group and prediction timeframe for off-street occupancy . . . 115
3 Explained variance by feature group and prediction timeframe for on-street occupancy . . . 118
T1 Manually excluded place categories on Facebook . . . 151
T2 Categorical matching results for event data sources . . . 153
CHAPTER 1 Introduction
1.1 Urban relevancy of parking space availability
Urbanization and growing individual mobility create new challenges for to-day’s city infrastructures. Especially in emerging economies, increasing urban population and individual wealth lead to a new level of mobility needs. This ex-presses in terms of rapidly growing passenger cars numbers due to the fact that they are perceived as status symbols in many cultures. The number of vehicles in China, for instance, almost tripled between 2007 (59 Million) and 2015 (172 Million) [1]. Also in developed economies such as Germany, the total number of passenger cars still undergoes slight increases, even though the population is rather declining [2]. An extension of existing infrastructure is required but typically is found infeasible due to budget regulations or space limitations [3].
In this context, parking space can be considered a precious resource in the urban environment. Empirical studies have shown that roughly one third of the total city traffic is caused by drivers searching for available parking [4]. This consumes resources, causes noise and increases air pollution. In fact, the quality of life in urban hotspot areas decreases remarkably with intensified traffic and shortage of parking space. Another result is the increase of illegally parked vehicles that cause macroeconomic costs being estimated to $80 Million per year alone in the city of Barcelona, Spain [5]. The individual time for drivers to find urban parking generally varies among cities but typically ranges between 3.5 to 14 min as has been stated by Shoup 2006 [6]. Therefore, parking must be considered an important factor when planning mobility and deciding on a certain travel mode [7].
1.2 AIPARK parking information platform
Artificial Intelligence Based Parking (AIPARK) is anIntelligent
Transporta-tion System (ITS) that provides comprehensive information related to the parking
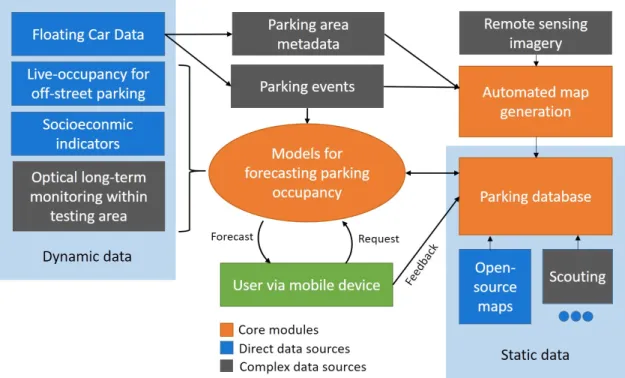
situation in cities. The system evolved from research activities at TU Braunschweig starting in late 2015 and provides data for currently more than 60 Million parking spots in Germany. AIPARK’s main purpose is to guide drivers to available parking space near their travel destination. An overview on the elements of AIPARK is provided in Figure 1.
Figure 1. Elements of the AIPARK platform
AIPARK is implemented as a scalable platform that includes modules for data acquisition, processing, modeling and user interaction. Moreover, a comprehensive database of static information is provided that contains the location of parking areas and relevant metadata such as opening hours, pricing or parking restrictions. This database was initially based on open-source map data derived from numerous
and can be used within the AIPARK system without major adjustments. Thus, they are referred to as ’direct data sources’ in Figure 1. At a later point in time, modules for the automated generation of parking maps are used to refine the existing information and extend the coverage of the parking database. A core technology is the analysis of remote sensing imagery, such as satellite or aerial images for the purpose of map generation. In the course of this step, geographic locations are identified where on-street parking is possible. Significant research and development efforts are involved in extracting valuable information from the raw imagery. Therefore, this type of data is referred to as ’complex’.
The second mapping process is focused on the generation of parking area metadata based on the analysis of Floating Car Data (FCD). The latter refers to
positional information generated by GPS or mobile devices that are placed within vehicles. By accumulating data from a number of sample vehicles over time, con-clusions on traffic flow and driver behavior can be drawn [8]. AIPARK uses the concept of parking events, an approach that focuses on identifying when drivers
leave or successfully find a parking spot based on FCD analysis. Also, negative parking events are considered, denoting the unsuccessful search of available park-ing spots indicated by certain drivpark-ing patterns. Minor corrections of the parkpark-ing database are conducted based on local scouting, the manual on-site collection of
data using specific mobile applications.
Another core module of AIPARK are machine learning models that provide occupancy information for urban parking areas in the static database. Diverse dynamic data sources are acquired, prepared and transformed into valuable input features for model generation. Besides parking events from FCD, occupancy in-formation for off-street parking facilities and sensor-monitored on-street spots are considered. Also, diverse contextual factors are taken into consideration, such as
socioeconomic indicators. The latter comprises area-specific statistical data for the factors car ownership, income level, business activity and age distribution. As a subproject, long-term optical observation of parking areas is conducted for strate-gically important parking spots in urban areas. This is based on the automated extraction of occupancy information from camera footage that monitors parking areas over several weeks. To maintain this complex data source, costs and timewise efforts are comparably high. This is why long-term optical observation is primar-ily conducted within the city of Braunschweig that serves as a testing area for the AIPARK platform.
1.3 Research design
1.3.1 Primary research questions addressed
Social media platforms are one of the most rapidly growing sources of mul-tifaceted online data of our time. Users interact and share their personal data in different explicit and implicit ways on a regular basis. Social media is expected to reflect trends, opinions and behavior in society and on a personal level. Significant research has addressed the question of how the available information can be used to derive new insights in the field of mass mobility. However, the aspect of parking demand has not been sufficiently addressed despite its relevancy due to globally increasing car usage.
This thesis aims at improving the understanding of geographically referenced social media data and its relevancy as a data source for modeling urban parking demand. A special focus is set to two different types of objects: Points of interest (POIs) and public events. The research design approaches the domain from a the-oretical, literature-based perspective, as well as from a practical, implementation-related side. This guarantees that relevant findings are also evaluated with regards to their real-life implications and scalable feasibility.
1.3.2 General methodological overview
Addressing the research questions previously introduced, the methodological framework developed in this thesis is subdivided in four subsequent phases. They are presented in Figure 2. In the first phase, different online data sources for POIs and events are preliminarily evaluated and leading social media and alternative platforms are selected for further investigation. Subsequently, large-scale data is acquired from these sources using their publicly accessible application program-ming interfaces (APIs). This phase is referred to asData Acquisition (Chapter 4).
As the AIPARK project is primarily active in Germany, scalable data collection procedures are developed to acquire the target information on a nationwide scale. Dense data availability is a basic requirement of drivers using ITS. In fact, also potentially relevant social media data as input for parking demand modeling must be available with significant coverage. This phase is crucial to prove the general technical feasibility.
Figure 2. General phases of the developed research methodology
As part of the phaseData source benchmark(Chapter 5), the acquired datasets
are compared to specify the inherent value interconnected with their individual in-tegration into the forecasting system. This helps understand the benefit of social media against alternative data sources. An important step in this phase is the identification of duplicate objects among datasets using text mining and super-vised learning algorithms to get reliable estimates on the scope of the examined databases.
procedures used to transform raw social media data into a variety of potentially valuable sets of input features. The applied techniques are primarily based on data fusion, integrating findings from the literature and text mining.
In the last phase,Feature evaluation (Chapter 7), a testing procedure is
devel-oped to evaluate the previously extracted features. This covers their implications on the occupancy of both off- and on-street parking. This comprises the training of multiple machine learning models while comparing the prediction performance of a baseline featureset to an extended version that includes the extracted social media features. The benefit of specific extraction procedures is also evaluated.
CHAPTER 2 Contextual background
This chapter provides an introduction to established technical approaches used for solving the parking problem in urban environments. Also, basic concepts in data mining are briefly described and the characteristics of social media as a source for geospatial information are investigated. Moreover, certain mobility indicators for Germany are introduced as it is the geographic focus area of this study. This is expected to be valuable for contextual understanding of the modal split indicators observed and to make the derived findings more comparable to other focus areas in future studies.
2.1 Popular solutions to the urban parking problem
There are several alternatives that focus on improving the availability of park-ing in cities. The simplest option is to have governmental actions focus on increas-ing the infrastructural capacity to an extent where no parkincreas-ing shortage occurs. Typically, this is seen as highly unrealistic for most scenarios based on the neces-sity of significant public investments and land use. Also, the inherent improvement potential is very limited with regards to dense historic city centers or highly fre-quented areas that would be affected by extensive construction work. For this reason, the usage efficiency of existing infrastructure must be increased.
2.1.1 Parking guidance systems
Information systems that guide drivers to available parking spots improve the infrastructural utilization and are currently widely spread. These approaches fundamentally rely on the public availability of detailed parking information with regards to the destination area. By different means, this knowledge is shared
among drivers using public display boards or smartphone applications. Recent approaches also consider the distribution of parking information using vehicular ad hoc networks [9]. In consequence, the time consuming search for open parking spots is minimized.
On one hand, based on discrete event simulations for a single parking lot, Surpris, Liu,and Vincenzi [10] only identified insignificant time gains due to the introduction of a parking information system. This is interpreted as a result of the limited scope of the study. On the other hand, Caicedo et al. 2006 [11] stated reductions of required searching times of up to one third when trying fo find parking in multilevel garages. Generally, driver acceptance for IT-supported applications that deliver parking information is very high [12]. These systems are found to trigger several positive effects for urban life such as reduced traffic congestion and decreased searching time [13]. Guidance systems are most likely to be used by drivers who are unfamiliar with the destination area [14].
2.1.2 Stationary sensors
As of today, existing systems cover mostly only parking garages or other paid areas. These are generally referred to as off-street parking. Here, occupancy
data can be easily acquired as digital entrance barriers and sensors are widely distributed. Parking operators are primarily interested in collecting occupancy data for management insights and often also share this information with the pub-lic. The vast majority of parking spots in cities, however, is present in the form of on-street parking. In this context, occupancy information is not as easily
ac-cessible and must be generated using specific sensors that have to be primarily financed with local governmental budgets. Many different stationary systems for parking surveillance have been developed. Popular concepts cover radar sensors installed on street lights [15], camera-based surveillance using large-scale image
processing [16] or magnetic field sensors integrated into the ground [17]. All of these approaches correspond with high expenses for installation and maintenance. Moreover, each of the systems can only cover a very limited amount of parking spots. One of the largest pilot projects involving parking sensors was the SFpark
project. 6,000 systems were installed at an estimated cost of approximately USD 1.5 million. However, the project only covered slightly more than two percent of the estimated city’s 281,000 on-street parking spots [18]. In fact, full-scale cover-age with stationary parking sensors is very unlikely due to limited public budgets. Therefore, stationary sensor systems cannot be considered a general solution for the urban parking problem.
2.1.3 Crowdsensing
An alternative to stationary sensors is the implementation of crowdsensing
systems that dynamically collect data and automatically extract certain geospa-tial features. Cruising vehicles have been used as mobile ultrasonic sensor nodes that generate dynamic maps of vehicles parked on-street. Mathur et al. 2010 [18] used these sensors to detect signal patterns that relate to parked cars on the street sides while the measurement vehicle was normally driving. Evaluating the collected data, an overall information accuracy of more than 90 percent was achieved. More-over, the effect of attaching sensors to a population of taxicabs was simulated and significant savings were predicted when using crowdsensing instead of stationary parking sensors.
Several approaches exist that focus on smartphone data for obtaining occupancy-related information. Rinne and Törmä 2014 [19] combined
geofenc-ing and activity recognition to detect when drivers are located on a designated
parking area and try to find an open spot. For instance, if designated parking lots are highly occupied in reality, users tend to leave without parking and continue
searching for an alternative. If spots are sufficiently available, this is indicated by successful parking events. The system suffers from the fact that every sta-tus change of a parking lot requires at least one user that cannot find an open spot immediately. Also, the procedure is not applicable to small parking lots that drivers can easily overview without entering. In this case, no trace of unsuccessful searching for parking is found in the generated movement data.
Other researchers examined the potential of magnetic field sensors in smart-phones to detect nearby vehicles [20] [21]. As cars are typically built from a signif-icant share of ferromagnetic material, they cause magnetic perturbations that can be measured as deflections of the geomagnetic field. The detection principle has successfully been used within stationary sensors [17]. Mobile systems face limita-tions due to dynamically changing environmental variables and low sensitivity of the measurement devices. Even though the preliminary results are promising, no fully functional system for identification of open parking spots was yet published. Besides, mobile payment records as another source of information generated by smartphones, also have been used to derive parking occupancy information [22].
2.2 Introduction to data mining
This section provides a summarized overview on the state of the art in data mining and related sub-disciplines. It introduces typical workflows in the field and creates a simplified schema with regards to the variety of different concepts. For detailed explanation of the machine learning algorithms used in the course of this thesis, it is referred to more in-depth literature.
2.2.1 Cross Industry Standard Process for Data Mining
The Cross Industry Standard Process for Data Mining (CRISP-DM) is the
1990s by a consortium of industrial companies which, at the time, were leading in applying data analysis techniques. Nowadays, it serves as one of the basic con-cepts for the data mining field. It consists of six phases that are relevant for both commercial and scientific use cases, and is independent from specific platforms and tools used. An overview is provided in Figure 3. The framework’s main purpose is the facilitation of communication among analysts, customers and other stake-holders. CRISP-DM helps structuring data analysis projects and provides general guidance. Each top-level phase consists of diverse lower-level tasks, checklists and recommendations [23].
Figure 3. CRISP-DM top-level phases [24]
The first phase business understanding is focused on defining the objectives
of the analysis project and deriving specific data mining goals and success crite-ria. This includes assessing the given situation regarding resources, requirements, preliminary assumptions and potential risks involved. Also, the cost-benefit ra-tio of the data mining project must be considered. Subsequently, during data
understanding, raw data is collected and its characteristics are analyzed. This
leads to a verification that the available data quality is sufficient for further us-age. Afterwards, in the course of data preparation, low-quality data is corrected
or removed and meaningful data is selected to be used in downstream procedures. Among others, this comprises merging of heterogeneous information, formatting and construction of new attributes from existing ones. During themodeling phase,
adequate techniques are chosen to fit the specific requirements of the available data. Non-linear relationships among attributes, for example, can only be modeled with adequate learning algorithms that are not limited to linear functions. State of the art implementations of these algorithms typically offer a broad range of possible parametrization that affects the model performance. To assess the model qual-ity, the available data is divided into subsets for training and testing. The model quality is determined by its respective accuracy on the test set which contains unseen values. Using revised configurations, modeling is a highly iterative process. During the subsequent evaluation phase, the model outcome is compared to the
originally defined success criteria and the entire data analysis process is reviewed. In case there are potential improvements, the process is restarted in any of the preceding phases to correct errors or extend the scope of actions. If the evaluation indicates successful completion of the project, deployment of the obtained results
into productive systems can follow. However, in the context of CRISP-DM, this phase mainly comprises planning and monitoring activities of the deployment [24]. 2.2.2 General concepts in machine learning
In machine learning, it is generally distinguished between supervised and
un-supervised analysis problems. In the supervised case, models are generated to
predict a given target attribute based on a variety of input features. Classification
set of labeled training samples. Regression tasks denote settings where the target
variable is continuous. For unsupervised learning, there is no corresponding target attribute for the given feature vectors. Here, the ultimate goal may be exploratory data analysis or grouping of somehow similar data. This is referred to asclustering.
Evaluation of the generated models is based on separating the available data in a set for training and testing. As the latter remains unseen, it represents an adequate basis for examining the achieved generalization of the model. Cross-validationis a
common process of iteratively separating the available data into changing training and testing subsets to evaluate the model accuracy while avoiding overfitting [25].
2.2.3 General procedure for data source selection and feature integra-tion
The scope of potentially important attributes that have an influence on the urban parking situation is comparably large. To give examples, socioeconomic indicators, public holidays or weather conditions are identified to be relevant in literature. Thus, machine learning models intending to reflect the local parking situation have to incorporate these influence factors.
Figure 4 visualizes the process of integrating new attributes into predictive machine learning models. As a first step, multiple hypothesis have to be drawn re-garding the relevance of certain feature groups. If findings in the literature, specific domain knowledge or common sense indicate the potential importance of a certain factor, data sources reflecting this information are identified, accessed and evalu-ated. With regards to parking, common sense for attribute candidate selection is a reasonable practice as it represents an everyday problem. Chosen data sources must contain the valuable attributes with geographical references. Depending on the scope, focus and character of the respective databases, this can be an open-source project or a proprietary reopen-source with nationwide or more narrow coverage.
In practice, the data formats used and the quality of information provided can greatly vary. Thus, the interface-dependent procedures that are necessary for data aggregation have to be tested for feasibility and scalability. As the ultimate ob-jective of AIPARK is superior coverage, the underlying data sources - individually or in combination - have to provide adequate coverage. Data sources that are not accessible with reasonable efforts or lack of quality or coverage cannot be used as a basis for parking occupancy modeling.
Figure 4. Key limitations and decision points for modeling
As soon as the potentially relevant sources are selected, there are plentiful options to extract and select valuable features from the available attributes. In-formation retrieval procedures are applied on the directly accessible attributes to obtain meaningful features for the subsequent model generation. Regarding the modeling itself, there is a multitude of machine learning algorithms that can be applied with nearly unlimited options for parametrization. All in all, the identifi-cation and selection of data sources, the formulation of features from the available data, as well as the training, optimization and selection of different modeling ap-proaches is an extremely time-consuming procedure. The optimal results with regards to the achieved predictive accuracy of the generated model can only be realized if all of the preceding phases of the actual modeling are aligned and well
2.2.4 General concepts in feature engineering
Formulation and selection of relevant input parameters, typically referred to as
features, is the most labor-intensive element of building machine-learning models.
The success of data analysis depends significantly on the input feature vectors [26]. Thus, preprocessing of data is considered to be the most important step in deploying data mining applications [27]. As an example, the winning contribution of the popular 2010 KDD cup data mining competition credited data preparation as their key to success [28].
The term feature engineering comprises both the construction and selection
of valuable attributes. Feature construction increases the dimensionality of the problem. Based on a set of raw information, different strategies can be applied to obtain higher-order attributes. This process is typically manual and demands certain knowledge of the problem sphere. One frequently applied technique is the decomposition of categorical features. For example, if the attribute values are sorted into three classes whereas one of these represents the value ’unknown’, the latter can be instead included as a separate binary feature that gives an indication on the availability of sufficient data. This avoids that a lack of data is consid-ered a separate class. Moreover, continuous variables can be separated into bins that comprise a certain value range to obtain a transformation into categorical attributes. This can improve the understanding of data. Also, changing of units may have positive effects [29]. From a theoretical perspective, the number of at-tributes constructed can be infinite. Automated feature construction supports the growth of data dimensionality [30]. However, in reality, computational resources limit the feasible model complexity. Also, to obtain adequate model accuracy, the required amount of samples grows exponentially. This phenomenon is often referred to as the curse of dimensionality [31]. Especially distance-based models,
for example nearest neighbor classifiers, perform badly in hyperspace [32]. Using a smaller number of attributes to train the model facilitates data visualization, storage, handling and ultimately leads to better model performance [26].
One approach to reduce the present dimensionality is the combination of features into more meaningful representations. Principal Component Analysis
(PCA) constructs a linear combination of multiple attributes while maximizing the retained variance in the dataset. Multidimensional Scaling (MDS), on the
other hand, focuses on maximizing the distance between data points in the lower-dimensional space. Besides these classical techniques, a large number of non-linear approaches exist. It is referred to Van der Maaten et al. 2008 [33] for further information and a comparative study.
After having completed the construction of potentially relevant variables,
fea-ture selection techniques can be applied. It is distinguished between filter and
wrapper methods. Filters are advantageous regarding their consumption of
com-putational resources as they evaluate the importance of attributes independently from a chosen modeling technique. Wrappers, on the other hand, choose an op-timal feature subset based on the relative performance of multiple models being trained with different features. The selected learning algorithm is similar for all compared feature subsets and no model-specific effect on the prediction perfor-mance is to be noted. As a third category,embedded methods for feature selection
are considered. These are model-specific and integrate the evaluation of attributes into the model training process [26].
Both filter and wrapper approaches are based on a variety of search strategies. A popular selection criterion within the filter category are correlation indices be-tween input features and objective variables. Attributes with stronger correlation are considered to be generally more relevant. However, selecting only the most
important features typically is not optimal as it promotes redundancy [26]. An al-ternative concept focuses onsingle variable classifiers, which comprises training of
multiple models only with a single input parameter to be evaluated. The accuracy of the obtained predictions is used as selection criterion for the input parameters. One major disadvantage of this approach is that the observed model performance highly depends on the interaction of dataset and model. Thus, different modeling approaches used for the same input parameter can lead to divergent results [34]. A third alternative is the feature selection in accordance with information-theoretic
criteria.
When applying anexhaustive search strategy for wrapper methods, all
poten-tial attribute subsets are evaluated separately. Especially for large datasets with extremely high dimensionality, this is not feasible due to limitations of computabil-ity within reasonable time frames. Thus, heuristic search strategies are applied.
For example, forward selection begins with a single attribute and adds relevant
features step-by-step. Alternatively, in backward elimination, all attributes can
be considered for the initial feature set, being followed by stepwise attribute re-moval. To determine the ranking of features to be included or removed, typically information-theoretic criteria are used [35].
Guyon and Elisseeff 2003 [26] summarize the strategic procedure of feature construction and selection with a ten-point checklist. It is focused on the practical implementation of the respective techniques in the field and visualized in Figure 5. The order of the phases presented does not follow the proposed workflow of CRISP-DM and may occur in a recurrent or iterative manner. Thus, the sequence shall not be understood in a chronological manner.
After the data is explored and sufficiently understood, certain relevant features can be created ’ad hoc’ if sufficient domain knowledge is available. Subsequently, if
Figure 5. General checklist for feature engineering; based on [26]
the data is skewed or needs other adjustment, it is normalized to minimize the in-troduced bias for subsequent steps. If interdependencies of variables are expected, it is beneficial to construct abstract features from the original data using differ-ent mathematical operations. These are called conjunctive features and represent
higher-order interactions. If the computational resources are limited, summarized basic features can be constructed to reduce the problem dimensionality. These are referred to as disjunctive features and may exemplarily denote weighted sums. If
the influence of single variables is to be understood, filter methods can be applied. In case the main project purpose is the feature exploration, the analysis can be stopped at this point. For most cases, a generalized model predicting the objec-tive attribute represents the ultimate analysis goal. In terms of preparation,dirty
data, especially missing or wrong values, need to be corrected or removed. Values
polation. Missing data based on an specific effect is usually hard to reconstruct. Here, case-specific solutions must be found [36].
The next phase focuses on training various models with different subsets of features. If the underlying relationship between feature and objective attribute is known to be either linear or non-linear, adequate learning machines can be directly chosen. If this information is not available, Guyon and Elisseeff 2003 [26] suggest starting with simple modeling techniques requiring only reasonable computational resources for training. Thus, linear models are to be chosen first and shall be followed by the implementation of non-linear ones while constantly comparing their performances. The authors suggest using forward selection as strategy for feature subset generation. After this phase is completed and sufficient time and resources are still available, other techniques with higher resource consumption can be examined. This may include backward selection or embedded feature selection methods. To maximize the stability of the generated predictor, it shall be tested on different subsets of the data, for example using cross-validation.
Heaton 2016 [27] examined the relationship of different feature construction approaches and the performance of modeling techniques using synthesized datasets. It was found that artificial neural networks (ANNs) and support vector machines (SVMs) perform well on features that are calculated as differences and ratios of basic attributes. For random forests and gradient boosting machines, rather ag-gregated and count-based features are found useful. This is seen as an important reason why superior performance is frequently observed for ensemble learners that rely on individual models from both classes.
2.2.5 General concepts in text mining
Text mining is a subfield of data mining that focuses on the extraction of
processing and uses specific methodologies that apply to unstructured data. The
latter makes data cleansing and feature preparation highly complex. Natural lan-guage processing must deal with ambiguous expressions and highly depends on background knowledge for the analyzed data [37]. The following paragraphs pro-vide a short summary of common techniques in the text analysis domain organized in a chronological order within a typical workflow.
The first step in conducting a text mining project is usually the acquisition of a text corpus - a collection of documents from a specific source or thematic distribution. All further analysis is based on the information distributed in the corpus. Single documents within this collection are typically represented as sparse and high dimensional matrices. Each word is used as a feature that may occur a certain number of times within a given document. This leads to computationally highly expensive analysis operations.
A basic representation of text used for machine learning is calledbag-of-words.
Here, single words are treated as a set of occurrences while their order and gram-mar are not taken into account. For documents where the order of words carries valuable information,n-grams can be used as features. Here, a set of nsubsequent
words is treated as a single unit to account for spatial relationships among words. Text strings are subdivided into bags-of-words usingtokenizers that are based on
a syntactic ruleset. Simple tokenizers separate entities at whitespace characters while more complex algorithms may also account for known expressions, for exam-ple including punctuations. If it is beneficial for the problem domain, tokenization can also be applied to separate entire sentences within a corpus.
Instead of representing word occurrences in a document using binary at-tributes, the respective frequency of terms can be used to assign term weights.
divided by the total number of words in that documentn. This approach considers all terms equally relevant as features. However, many words may only have limited discriminating power with regards to the conducted analysis task. For example, a corpus consisting of documents related to biological descriptions of flowers may show high term frequencies for the terms ’blossom’. In this case, this feature is rather not helpful to distinguish between documents and may cause confusion of the learning machines used downstream. To overcome this problem, the inverse
document frequency (idf) metric is introduced. It measures the term importance
by reducing the feature weight for frequent terms and scaling up for rare terms. It is calculated as the logarithm of the number of documents N divided by the
document frequency (df), the number of documents that contain the feature.
Fi-nally, a combined weighting scheme for each term in each document is generated by multiplying both metrics. This approach is calledtf-idf. It assigns high weights
to terms that are found multiple times within a small portion of documents, re-flecting a higher discriminating power of these. Tf-idf is calculated as presented in Equation 1 whilet refers to a specific term and d to a specific document in the corpus. tf-idft,d= tft,d∗idft = wt nd ∗log N dft (1) As sparsity is a common characteristic of feature spaces from textual data, dimensionality reduction is frequently applied to reduce computational costs and improve the model quality. One common method is the removal of stop words,
frequently used words that do not contain valuable information. Being generally applicable for entire languages, stop words may be articles or prepositions. More specifically for a certain problem domain, also customized terms might be irrele-vant. It has to be noted that a phase-based search often depends on terms that
may generally be considered to be stop words. The n-gram ’flights to Berlin’, for example, crucially changes its meaning if the stop word ’to’ is left out. In fact, there must be a problem-specific decision whether or not to remove stop words. Other methods are focused on summarizing similar words into one feature. A com-mon technique is calledstemming and aims at reducing inflectional word forms by
removing the word suffixes. It is based on a heuristic process that does not always obtain the actual word stems as results. Lemmatization, on the other hand, uses
lexical information and a morphological analysis to return a human-readable base form of the word. The latter is referred to as lemma. The set of terms ’am, are,
is’, for example, can be projected on the verb infinitive ’be’ [38].
Common unsupervised learning methods for text data are clustering andtopic
modeling. Both problems are closely related while clustering produces a hard
segmentation of different groups and topic modeling results in soft membership probabilities for a given document. Each of the identified topics in the corpus represents a probability distribution of word features. If it is known that documents in a given corpus can contain a variety of themes, hard assignment of documents to clusters leads to inferior generalization results. Topic modeling solves this problem and allows clear thematic separation by probabilistic assignment of documents to topics [37]. Latent Dirichlet Allocation (LDA) nowadays is a widely used topic
modeling technique that was introduced by Blei, Ng and Jordan 2003 [39] including a detailed description of the algorithm.
Perplexity is a measure frequently being used in natural language processing
for model evaluation. It is the determined by the model’s ability to generalize the underlying structure of a training corpus. The measure is particularly based on the logarithmic probability of a word wd divided by the total number of words Nd
The lower the obtained perplexity value, the better the generalization-capability of the tested model [39] [40].
perplexity(M) = exp ( − PM d=1logp(wd) PM d=1Nd ) (2)
2.3 Geospatial information in social media platforms
This section describes the different aspects of social media as a source of geographically referenced information. It discusses the general characteristics of crowdsourced data and its applications for mapping. Also, the representativeness of social media as a basis for mobility-related findings is evaluated and typical interaction patterns are discussed regarding popularity and location-based func-tionalities.
2.3.1 Characteristics of volunteered geographic information
Traditionally, geographic maps have been generated by professionals using high-end tools. This typically involves governmental action and significant in-vestments. In fact, the scope of data collection initiatives is often limited and aggregated data is typically not directly accessible for the public. Moreover, a fragmented data collection scope in terms of attributes, units and quality make it difficult to integrate locally sourced governmental data. Multiple open data initiatives, such as the platformGovData in Germany, aim at providing public
ac-cess of authoritative information in easily exchangeable formats. With only about 6000 documents provided in the geographic platform section as of April 2017, no sufficient coverage is reached [41].
Simultaneously, crowdsourced volunteered geographic information (VGI)
re-ceives growing attention. As mapping is conducted by a large number of volunteers that contribute to an open database, the collection of data is very scalable and
works with consistent data formats. However, the involvement of large numbers of volunteers makes VGI prune to special quality characteristics that are discussed in the following paragraphs:
Quality distribution Especially in highly populated areas, a better over-all data accuracy is achieved [42]. It was found that the number of voluntary contributors increases disproportionately in urban areas [43].
Shifted quality assurance While traditional mapping procedures rely on quality control by experts who create the map, VGI data errors are generally only recognized by other contributors or the users of generated content [44].
Proximity focusThe quality of mapped data depends on the local knowledge of the contributor, especially if the mapping process is highly manual. One example would be the biased creation of map data from aerial or satellite imagery if image errors are present or important sections are hidden by trees. Contributors tend to collect information for locations which are close to their usual habitation [43].
Limited trainingGeographic data being collected by volunteers is in general less reliable than mapping completed by contracted professionals [44]. Depending on the intensity of training and the mapping experience, the quality of results can be varied.
Representativeness Characteristics and perceptions of contributors do not necessarily represent the society as a whole. Certain information might be exag-gerated or neglected depending on which aspects are perceived to be important by the contributors. Additionally, only a small share of the total number of VGI platform users contributes information on a regular basis [45]. Budhathoki 2010 [46] analyzed the activity distribution of an open mapping platform and found only 0.01% of the registered users to be very active while 70% did not contribute.
indi-vidual actions taken to worsen the quality of collected data can potentially take place. Due to the shift towards quality assurance by other contributors or final users, malicious data can be active in the database for a varied amount of time [42]. VGI platforms, for this reason, typically introduce contributor rankings that grant more autonomy for experienced users than for recently registered ones.
These quality characteristics need to be taken into account when using VGI for further analysis. Recent research addresses the development of semantic frame-works to evaluate the quality of user-generated map content [47] [48].
Social Media Geographic Information is a subgroup of VGI, which originates
from social media platforms and is prune to special characteristics. In comparison to initiatives with the main purpose of collecting data, the information collected in social media mainly consists of byproducts related to communication-focused activity. Place entities are generated mainly based on location check-ins or in the course of users expressing their thoughts towards place-related topics on the platform. Therefore, the collected information is a direct representation of the users’ interests [49]. This increases the severity of the previously introduced issue of information representativeness. With regards to the literature, there have been no in-depth social media studies of this aspect focusing on geographical data con-tained. Campagna 2016 [49] emphasizes that ’a novel analytics is to be formalized for the peculiar data models which make this type of information different from more traditional vector spatial datasets’ (p.49). The authors recommend consid-ering the spatial, temporal and a contextual dimension of the available data. Also, the value of multimedia contents is emphasized for analysis.
2.3.2 Mobility characteristics of social media users
In Germany, about 89% of all people have access and also regularly use the internet [50]. About 50% of all citizens use social media platforms [51] while
Facebook alone counts 37.9 million users in 2017 [52]. This reflects about 41% of all internet users in the country [53]. Social media sites show a steady growth over the last years of about 14% annual increase in user counts [50].
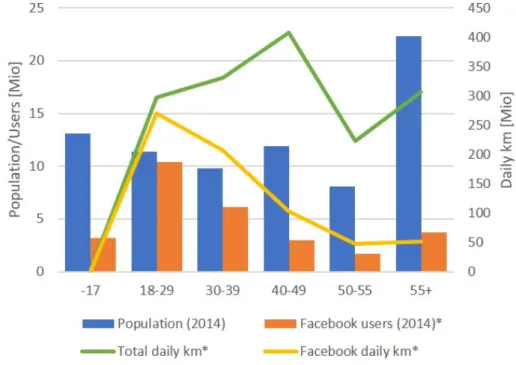
Figure 6 shows the population in Germany as of 2014 per age group and compares the user count of Facebook. For people between the age of 18 and 29, more than 91% of all individuals are active Facebook users. For the age group of 55 years and older, only about 17% of all people are represented on the platform. Data from different statistical travel surveys is combined to estimate the age-specific mobility demand particularly with regards to car usage. Based on the user penetration for Facebook, the total distance traveled daily by Facebook users as car drivers is calculated.
Figure 6. Mobility-specific representativeness of Facebook [54] [55] [56] [57]
The average daily travel distance per person in Germany amounted to 45 km in 2014 [56]. This mean is adjusted to age-specific values that range from about
between 30 and 39 years [57]. Subsequently, the share of distance traveled while driving a car [56] is multiplied with the age-group-specific population [54] and the daily distance traveled to obtain the total daily distance traveled by car. Using the Facebook user count instead of the population value leads to the estimate for the total distance traveled by Facebook users in Germany. Summing up, about 680 million km out of roughly 1,570 million km daily driving distance are caused by Facebook users which represents a share of about 43%.
The social media penetration is not homogeneous among all parts of Germany. The highest share is found in the state ’Saarland’ with 88% of all people having social media accounts and the lowest share represents ’Thüringen’ with 64% [58]. On a global scale, 56% of all Facebook users are male while the strongest gender difference is found in the age range of 18 and 34 [59]. Females are found to use Facebook more intensively while spending more time on the platform [60]. The respective data sources do not account for genders other than male and female. Furthermore, social media usage is observed to be independent from monetary income [61].
2.3.3 Interaction characteristics of social media users
To understand the offline mobility behavior of Facebook users, it is neces-sary to understand their motivation for online interaction with POIs and events. Unfortunately, this particular connection has not been sufficiently researched. A comprehensive literature review in 2012 by Wilson, Gosling and Graham [62] found that no research has been conducted regarding the behavioral drivers for user likes in general and particularly related to POIs and events.
With particular focus on humanitarian causes for likes, Brandtzaeg and Haugstveit 2014 [63] found this feature to be used mainly in the context of so-cially responsible liking. This concept describes the general willingness to support
humanitarian organizations. Likes as an intermediate emotional reaction to the observed content were the second most frequent cause while the future access to further information was the third most frequent motivation. However, using the like feature is mainly seen a method for self-representation.
With regards to likes for company-representations on Facebook, access to in-formation was found to be the main motivation for user likes. Moreover, access to special offers and other promotions were observed to drive user interaction. Show-ing support for the business to other users was also identified to be an important factor [64]. Further surveys confirmed these findings for brand representations [65]. Regarding location check-ins, Patil et al. 2012 [66] found users on Foursquare to share information mainly for self-presentation and access to certain social circles. Check-ins are regarded as a symbol of acknowledgment for a POI that helps support the user in being part of his or her social group. Thus, the motivation for online check-ins is explicable primarily with social and personal objectives while sharing the actual location is only a subordinate purpose [67]. Besides, it was highlighted that users may check-in to receive special offers limited to a certain geographic area [68].
2.4 Modal split in Germany
In Germany, about 3.4 billion kilometers were traveled per daily average for passenger transport in 2016 [69]. 80.1% of this were conducted by means of motor-ized private transportation. The rail sector was responsible for 7.8%, public road transport for 6.8% and air travel for 5.3% [70]. Considering data for the years 2005 to 2010, the car usage in Germany is about 4.6% higher than the European average of 75.6% (EU-27) [71]. 44% of all car owners use their vehicles on a daily basis while 32% use it at least several times per week. About 82% of all households have access to one or more cars while an average household has access to 1.4 cars [72].
The latter increases with the accessible income and only one percent of households with a monthly income of more than EUR 5,000 own no cars [57]. In average over all regions in Germany for 2016, 668 cars existed per 1,000 citizens [69].
Figure 7 provides an overview on the usage of transport means organized by different travel purposes. It is distinguished between mobility by foot, per bike, as car passenger, as car driver or via means of public transportation. The distribution of traffic generated by the presented modes is added as a line chart. All indicators are based on the assessment of traffic intensity as the total distance traveled while all numbers given represent shares on a percentage basis.
Figure 7. Modal split in Germany by travel purpose 2008 [57]
Leisure activities are responsible for the biggest share of traffic with regards to four out of five distinguished travel modes. Only for work-related trips, traveling by driving a vehicle is more popular. This travel mode makes up 58% of all traffic while traveling as a passenger is related to a share of 24% on the total distance traveled. Shopping trips are almost evenly popular with regards to all travel modes but public transport. The latter is especially popular for education-related travel.
The category ’private errands’ sums up all activities that do not fit in any other group.
Among different age groups, there are also meaningful differences with regards to the means of travel chosen by individuals. Figure 8 distinguishes between eight age groups and the previously presented travel mode schema. While the distance traveled by other means of traffic, especially by foot, decreases until the age of 40-49 years, the importance of car travel rapidly increases. About 59 percent of all traffic created by individuals in this age group is caused by motorized vehicles. This correlates with the share of individuals who have car access being presented as a line chart. The required age for obtaining a driver’s license in Germany is 18 years while accompanied driving can be done at the age of 17. This is why a very small share of distance traveled in driver role is conducted for this age group. Elderly people tend to reduce active driving and do most trips walking. This shift is supported by a decrease of the average trip length by about 50% in between the age groups 40 to 59 years and over 75 years [57].
CHAPTER 3 Literature review
In this chapter, the state of the art in parking demand modeling is evaluated with focus on potentially relevant influence factors. Particularly, the impact of POIs and public events is analyzed in surrounding areas of parking spots. Also, a general summary of modeling activities with regards to travel mode choices and specifically, car usage.
3.1 Modal split modeling
In developed countries, people typically have the opportunity to choose from different travel mode options. The contributing factors that lead to a certain choice of mode alternative have been intensively studied in various countries. Mainly based on traveler surveys, researchers have distinguished macroscopic and micro-scopic influences. Macromicro-scopic factors describe the overall setting where the mode choice is made and cover superordinate socio-economic and structural aspects. Mi-croscopic influences relate to the traveler as an individual and the specifications of the planned travel. Factors such as age, income level or cost of mobility are covered as part of this subgroup [73] [74]. Figure 9 summarizes relevant influ-ence factors in accordance with three new categories. It is distinguished between factors that are based on the characteristics of the decision maker and attributes of the specific trip made. Also, determinants related to the parking situation at the trip destination and factors considering travel mode alternatives, in particular public transport, have been emphasized in the literature. The provided collection of factors represents the intersecting set of findings derived from various studies in different countries. The annotated arrows indicate correlations between the respective factors and the stated preference of car usage as travel mode.
Figure 9. Relevant influence factors on the preference of car-related travel Ding and Zhang 2016 [74] assumed that each individual chooses the preferred travel mode based on a maximization of perceived utility. As travel mode alterna-tives, respondents were asked to pick either public transport or car usage. Cluster-ing algorithms were applied to form groups of respondents with similar individual characteristics. Gender, occupation, income and car ownership were considered as decisive factors. Ultimately, a set of generalized findings was derived from the obtained data using a multinomial logistic regression model. It was found that in-dividuals with higher income tend to choose cars over public transport mainly for reasons of comfort. Respectively, travelers with comparably low income preferred to choose means of public transit. Moreover, even though long traveling times are perceived negatively, car travel was found to be generally more accepted.
Weis et al. 2011 [75] conducted a travel mode survey in Switzerland, indicating a significant effect of parking area characteristics on the travel mode. As a decision variable, the perceived utility of parking areas was used. It was found that males tend to use cars as the preferred mode of choice more frequently. Individuals
with higher income showed less consideration of fuel prices and costs of parking. However, in general, costs of parking were found to be a highly relevant factor. Car accessibility had a positive effect on car usage in general while the necessary time for finding an available parking spot was perceived highly negative. In particular for short travels, the time spent searching and the monetary costs of parking were found to be important. Moreover, owners of public transport passes show a general preference for avoiding car usage while the particular travel is relevant for the decision making process. If many changes of public transport means are necessary or if significant waiting time is involved, this decreases the perceived mode utility. Finally, the authors point out that car usage is typically connected to time savings compared to alternative travel modes. The required duration of mode-specific travel, in fact, is another relevant decision factor.
Braun Kohlova 2016 [76] conducted travel studies for several cities in the Czech Republic. Focusing on travel mode utilities, tendencies towards car usage for males with high personal income and a superior work position were identified. Also, variables describing psychometric preferences towards certain lifestyles were found to be influential. The study included questions regarding the importance of travel accessibility and indicated preferences for short distances in a city lifestyle. Clark, Chatterjee and Melia 2016 [77] find ecological awareness to be an important influence factor that reduces the likelihood of car usage. Moreover, commuting dis-tance, the residential context and the availability of vehicles within the household were identified to be relevant.
Badland et al. 2010 [78] examined work-related travel behavior in New Zealand and found trip convenience and travel mode accessibility to be crucial influences. Moreover, the availability and cost of free car parking, traffic intensity and the convenience of alternative travel modes, in particular public transport,
were identified to have significant influence on the mode choice.
Furthermore, several studies have considered individuals’ age when making travel mode choices. In most cases, it is implied that car usage is highly important for elderly in different countries [73] [79] [80] [77]. Böcker, Van Amen and Helbich 2016 [81] find elderly to rely on other modes of transport for the use case of the Rotterdam city area. The study compares a reference group to the behavior of the elderly. It is found that the spatial context of the planned travel also has an important effect. If the trip is set within a very dense urban environment, cars are less likelier to be chosen. The preference for car travel also positively correlates with the household size and the number of vehicles available. Moreover, it was found that individuals who showed certain preferences in the past are likely to continue making similar choices in the future [80].
Adverse weather conditions also have an empirically-proven effect on traffic patterns. Drivers tend to cancel or postpone trips, change routes, run errands preferably nearby and choose public transport instead of car travel if road con-gestion is present [82]. Rainfall is found to decrease car traveling speeds and the overall traffic volume. The corresponding effects for snow are similar but intensi-fied [83] [84]. Winds and low temperatures are found to increase car and public transport travel [85]. Besides, Cools, Moons and Wets 2010 [86] highlight that the influence of certain factor combinations varies among different locations. This is ex-plained by varying travel motives, for example those related to roads used mainly for leisure or alternatively commuting. While leisure is a rather flexible travel context where weather is an important influence, work-related travel is rather in-flexible [85]. With specific regards to parking, low temperatures and rainfall were identified to increase the likelihood of drivers to choose off-street parking instead of on-street alternatives. The presence of snow, on the other hand, did not have a
significant influence [87].
Yue, Cheng, Tai 2009 modeled the choice of travel modes related to urban events in accordance with a combination of socio-demographic and travel-specific attributes. The event popularity and resulting traffic demand were assumed to be known based on historical experience of the organizers [88]. This assumption is reasonable for recurrent events in established settings where a sufficient amount of data is available. The popularity of one-time events and non-commercial meetings is much harder to estimate. In fact, the study results are limited to events with required registration or ticket purchase.
Papacharalampous et al. 2015 [89] studied the modal split for big events in the city of Amsterdam. Pedestrian flows during an exemplary set of events were analyzed to calculate the share of visitors traveling with different travel modes. It was found that 74% of the visitors arrived by car with a person-per-car ratio of about 3.5. This extraordinary importance of automobile travel is interpreted as a result of the events’ attractiveness to long-distance travelers and the convenient accessibility of the venue by car. Attendees have certain expectations regarding the expected parking search time at the destination and this factor does have an impact on the observed parking demand. As another factor, long-distance public transport in the case study offered comparably high group fares and limited traveling options after the considered events finished. This is interpreted as a secondary reason for the high car usage ratio.
No research focusing on smaller events, especially populated with social media data, has been conducted. Moreover, no findings are available that try to quantify the relevancy of interesting place characteristics for travel mode choices. As de-scribed above, the most present geographic level of detail being applied in current studies only aims at a regional perception.
![Figure 5. General checklist for feature engineering; based on [26]](https://thumb-us.123doks.com/thumbv2/123dok_us/9003371.2798117/31.918.176.802.126.518/figure-general-checklist-feature-engineering-based.webp)
![Figure 9. Relevant influence factors on the preference of car-related travel Ding and Zhang 2016 [74] assumed that each individual chooses the preferred travel mode based on a maximization of perceived utility](https://thumb-us.123doks.com/thumbv2/123dok_us/9003371.2798117/45.918.218.749.122.443/figure-relevant-influence-preference-individual-preferred-maximization-perceived.webp)