Repositório ISCTE-IUL
Deposited in Repositório ISCTE-IUL:
2018-01-08Deposited version:
Post-printPeer-review status of attached file:
Peer-reviewedCitation for published item:
e Silva, E. C., Borges, A., Teodoro, M. F., Andrade, M. A. P. & Covas, R. (2017). Time series data mining for energy prices forecasting: an application to real data. In Novais P.,Madureira A.-M.,Abraham A.,Gamboa D. (Ed.), Advances in Intelligent Systems and Computing. (pp. 649-658). Porto: Springer.
Further information on publisher's website:
10.1007/978-3-319-53480-0_64Publisher's copyright statement:
This is the peer reviewed version of the following article: e Silva, E. C., Borges, A., Teodoro, M. F., Andrade, M. A. P. & Covas, R. (2017). Time series data mining for energy prices forecasting: an application to real data. In Novais P.,Madureira A.-M.,Abraham A.,Gamboa D. (Ed.), Advances in Intelligent Systems and Computing. (pp. 649-658). Porto: Springer., which has been published in final form at https://dx.doi.org/10.1007/978-3-319-53480-0_64. This article may be used for non-commercial purposes in accordance with the Publisher's Terms and Conditions for self-archiving.
Use policy
Creative Commons CC BY 4.0
The full-text may be used and/or reproduced, and given to third parties in any format or medium, without prior permission or charge, for personal research or study, educational, or not-for-profit purposes provided that:
• a full bibliographic reference is made to the original source • a link is made to the metadata record in the Repository • the full-text is not changed in any way
The full-text must not be sold in any format or medium without the formal permission of the copyright holders.
Serviços de Informação e Documentação, Instituto Universitário de Lisboa (ISCTE-IUL) Av. das Forças Armadas, Edifício II, 1649-026 Lisboa Portugal
Phone: +(351) 217 903 024 | e-mail: [email protected] https://repositorio.iscte-iul.pt
Time Series Data Mining for Energy Prices
Forecasting: An application to real data
Eliana Costa e Silva1,2, Ana Borges1, M. Filomena Teodoro3,4,
Marina A. P. Andrade5, and Ricardo Covas6,7
1 CIICESI/ESTG - P.Porto, Margaride 4610-156 Felgueiras, Portugal, [email protected],[email protected]
2 Centro Algoritmi, University of Minho, 4800-058 Guimares, Portugal 3
CINAV, Escola Naval - Marinha, 2810-001 Almada, Portugal
4 CEMAT - CEMAT, Center for Computational and Stochastic Mathematics,
Instituto Superior T´ecnico, Universidade de Lisboa, 1048-001 Lisboa, Portugal
5
ISCTE-IUL/UNIDE, 1649-026, Lisboa, Portugal
6
CMA - Centro de Matem´atica e Aplica¸c˜oes, Universidade Nova de Lisboa, 2829-516 Caparica, Portugal
7 EDP - Energias de Portugal, 1249 300 Lisboa, Portugal
Abstract. Recently, at the 119th European Study Group with Indus-try, the Energy Solutions Operator EDP proposed a challenge concern-ing electricity prices simulation, not only for risk measures purposes but also for scenario analysis in terms of pricing and strategy. The main pur-pose was short-term Electricity Price Forecasting (EPF). This analysis is contextualized in the study of time series behavior, in particular multi-variate time series, which is considered one of the current challenges in data mining. In this work a short-term EPF analysis making use of vec-tor auvec-toregressive models (VAR) with exogenous variables is proposed. The results show that the multivariate approach using VAR, with the season of the year and the type of day as exogenous variables, yield a model that explains the intra-day and intra-hour dynamics of the hourly prices.
Keywords: Data mining, multivariate time series, vector autoregressive models, electricity prices forecasting
1
Introduction
Due to the unique behavior of time series data, the existing research is still con-sidered inadequate and one of the 10 challenges in data mining [12]. In particular, the discovery of interesting patterns, also called motif discovery, is non-trivial and has become one of the most important tasks in data mining. In fact, motif discovery can be applied to many domains [4].
Under the 109th European Study Group with Industry (ESGI)8, the company
EDP - Energias de Portugal submitted the mathematical challenge of simulating 8
electricity prices not only for risk measures purposes but also for scenario analysis in terms of pricing and strategy. EDP Group is an Energy Solutions Operator which operates in the business areas of generation, supply and distribution of electricity, and supply and distribution of gas. EDP with nearly 14 000 MW9
of installed capacity in the Iberian Electricity Market – MIBEL10, is the only
company in the Iberian Peninsula with generation, distribution and supply (both electricity and gas) activities in Portugal and Spain.
A large number of methods have been proposed to deal with Electricity Price Forecasting (EPF). In [11] Weron presents, in an exhaustive review article, the complexity of the available methods, revealing their strengths and weaknesses. Weron reduces the existing methods into five major categories: (i) multi-agent models, (ii) fundamental models, (iii) reduced-form models, (iv) statistical mod-els and (v) computational intelligence modmod-els. The frontier between these cate-gories is not always clear. For instance, there are several statistical methods that are classified as computational intelligent models. In this paper we contribute with a statistical approach to data mining procedure in the context of EPF.
Most of the EPF approaches consist in methods that forecast the current electricity price by using a mathematical combination of the previous prices and/or previous or current values of exogenous factors, such as consumption and production figures, or weather variables (see [11] for further detail).
Statistical EPF models are mainly inspired from economics literature (for example, game theory models and time-series econometric models). Murthy et. al., in [7], present an extremely relevant summary of selected finance and econo-metrics inspired literature on spot electricity price forecasting (see Table 3 in [7]).
Conejo et. al [2] make use of time series analysis, along with neural networks and wavelets, to predict the 24 market-clearing prices of a day-ahead electric energy market. They clarify that time series techniques, which are a relevant part of the statistical models approach to this king of problems, revealed themselves through many realistic studies as the most efficacious tools for day-ahead market clearing price forecasting.
Synthesizing, in EPF, and confining this study mainly to short term price forecasting, the following models are widely used: the univariate AutoRegressive model (AR); the AutoRegressive Moving Average model (ARMA) – a standard time series model that takes into account the random nature and time corre-lations of the phenomenon under study; the AutoRegressive Integrated Moving Average (ARIMA) – an extension of ARMA that enables a transformation of the series to the stationary form; or even the seasonal ARIMA model (SARIMA) that captures a possible existence of seasonality. The forecasting of ARMA-type models can be conducted via the Durbin-Levinson algorithm or the innovations algorithm, or by using the Kalman filter for models specified in state space form. As electricity prices can be influenced by the present and past values of various exogenous factors, such as generation capacity, load profiles and ambient weather
9
2012 update and excluding wind power
10
conditions [11], extensions of the previous mentioned time series models with ex-ogenous or input variables such as ARX, ARMAX, ARIMAX and SARIMAX are used (see e.g. [10] for an excellent manual in Time Series Analysis).
Reported works have already been developed on electricity price forecasting, applying statistical techniques concerning the Portuguese and Spanish electric-ity market - the market operated by the group EDP. For example, [3] provides a method to predict next-day electricity prices of mainland Spain market based on the ARIMA methodology. Also, [6] apply forecasting factor models to the mar-ket framework in Spain and Portugal. More recently, [8] proposes an enhanced hybrid approach composed of an innovative combination of wavelet transform, differential evolutionary particle swarm optimization, and an adaptive neuro-fuzzy inference system to forecast short-term electricity market prices signals in different electricity markets (and also wind power) in Portugal.
In an energy market, the production units are dispatched by considering the bid offers that each agent made for energy. There is not a “consumption” concept “as is”. Instead, there are “ask offers” for energy that are made and that are fulfilled only if the price is met. A day-ahead market consists in a system where agents submit their bids and offers for the delivery of electricity during each hour of the next day before a certain market closing time [11].
EPF literature has mainly concerned on models that use information at daily level, however the present analysis is interested in forecasting intra-day prices using hourly data (disaggregated data), and therefore, it is necessary to consider models that explore the complex dependence structure of the multivariate price series. For that, a vector autoregressive structure (VAR) approach has been recently proposed [11].
This paper is organized as follows: Section 2 presents the problem statement and a summarized description of the database; Section 3 explains the method-ology and exposes the main results; finally in Section 4 conclusions are drawn and suggestions for future work are pointed.
2
Problem Statement and Database
The daily market electricity prices can be given as a strip of prices (one for each hour of the day), all simultaneously observed once at a given time of each day:
Yt= [y1t, y2t, . . . , ynt], n= 1, . . . ,24 (or 23 or 25), t= 1,2, . . . .
Therefore, the daily market prices can be interpreted as a multivariate time series. Figure 1 presents the hourly prices for the 31 days of January 2016. This figure suggests a common pattern among the different hours of the day.
The data that will be analyzed in this work consists of disaggregated data, i.e., hourly prices and average day price, from January 2008 to June 2016, in a to-tal 3102×24 observations (see Figure 2). Particularity, in the present study, data corresponding to the hourly prices from 01/01/2014 to 28/06/2016 is analyzed. Figure 3 shows the MIBEL daily prices of the 24 hours from 01/01/2014 to 28/06/2016, in a total of 21837 (=910×24−3) observations. Days 30/03/2014,
Fig. 1.On the left, MIBEL prices from January 2016. On the right, 10th up to 90th
percentiles MIBEL hourly prices divided by price average of each day.
Fig. 2.Hourly prices for the period from January 2008 to June 2016(data provided by EDP during the 119th ESGI).
Fig. 3.MIBEL hourly prices for each of the 24 hours from 01/01/2014 to 28/06/2016 (data provided by EDP during the 119th ESGI).
29/03/2015 and 27/03/2016 only presented 23 legal hours, therefore, these mis-sing values were filled with the previous hour price value, with the assumption that the current data will be similar to the previous ones (see also [1]). Fur-thermore, there were several zero hourly prices in the first observations of this time series, more precisely on the first 68 days in 2014. For this reason, the
observations for those first 68 days were removed, remaining a total of 20205 observations, that were considered in the present analysis.
3
Model Estimation and Forecast
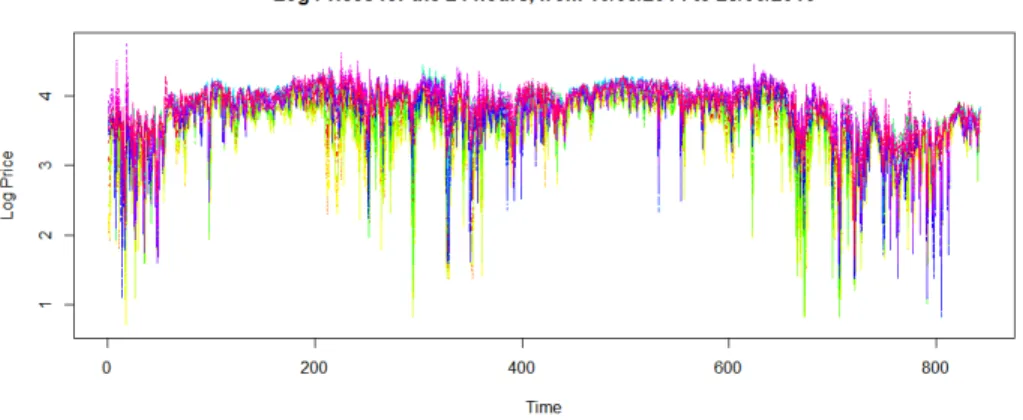
In this Section a multivariate time series approach is applied to the data corres-ponding to the hourly prices from 10/03/2014 to 28/06/2016. The data analysis was performed using RStudio (version 0.99.9902) and R Statistical Software (version 3.3.0)[9].
Fig. 4. MIBEL Log hourly prices for each of the 24 hours from 10/03/2014 to 28/06/2016(data provided by EDP during the 119th ESGI).
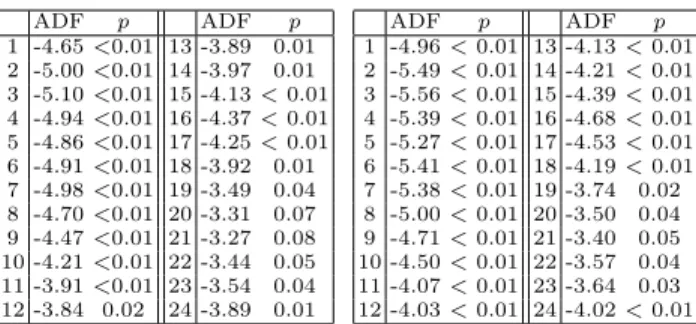
For stabilizing the variance the log transformation was applied (see Figure 4). The existence of linear dynamic dependence in the data is supported by the mul-tivariate LjungBox test (not presented here for simplicity). For the Augmented Dickey-Fuller Test one may assume that the time series are stationary (see Ta-ble 1).
In order to explore the intra-day correlation structure, the hourly spot prices,
Yt= (Y1,t, . . . , Y24,t)>, can be represented as a Vector Autoregressive model of
orderp, VAR(p) [10]: Yt=φ0+ p X i=1 ΦiYt−i+at, (1)
where φ0 denotes the constant vector,Φi are 24×24 matrices of autoregressive
parameters andatthe residuals. This approach allows to model the hourly spot
prices jointly, capturing the correlation between the hourly price, as has been reported in previous studies (see e.g. [11]). The drawback is that it requires the estimation of 24×(24×p+ 1).
ADF p ADF p 1 -4.65<0.01 13 -3.89 0.01 2 -5.00<0.01 14 -3.97 0.01 3 -5.10<0.01 15 -4.13<0.01 4 -4.94<0.01 16 -4.37<0.01 5 -4.86<0.01 17 -4.25<0.01 6 -4.91<0.01 18 -3.92 0.01 7 -4.98<0.01 19 -3.49 0.04 8 -4.70<0.01 20 -3.31 0.07 9 -4.47<0.01 21 -3.27 0.08 10 -4.21<0.01 22 -3.44 0.05 11 -3.91<0.01 23 -3.54 0.04 12 -3.84 0.02 24 -3.89 0.01 ADF p ADF p 1 -4.96<0.01 13 -4.13<0.01 2 -5.49<0.01 14 -4.21<0.01 3 -5.56<0.01 15 -4.39<0.01 4 -5.39<0.01 16 -4.68<0.01 5 -5.27<0.01 17 -4.53<0.01 6 -5.41<0.01 18 -4.19<0.01 7 -5.38<0.01 19 -3.74 0.02 8 -5.00<0.01 20 -3.50 0.04 9 -4.71<0.01 21 -3.40 0.05 10 -4.50<0.01 22 -3.57 0.04 11 -4.07<0.01 23 -3.64 0.03 12 -4.03<0.01 24 -4.02<0.01
Table 1.Results for the stationarity tests without the logarithm transformation (on the left) and after the transformation (on the right). Recall that for the Augmented Dickey-Fuller the alternative hypothesis is stationarity.
To capture the seasonal pattern of the process mean, exogenous variables,
X, were added yielding a VARX model (see e.g. [10]). The general form of a VARX of orderspandsis:
Yt=φ0+ p X i=1 ΦiYt−i+ s X j=0 βjXt−j+at. (2)
A similar but simpler model, with p = 7, was presented by [5], since Φi
were considered as diagonal matrices. In that work the authors use a dummy representing the day type (working day vs. weekend) and the number of daylight hours (in order to mimic the annual seasonality).
In the present analysis, two exogenous variables are considered: i) day type (working day vs. weekend) and ii) the annual seasons defined in terms of me-teorological conditions11. A VARX(7,0) was estimated using hourly prices Y
kt,
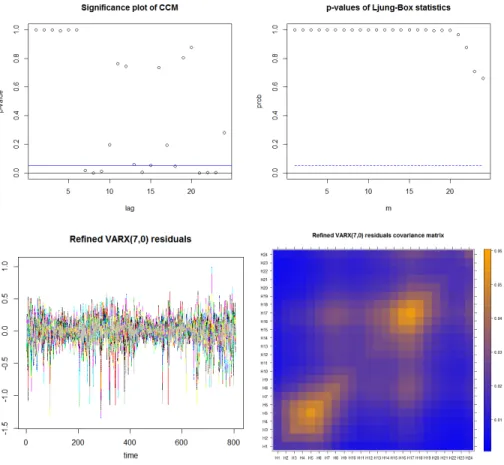
k= 1, . . . ,24, from 10/03/2014 to 29/05/2016, in a total of 19461(= 811×24−3) observations. Note thatp= 7 is chosen in several of the EPF studies presented in literature [11]. The prices from 30/05 to 28/06/2016 were used for comparison between the real hourly prices and the forecast of the VARX(7,0) model. A total of 4104 (= 24 + 24×24×7 + 24×2) parameters were estimated using functions provided by theMTSpackage from R. The full model was reduced by removing simultaneously all estimates witht-ratio less than 0.5. Figure 5 suggests the ad-equacy of the model. The p-values of the Ljung-Box statistics are all>0.05, and therefore the null hypothesis of zero cross-correlations is not rejected.
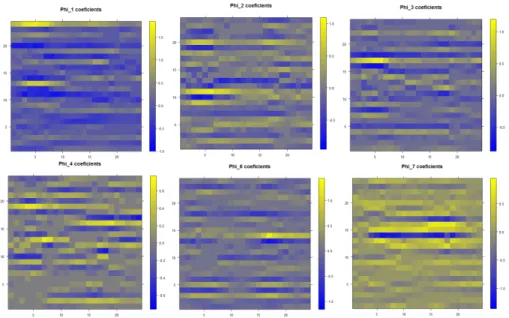
The autoregressive coefficients of the VARX(7,0) explain the existence (or not) of dependence within the hourly prices. The element (k, j) withk 6=j of theΦi matrices shows the linear dependence ofYkt onYj,t−i in the presence of
Yk,t−1. Figure 6 shows that there are several non-diagonal elements ofΦithat are
nonzero, therefore there are several hourly prices that are dynamically correlated to prices of other hours in previous days (yellow colour).
11
Fig. 5.VARX(7,0) residual analysis.
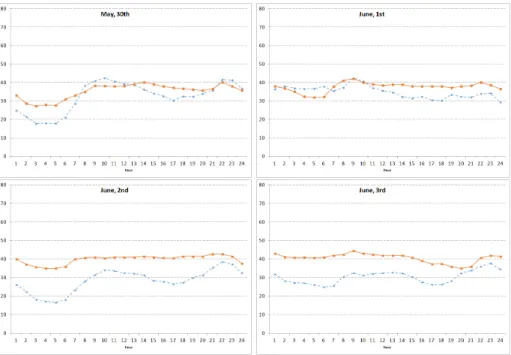
For evaluating the point forecasts the root mean square errors (RMSE) was used. According to [11] this is perhaps the most popular measure for this purpose. Figure 7 presents the RMSE for the 30 days forecast. The forecasts were obtained from a VARX(7,0) estimated using log of the hourly prices. These forecasts were then transform back by applying exp. As an example, in Figure 8 the real hourly prices and forecasts for the first four days are depicted.
4
Conclusions and Future Work
The challenge proposed by EDP consisted in simulating electricity prices, not only for risk measures purposes, but also for scenario analysis in terms of pricing and strategy. Data provided by EDP, concerning hourly electricity prices from 2014 to 2016, was analysed making use of the VAR methodology.
Fig. 6.Autoregressive coefficients of the VARX(7,0). For simplicity the coefficients of
Φ5 were omitted.
Fig. 7.RMSE for the forecasts from 30/05 to 28/06 using the reduced VARX(7,0).
The multivariate VAR approach, considering as exogenous variables the me-teorological seasons and the type of day, yield a model that explains the intra-day and intra-hour dynamics of the hourly prices.
Although the forecast does not exactly replicate the real price they are quite similar. For instance, the introduction into the model of exogenous variables that better explain the meteorological conditions could improve the model estimates. Moreover, further analysis of the orders of the VARX should be performed.
Nowadays data mining approaches to such type of data, consisting in multiple large time series, adopts mainly neural network approaches [4], [11]. The analysis
Fig. 8. Real (orange full line) and forecast (blue dot line) hourly prices using VARX(7,0).
here presented aims to contribute with a statistical approach to data mining methodology, particularly in the context of EPF.
Note that, as previously stated, there are several other statistical approaches that can be applied, such as univariate time series analysis. However, several authors that presented models using different univariate approaches, failed in presenting, for example, a diagnostic analysis and selection of the order of the models. Also, to our knowledge, longitudinal modelling has not yet been ad-dressed in EPF, and is an approach that we consider that deserves further at-tention, if we group identical hourly time series, and thus consider the groups of hourly time series independent.
In conclusions, EPF is a growing area that groups different approaches that can be applied. In fact, other approaches from multi-agent models, fundamental models, reduced-form models and computational intelligence models, such as the statistical approach here presented, should be openly consider for EPF.
Acknowledgments. This work was partially support by ESGI 119 – an ini-tiative supported by COST Action TD1409, Mathematics for Industry Network (MI-NET), COST is supported by the EU Framework Programme Horizon 2020. E. Costa e Silva and A. Borges were supported by Center for Research and Innovation in Business Sciences and Information Systems (CIICESI), ESTG
-P.Porto. M.F. Teodoro was supported by Portuguese funds through the Cen-ter for Computational and Stochastic Mathematics (CEMAT),The Portuguese Foundation for Science and Technology (FCT), University of Lisbon, Portugal, project UID/Multi/04621/2013, andCenter of Naval Research (CINAV), Naval Academy, Portuguese Navy, Portugal.
References
1. P. Chujai, N. Kerdprasop, and K. Kerdprasop. Time series analysis of household electric consumption with ARIMA and ARMA models. In Proc. IMECS Conf., Hong Kong, 2013.
2. A.J. Conejo, J. Contreras, R. Esp´ınola, and M.A. Plazas. Forecasting electricity prices for a day-ahead pool-based electric energy market. International Journal of Forecasting, 21(1):435–462, 2005.
3. J. Contreras, R. Esp´ınola, F.J. Nogales, and A.J. Conejo. ARIMA models to predict next-day electricity prices.IEEE Transactions on Power Systems, 18(3):1014–1020, 2003.
4. Tak-Chung Fu. A review on time series data mining. Engineering Applications of Artificial Intelligence, 24(1):164–181, 2011.
5. K. Maciejowska and R. Weron. Forecasting of daily electricity prices with factor models: utilizing intra-day and inter-zone relationships. Computational Statistics, 30(3):805–819, 2015.
6. M.P. Mu˜noz, C. Corchero, and F.J. Heredia. Improving electricity market price forecasting with factor models for the optimal generation bid. International Sta-tistical Review, 81(2):289–306, 2013.
7. G.G.P. Murthy, V. Sedidi, A.K. Panda, and B.N. Rath. Forecasting electricity prices in deregulated wholesale spot electricity market - A review. International Journal of Energy Economics and Policy, 4(1):32, 2014.
8. G.J. Os´orio, J. Gon¸calves, J. Lujano-Rojas, and J. Catal˜ao. Enhanced forecasting approach for electricity market prices and wind power data series in the short-term.
Energies, 9(693):1–19, 2016.
9. R Core Team. R: A Language and Environment for Statistical Computing. R Foundation for Statistical Computing, Vienna, Austria, 2016.
10. R. S. Tsay. Multivariate time series analysis: with R and financial applications. John Wiley & Sons, 2014.
11. R. Weron. Electricity price forecasting: A review of the state-of-the-art with a look into the future. International Journal of Forecasting, 30(4):1030–1081, 2014. 12. Qiang Yang and Xindong Wu. 10 challenging problems in data mining research.
International Journal of Information Technology & Decision Making, 5(04):597– 604, 2006.