Warehousing and Mining Web Logs
Karuna P Joshi, Anupam Joshi, Yelena Yesha
CSEE Department
University of Maryland, Baltimore County Baltimore, MD 21250, USA
+1 (410) 455-3500
{kjoshi1, ajoshi,yeyesha}@cs.umbc.edu
Raghu Krishnapuram
Dept of Mathematics and Computer Science Colorado School of Mines
Golden, CO 80401, USA +1 (303) 273-3877
[email protected]
ABSTRACT
Analyzing Web Logs for usage and access trends can not only provide important information to web site developers and administrators, but also help in creating adaptive web sites. While there are many existing tools that generate fixed reports from web logs, they typically do not allow ad-hoc analysis queries. Moreover, such tools cannot discover hidden patterns of access embedded in the access logs. We describe a relational OLAP (ROLAP) approach for creating a web-log warehouse. This is populated both from web logs, as well as the results of mining web logs. We also present a web based ad-hoc tool for analytic queries on the warehouse. We discuss the design criteria that influenced our choice of dimensions, facts and data granularity, and present the results from analyzing and mining the logs.
Keywords
Web Mining, clustering, user interface, ad hoc analysis, web logs.
1.
INTRODUCTION
Web mining can be viewed as the extraction of structure from an unlabeled, semi-structured data set containing the characteristics of users/information respectively [2]. The logs kept by web servers provide a classic example of such data. Analyzing and exploring regularities in the behavior of the users accessing a web site can improve system performance, enhance the quality and delivery of Internet information services to the end user, and identify population of potential customers for electronic commerce [1]. Many approaches have been suggested to mine information from web access log records collected from servers [3][4][5][8]. Typically data has to be scrubbed and preprocessed as a precursor to mining. Such data can also be stored in a data warehouse and be amenable to OLAP like queries. The objective of this paper is to outline a design used to create a ROALP warehouse from raw and mined web log. We also describe the web based analysis tool we have created that helps users in querying the warehouse in an ad-hoc manner.
Of late, new tools promising to apply data warehousing and mining techniques on web logs have entered the market. These include SurfAid & SpeedTracer from IBM, Bazaar Analyzer etc.
However, most of these tools do not really build a warehouse, and their notion of mining is limited for the most part to simple aggregate statistical analysis; with Speedtracer [17] being the exception (based on the tools publicity blurb, we assume that it uses the path traversal pattern mining work of Chen et al. [16]). For the most part, they continue the tradition of utilities such as AccessWatch and http-analyze. Such tools use Java, Perl scripts or shell scripts, to generate reports about web site utilization towards the analysis of Web log data. A listing of many such utilities can be found at [10]. Most of these tools generate canned reports about number of Kbytes transferred, access organized by domains etc. Their fixed reporting format does not help in analyzing log data from every perspective and customizing these reports requires essentially rewriting the utility. Moreover, these tools typically cannot discover hidden patterns of access embedded in the access logs.
Broadly speaking, 'Web Mining' has been defined as applying data mining techniques on web data to discover knowledge. However, the data that is actually mined is varied, and different approaches have been followed. Some researchers have applied mining techniques on the web logs maintained by the servers so as to discover user access and traversal patterns [1] [15][7][16][8]. In this paper, we have primarily concentrated on this research direction. Most of the research in this vein interprets web logs to be a semi-structured source of data that can be analyzed using existing mining techniques. In this approach, the aim is to discover the in-built relationships between the various attributes of the log like URLs, IP addresses etc. For instance, Han et al. [1] have mined information from web logs by implementing a MOLAP warehouse containing web log data and mining information off it. Krishnapuram et al. have developed new robust fuzzy clustering algorithms and used them on web logs, where as Shahabi et al. [15] have developed clustering algorithms for user navigation patterns. Other researchers have interpreted web logs essentially as text files and applied phrasal mining techniques to the logs [13][14].
2.
PREPROCESSING WEB LOGS
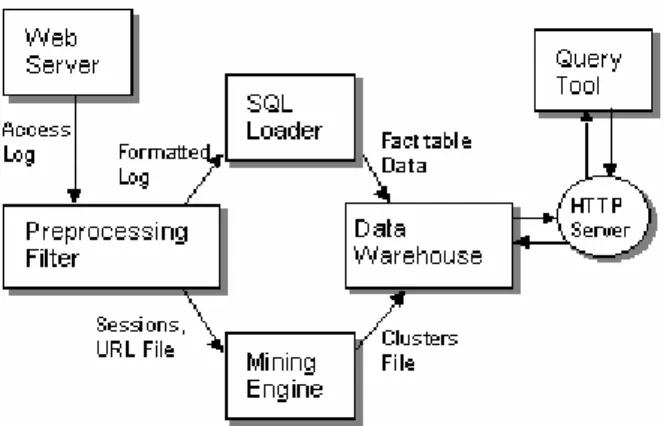
As a precursor to creating the warehouse, we need to clean our web log data. The format of the log data is not suited for import into the database (Oracle). Figure 1 is a pictorial representation of our system. Our warehouse consists of two components, the access log part that allows users to analyze the web logs and the mining part that allows users to analyze traversal patterns. In the preprocessing phase, we have created different files for populating the warehouse.
Figure 1: System Architecture Block Diagram.
In designing the access log warehouse, we included each log entry as a record in the warehouse, which was created in an Oracle 8 database using star schema. Before loading log entries into the warehouse, we reformatted them to confirm with the formats that Oracle SQL Loader accepts. This was done using a Perl script we created by modifying Follow [11]. Log structure was assumed to be that prescribed by the Common Log Format, {<domain> <identity> <authorization> <date> <method> <URL> <protocol> <status> <size returned>} and any entry not conforming to this structure was discarded. We also disregarded the identity and authorization attributes in the web log since they were not being logged. We have included log entries that resulted in errors or redirects in our analysis.
For the mining part, we filtered out other unwanted entries like record accesses to image files that were embedded in the web pages whose 'hit' had already been logged. For the preprocessing phase, we created a file listing all the sessions (described in the next section) obtained from the logs. The session file consists of Session number and the Domain of that session. A URL file was created that contained all the URLs in the web log that was analyzed and a unique number associated with the URL. Once the sessions were clustered as described in later sections, a cluster file listed each session and the cluster that it belongs to. Using the three files as our input, we proceeded to populate the warehouse for the mined data.
3.
DATA WAREHOUSE ARCHITECTURE
In a data warehouse Facts defined along with certain attributes (called dimensions) are the core data elements being analyzed. In this system, the web log entries are facts. Nasraoui et al have suggested the following dimensions [4]: Domain name of the request, date of the request, method of the request, URL of the page accessed, Result of the request, and Number of bytes transmitted.
The fact tables in the warehouse were directly created from the web logs. The web log data is analogous to the transactional data in an OLTP system and the main fact table was populated from it. This table contained all the log entries that were ever made in our web logs (Figure 2(b)). While such a table can answer any analysis query, aggregation queries (find how many queries resulted in a redirect) may take time. Based on some expected aggregation queries, other fact tables were created that contained data related to a specific aggregation criterion. For example, we created separate fact tables for each month of the log. If a user specified the month in the 'date accessed' field (see figure 4(a)), then the fact table corresponding to the month queried would be accessed.
As mentioned earlier, our web analysis does not build on an existing transactional database, since the web server uses a flat files to store its transactional data (accesses) without any normalization. Figure 2(a) illustrates the table structure for a corresponding normalized, relational database. It has "Dimension" tables for data such as Request status codes, request methods, Web protocols etc. The arrows indicate the relationships between dimensions. The dimension data is typically static and dependent on the domain. It also helps map "codes" relating to the HTTP protocol to their descriptions in an efficient manner.
In addition to the fact tables, a normalized schema was added to the warehouse to populate the mining results so as to facilitate on line analysis. Figure 3 represnts the Entity-Relationship diagram of this database which consists of three tables. The URL table stores the URL description along with the Unique ID (URL_NO) that is generated by the program. Session Table contains data pertaining to the Domain that identifies the session, the cluster number to which the session belongs and the frequency of the domain. Session-No is the unique identifier for each session. We know that many URLs (say N) can be accessed in a single session and also one URL can belong in multiple sessions (say N). To incorporate the N:N relationship between URLs and Sessions, we split the relationship into a 1:N relation by introducing a new table SES_URL table. This table contains the primary identifiers of both the Session and URL tables and is populated from the output from the clustering experiment.
Figure 3: Clustering Analysis Database Structure We have created three views to help in our analysis. Xi View displays the cardinality (total number of sessions) of each cluster obtained. Xij View displays each URL in the log along with Cluster number and the total number of sessions in the cluster that contain the URL (displayed by field Xij). The third view, Degree View, displays each URL in the log along with Cluster number, Xi value, Xij value and the Degree Measure, Xij/Xi. The Degree measure is the equation for Pij listed in above. The Degree view is the main view that we use for our analysis. It is also the view queried by the Web Interface. An additional view, ALL_VIEW, displays all the main fields in the tables and is also accessed by the Web Interface.
4.
MINING WEB LOGS
To mine knowledge from the web logs we used two data mining techniques, namely Clustering and Association Rules generation. For the data mining experiments, we collected a variety of logs and ran the association rules generator and clustering algorithm on it. Before mining information from the logs we created sessions from the logs. For discovering association rules, we used SGI's Mineset that implements a variation of the Apriori algorithm [9]. For Clustering we used the Fuzzy C-medoids algorithm developed by Krishnapuram et al [7]. This approach allows us to capture a graded (as opposed to binary) notion of similarity between sessions.
4.1
Session Generation
We now briefly describe the technique [5] to generate user sessions, after pre-processing the log files. Since web servers do not typically log usernames (unless identd is used), this technique defines a user session as accesses from the same IP address such that the duration of time elapsed between any two consecutive accesses in the session is within a prespecified threshold (in our case 45 minutes). This distinguishes it from other approaches such as [8] which assume that a user's identity is known. Each URL in the site is assigned a unique number j ∈ {1, ... ,|U|}, where |U| is the total number of valid URLs. Analogous to [5], the ith user session is encoded as an |U|-dimensional binary attribute
vector
s
(i)with the property) (i j
s
=
se otherwi 0 session ith in jth URL the accessed user if 1This schema will match one user's sessions into multiple user sessions. However, Krishnapuram et al argue that this will not affect the study if one is looking for 'typical user profiles'. Majority of a user's sessions follow a similar pattern, then clearly no difference is made. If the same user displays a few (different) access patterns on a site, this notion of multiple user sessions enables one to capture this behaviour.
4.2
Association Rules
To generate the association rules for the web logs, we first generated the sessions and URL files. MineSet requires two input files for generating the association rules - a schema file and a data file. The schema file describes the structure/fields of the data file. The data file consisted of the binary session vectors. Each session can be thought of as a transaction and each URL as an item, in the association rule context. Thus a session [10110] would imply that
URLs 1,3 and 4 were visited in this session and URLs 2 and 5 were not. The schema file was simply the URL numbers and was generated using a Perl program. The association file generated by MineSet was cleaned before the results could be analyzed.
4.3
Clustering
Before generating clusters for our sessions, we have to define a measure of similarity between our sessions. The similarity measure that we used for our experiments has been proposed by Nosraoui et al [6]. They have defined a dissimilarity measure between all session pairs (i.e., the relation matrix) prior to the clustering process. Note that since sessions are not object data, a distance measure in the sense of Minkowski norms is not automatically available. The following paragraph briefly explains the similarity measure used.
Consider two user-sessions s(k) and s(m). First consider the case where URLs accessed in the sessions are considered independent of the structure of the site. Then, the cosine of the angle between s(k) and s(l) (called M
1) is a measure of similarity. M1 simply measures the number of identical URLs accessed during the two sessions relative to the number of URLs accessed in both sessions and completely ignores the hierarchical organization of the web site. This adversely affects its ability to capture correct profiles. Another similarity measure [6] takes into account the site structure. The web site is modeled as a tree; essentially the directory structure rooted at the server's document root, with links (such as redirects and aliases) explicitly brought in. Taking into account the syntactic representation of two URLs, their similarity is assessed by comparing the location of their corresponding nodes on the tree. This is done by comparing the paths from the root of the tree to the two nodes. The "syntactic" similarity between the ith and jth URLs is
Su(i,j) = min
− ∩ ) 1 |) | |, max(| , 1 max( | | , 1 j p i p j p i pwhere pi denotes the path traversed from the root node to the node corresponding to the ith URL, and |p
i| indicates the length of this
path or the number of edges included in the path. This similarity, which lies in [0,1], measures the amount of overlap between the paths of the two URLs. Given this similarity between URLs, a new similarity measure between sessions is defined as
M2 = ∑ = ∑ = ∑ = ∑ = | U | 1 j s(l)j | U | 1 i s(k)i j) (i, Su s(l)j | U | 1 j s(k)i | U | 1 i -(II)
Due to similarity underestimation by both M1 and M2 in specific cases, they propose m=max(M1,M2) as a similarity measure. This similarity is mapped to the dissimilarity measure d=(1-m)2.
4.3.1
Evaluating the results
We interpret the results of applying the clustering algorithm on the user session data by using the following quantitative measures. The clustering algorithm [7] assigns user sessions to the closest clusters based on the similarity measures. This creates C clusters Xi={s(k)∈ S | dik < djk∀j ≠i}, for 1 ≤ i ≤ C. The sessions in cluster Xi are summarized in a typical session "profile" vector Pi = (Pi1, … ,Pi|U|)t. The components of Pi represent the degree with which
each URL belongs to a session. This is computed as Dij = p(sj(k) = 1 | s(k)∈ X
i ) = |Xij| / |Xi| where Xij = { s(k)∈ Xi | sj(k) > 0}.
In other words, it measures the fraction of the clusters in the session which included this URL. This helps us recognize those URL which form the "core" of the profile. For some URLs the degree is greater than 1. This is because we grouped together all the URLs that belonged to the same directory. Besides summarizing profiles, the components of the profile vector can be used to recognize an invalid profile, which has no strong or frequent access pattern.
5.
WEB QUERY TOOL AND
PRELIMINARY RESULTS
We have created a web based thin client as the user interface to the system. By using a web browser the user interface becomes platform independent unlike proprietary tools such as Discoverer. The interface is exported as an HTML forms document from the web server that interacts with the Warehouse using CGI and SQLPLUS. The web interface was created using Perl CGI scripts. The user can enter (or select) a value into the fields, and the system automatically constructs an appropriate SQL query. The generated query is piped to SQLPLUS, which runs the query saved in the file and sends the result back to the interface. The result page shows the query that was used by the database along with the retrieved data. It also shows a count of the records retrieved. The web interface is very simple and user friendly. The users do not need to be aware of the underlying database architecture or SQL to use this tool optimally.
We mined a large number of logs for our experiments, like the UMBC Server logs, UMBC CS Department Server logs, logs of some research groups, individual home page logs etc. While analyzing logs for UMBC's main server for instance, we obtained traversal paths of users accessing the Semester Schedule. Another traversal path corresponded to users accessing the Library web pages to check the availability of books etc. Then there were traversal paths obtained for generic or new users who traversed through most of the links on the main page etc.
5.1
Ad-hoc Analysis
The web interface allows users to perform ad-hoc analysis of both the web log warehouse and the mining results. By integrating both the components on a single tool, we have made it easier to analyze the access trends. A large number of analysis queries were given to the system and it produced correct results. We present some examples next.
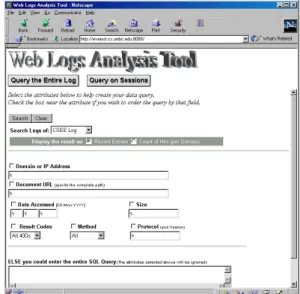
Figures 4 and 5 show the web based query interface of the log analysis part of our system to the warehouse. The interface provides pull down menus and fill in fields that allow rollup, drill down and slicing queries. For example, for the Status dimension, users can query for all status values, or can drill down and query for log entries whose status values fall in HTTP response ranges such as 100s, 200s etc. The user can also query for individual status codes like 200 (success) or 404(error). This system can also handle HTTP 1.1 error codes and Methods. By default, the attributes have ‘%’ in their fields, which is the wildcard character that aids in ad-hoc queries. E.g. If we want to query on the frequency of users accessing our web site from educational institutions, then we would enter ‘%.edu’ on the Domain field of
our interface. Or by entering ‘%Jun 1998’ on the date field we can retrieve all records that were logged in June 1998. Figure 4 illustrates such an example. Thus arbitrary OLAP queries can be performed interactively by the user.
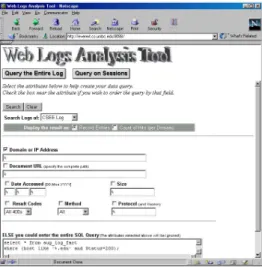
The Users who are aware of the database structure have additional flexibility of writing on-the-fly SQL queries to do arbitrary analyses (Figure 5). This feature of our tool also allows dicing queries (e.g. 'select * from whole_log_fact1 where (doc_size>=200 and doc_size < 1000); '). This will dice in the size dimension and retrieve all accesses where the size of the returned URL was between 200 and 1000 bytes.
Figures 6-8 below show the web interface to our mining results data. The interface provides pull down menus and fill in fields that allow users to query the traversal paths, sessions and the URLs for each application log. For example, if we want to query on the traversal path of users that originate from educational institutions, then we would enter ‘%.edu’ on the Domain field of our interface. Or by entering '0' on the Cluster Number field we can retrieve all URLs that belong to the sessions of that cluster.
Fig 4 (a): Web Interface: Attributes selected
Fig 5(a): Web Interface: SQL query entered.
Figure 5 (b): Web Interface: Results of the SQL query.
Figure 6: Interface to the Data Mining Component
Fig 7: Query Output for the Sessions-URL part
Fig 8: Query Output for the Cluster-URL part
6.
FUTURE ENHANCEMENTS
Currently, we have populated the fact table directly from the web logs. We can augment our system by loading the data into the transactional database, and then populate the fact tables from it. Stored procedures or triggers could be written to populate specific fact tables with web log as they get added, or in a batch mode. By creating such a transactional database, the pre-processing step will be automated to a large extent, and more dynamic "monitoring" can be done by the system automatically. Features like alerts and warnings can be easily incorporated in this architecture. For example, access patterns that denote security violations would be identified as they happen by the system (e.g the abuse of the CGI phf script, or attempted buffer overflow attacks). If a security violation is taking place, the site administrator can be alerted or the web site could be made inaccessible. This proactive feature of our architecture can aid in more efficient web site administration. However, this requires modifying the logging module in the web server to store access logs directly into the database.
Finally, our experimentation with the web mining were done with single (most reasonable) values for many of the tunable parameters, such as the time delta involved in sessionizing logs, confidence and support for associations, initializing of the medoids in clustering etc. Clearly, it would be interesting to experiment with and see the effect of these parameters on the eventual results.
7.
ACKNOWLEDGMENTS
This work was partially supported by cooperative NSF awards (IIS 9801711 & IIS 980089) to Joshi and Krishnapuram respectively.
8.
REFERENCES
[1] O.R. Zaiane, M. Xin, J. Han, "Discovering Web
Access Patterns and Trends by Applying OLAP and Data Mining Technology on Web Logs'', Proc. Advances in Digital Libraries Conf. (ADL'98), Santa Barbara, CA, April 1998, pp. 19-29.
[2] A. Joshi, and R. Krishnapuram, "Robust Fuzzy
Clustering Methods to Support Web Mining", in Proc. Workshop in Data Mining and knowledge Discovery, SIGMOD 1998.
[3] M. Perkowitz and O. Etzioni, "Towards Adaptive Web
Sites: Conceptual Framework and Case Study", to appear in Proceedings of WWW8, 1999.
[4] C. Shahabi, A.M. Zarkesh, J. Abidi and V. Shah,
“Knowledge Discovery from User’s Web-page Navigation”, Proc. Seventh IEEE Intl. Workshop on Research Issues in Data Engineering (RIDE), '97, pp. 20-29.
[5] O. Nasraoui, H. Frigui, A. Joshi, and R. Krishnapuram,
"Mining Web Access Logs Using Relational Competitive Fuzzy Clustering", to be presented at the Eight International Fuzzy Systems Association World Congress - IFSA 99, August 99
[6] O. Nasraoui, R. Krishnapuram and A. Joshi, "Mining
Web Access Logs Using a Fuzzy Relational Clustering Algorithm based on a Robust Estimator", (poster) at WWW8, August 1999
[7] L. Yi, R. Krishnapuram and A. Joshi, "A Fuzzy
Relative of the k-Medoids Algorithm with Application to Document and Snippet Clustering", IEEE Int'l Conference - Fuzzy Systems, 1999
[8] R. Cooley, B. Mobasher, and J. Srivastava, "Web
Mining: information and pattern discovery on the World Wide Web", in ICTAI'97, Dec, 1997
[9] Agrawal, R. Srikant: ``Fast Algorithms for Mining
Association Rules'', Proc. of the 20th Int'l Conference on Very Large Databases, Santiago, Chile, Sept. 1994.
[10]‘A Listing of Access Log Analyzers’,
http://www.uu.se/Software/Analyzers/Access-analyzers.html
[11]'Follow: A session based Log analyzing tool' ,
http://www.pobox.com/~mnot/follow/
[12]SGI-MineSet 'http://www.sgi.com/software/mineset/'
[13]B. Lent, R. Agrawal, R. Srikant, "Discovering Trends
in Text Databases", Proc. of the 3rd Int'l Conference on Knowledge Discovery in Databases and Data Mining, Newport Beach, California, August 1997.
[14]Helena Ahonen, Oskari Heinonen, Mika Klemettinen,
and Inkeri Verkamo. "Mining in the Phrasal Frontier", 1st European Symposium on Principles of Data Mining and Knowledge Discovery (PKDD'97), Norway, June 1997.
[15]Amir Zarkesh, Jafar Adibi, Cyrus Shahabi, Reza Sadri,
Vishal Shah, "Analysis and Design of Server Informative WWW-sites", in Proceedings of the ACM CIKM'97
[16]M.S. Chen, J.-S. Park and P. S. Yu, ``Efficient Data
Mining for Path Traversal Patterns,'' IEEE Trans. on Knowledge and Data Engineering, Vol. 10, No. 2, pp. 209-221, April 1998.
[17]"SpeedTracer: A Web usage mining and analysis tool",
IBM Systems Journal, Vol 37, No. 1 - Internet Computing , 1998 .