www.sciencemag.org/cgi/content/full/science.1201609/DC1
Supporting Online Material for
A Large and Persistent Carbon Sink in the World’s Forests
Yude Pan,* Richard A. Birdsey, Jingyun Fang, Richard Houghton, Pekka E. Kauppi, Werner A. Kurz, Oliver L. Phillips, Anatoly Shvidenko, Simon L. Lewis, Josep G. Canadell, Philippe Ciais, Robert B. Jackson, Stephen Pacala, A. David McGuire, Shilong
Piao, Aapo Rautiainen, Stephen Sitch, Daniel Hayes
*To whom correspondence should be addressed. E-mail: [email protected]
Published 14 July 2011 on Science Express DOI: 10.1126/science.1201609
This PDF file includes:
Materials and Methods SOM Text
Tables S1 to S6 References
Correction: This revised file reflects a number of minor changes to both the text and the data.
A Large and Persistent Carbon Sink in the World’s Forests
Supporting Online Material
Yude Pan1, Richard A. Birdsey1,Jingyun Fang2,3, Richard Houghton4, Pekka E. Kauppi5, Werner A. Kurz6, Oliver L. Phillips7, Anatoly Shvidenko8, Simon L. Lewis7, Josep G. Canadell9, Philippe Ciais10, Robert B. Jackson11, Stephen W. Pacala12, A. David McGuire13,
Shilong Piao2, Aapo Rautiainen5, Stephen Sitch7, Daniel Hayes14
1
USDA Forest Service, Newtown Square, PA 19073, USA
2
Key Laboratory for Earth Surface Processes, Ministry of Education, Peking University, Beijing, 100871 China;
3
State Key Laboratory of Vegetation and Environmental Change, Institute of Botany, Chinese Academy of Sciences, Beijing, 100093 China
4
Woods Hole Research Center, Falmouth, MA 02543, USA
5
University of Helsinki, Helsinki, Finland
6
Natural Resources Canada, Canadian Forest Service, Victoria, BC, V8Z 1M5,Canada
7
School of Geography, University of Leeds, LS2 9JT, UK.
8
International Institute for Applied Systems Analysis (IIASA), Laxenburg,Austria
9
Global Carbon Project, CSIRO Marine and Atmospheric Research, Canberra, Australia
10Laboratoire des Sciences du Climat et de l’Environnement (LSCE) CEA-UVSQ-CNRS,
Gif sur Yvette, France
11
Duke University, Durham, NC 27708, USA
12
Princeton University, Princeton, NJ 08544, USA
13
U.S. Geological Survey, Alaska Cooperative Fish and Wildlife Research Unit, University of Alaska, Fairbanks, AK 99775, USA
14
Methods and Data
Definitions of land categories
Forest- The definition of forest varies slightly from country to country, but generally follows the FAO definition: Land spanning more than 0.5 hectares with trees higher than 5 meters and a canopy cover of more than 10 percent, or trees able to reach these thresholds in situ. Forest lands that are temporarily treeless because of harvest or disturbance are included. Forest does not include land that is predominantly under agricultural or urban land use, even though such land may have some tree cover. Tree plantations are included.
Forest land remaining forest land- forests that do not undergo land-use change during the reporting period; includes forests that are harvested and regenerate back to forest.
Afforestation- land that has changed from nonforest to forest.
Deforestation- land that has changed from forest to nonforest.
Tropical intact forest- tropical forest areas that have not been substantially affected by direct human activities.
Tropical regrowth forest- tropical forests regrowing on the areas that have been previously deforested or logged.
Forest Carbon Pools
We generally followed the definitions from Table 3.1.2 in the IPCC Good Practice Guidance
(1), though minor deviations are embedded in the data depending on specific national circumstances.
Living biomass–includes and below-ground biomass of live plants. The above-ground biomass includes all living biomass above the soil including stem, stump, branches, bark, seeds, and foliage. The below-ground biomass includes all biomass of live roots. Fine roots of less than 2 mm diameter are often excluded or may be included with litter and soil carbon (C) pools. Understory plants may be excluded in cases where they comprise a very small proportion of the total biomass, as long as this is done consistently over time.
Dead wood – Includes all non-living woody biomass not contained in the litter, either
standing, lying on the ground, or in the soil. Dead wood includes wood lying on the surface, dead roots, and stumps larger than or equal to 10 cm in diameter, unless another threshold is used by the country.
Litter – Includes all non-living biomass with a diameter less than a minimum diameter chosen
by the country (typically 10 cm), and lying dead biomass in various stages of decomposition above the mineral or organic soil. Includes the litter, fumic, and humic layers. Live fine roots may be included if excluded from living biomass.
Soil organic matter–Includes organic carbon in mineral and organic soils (including peat) to a specified depth of 1 meter. Live fine roots may be included if excluded from living
biomass.
Carbon in harvested wood– includes products in use and in landfills. “Products in use”
includes end-use products that have not been discarded or otherwise destroyed. Examples include residential and nonresidential construction, wooden containers, and paper products.
“Products in landfills” includesdiscarded wood and paper placed in landfills where most carbon is stored long-term and only a small portion of the material is assumed to degrade, at a slow rate.
Overview of calculation methods and data
Accounting approaches to calculations for boreal, temperate, and tropical regions
There are slightly different accounting approaches used in this paper, in accordance with the IPCC guidelines, because the available data have been developed and presented in different ways in inventories, country reports, and the literature. Within the constraints of the available information, estimates were harmonized between accounting systems by carefully defining land areas and matching these with the sources of data, and by adjusting reported estimates where necessary to account for known inconsistencies. Our calculation methods are
summarized in table S1 and described in more detail here.
Either the “stock-change” or the “default” approaches were used for boreal and temperate biomes, following the guidance from IPCC for estimating and reporting country-level
greenhouse gas inventories (1,2). The stock change approach involves estimating C stocks at two or more points in time, then taking the difference between the stock estimates as the rate of change over the time period. If there is no land-use change, then this approach is nearly identical to estimating the land-atmosphere CO2 flux, with the exception of “lateral transfers”
of C which primarily include river erosion, transport, outgassing, and deposition; and harvested wood products. We accounted for harvested wood products but not for other lateral transport, which may be responsible for a significant global C sink in coastal oceans
(3) that is not reflected in the stock-change method. If there is land-use change, then the stock-change accounting overestimates the C uptake by forests in proportion to the area of afforestation during the period of change, because existing C stocks on new forest land (primarily soil C) appear instantaneously in the forest carbon inventory, transferred from the previous land use category. Conversely, the stock-change approach may underestimate C uptake by forests in proportion to the area of deforestation because existing soil C may be
moved to a nonforest land category and appear as a loss of C from forest. Because the area of afforestation is small relative to the total area of forest remaining forest, the effect is
relatively small.
The IPCC default approach commences with a single forest inventory and then adds C gains from forest growth and losses from harvest, fires and decomposition (1). The default
approach (used in Canada’s managed forests) accounts for C stock gains and losses without confounding estimates through C transfers between land-use categories.
For the tropics, C sinks and sources (or net fluxes) were estimated using a “flow” approach because most tropical areas lack the repeated national-scale forest inventories that are the basis for the stock-change approach. This approach is similar to the IPCC “tier 2” methods that multiply region-specific estimates of C density or change in C density times the
associated areas represented by the region-specific estimates. For intact tropical forests (not affected by land use or change), fluxes were estimated from measured C stock changes on permanent sample plots, which is nearly equivalent to forest-atmosphere C exchange except for river transport and deposition of C (harvesting did not take place on these land areas). The effects of land-use change and harvesting on C flux were estimated using a bookkeeping approach that keeps track of ecosystem C emissions and harvested wood products from deforestation and logging, and ecosystem C uptake on regrowing forests. Estimates of water transport and deposition are not accounted for in tropical forest biomes, though lateral
transfers in harvested wood products were estimated.
Estimates of changes in C stocks for two periods (Table 2 of main text) pertain to “forest land remaining forest land” and “afforestation”. Estimates of C stocks for specific years (Table S3) pertain to the total area of forest land in the given year and therefore include C stocks lost because of deforestation, which are not included in Table 2. Thus, it is not possible to
consistently match the estimates between these two tables. Forest area and area change
Where available, area estimates (Table S2) are from country-level forest inventories or reports based on forest inventories. Forest inventories typically use remote sensing to estimate forest area and area changes. Where forest inventories are lacking, particularly in the tropics, FAO statistics were used to estimate total forest area for 1990, 2000, and 2007 (4, 5). FAO statistics are compiled from country reports following established forest area
definitions. Area estimates for 2007 based on FAO statistics were made by interpolating between the reported years 2005 and 2010. In some regions, particularly the tropics, the quality of the data reported to FAO is variable and the inventories may be subject to change and reinterpretation over time (6,7). For tropical regions, updated area estimates for prior years were those reported in FAO (5). Regarding area change, there is approximate
estimated areas of afforestation and deforestation from inventories, country reports, and analyses of emissions from land-use change.
Carbon Stocks and Changes in Carbon Stocks
Where available, C stock and density estimates are from country-level forest inventories or reports based on forest inventories. Most countries in temperate and boreal biomes have established forest inventories with repeated measurement of permanent sample plots. Generally, sample plots are randomly located across all areas of the country, and
measurements taken on those plots that are located on forest land. Thus, the inventory is an unbiased sample of the population of trees in the country, and the precision of estimates may be calculated. The re-measurement interval is typically between 5 and 10 years. At each sample plot, individual trees are selected for measurement of diameter, height, species, and condition. Re-measurement determines the basic tree population dynamics: growth, mortality, and harvest. Additional measurements may be taken to include understory
vegetation, woody debris, litter, and soils. The measured data may be used to estimate the C stocks and changes in C stocks using a variety of country-specific methods described below, but following guidelines provided by IPCC (1, 2).
For some temperate or boreal countries where direct access to inventory data is not available, we used a biomass expansion factor (BEF) approach, which converts estimates of growing stock volume to estimates of biomass or C stocks. For intact tropical forests, we used data from repeated long-term measurements of a network of ecological research plots, upscaled to the regions to estimate biomass and other C pools for the region’s forest areas (8, 9). For tropical regrowth forests, which lack sufficient ground-based data, we followed the bookkeeping approach (10) which is based on a literature review of regrowth rates and knowledge of forest areas and conditions. These methods are described in more detail below for each region.
The data from regions, countries or continents were aggregated to global biomes: boreal, temperate, and tropical forests. The boreal forest comprises Russia, Canada, and Northern Europe; the temperate forest includes the conterminous United States, Southeast Alaska, Europe except for the boreal countries, China, Japan, South Korea, Australia, and New Zealand; while the tropical forest encompasses south Asia, Africa and the Americas south of the United States. Available data allowed C stock and area estimates to be compiled for 1990, 2000, and 2007, and annual changes in C stocks (sometimes referred to as “flux” or “sink” in this paper) to be estimated for two time periods: 1990-1999 and 2000-2007. Five major forest C pools, including their densities and changes, were estimated in this study: live
biomass (aboveground and belowground), dead wood (including dead trees and coarse woody debris), litter, soil organic matter, and harvested wood products.
More data are available for live biomass and biomass changes than for any other C pools. Some forest inventories and many ecological studies also collect and report data for dead wood and litter, though less consistently than for biomass; therefore, empirical models are
often the source of estimates for these C pools. Inventories of forest soil carbon across the landscape are scarcer than inventories of biomass or other ecosystem C pools. There are existing soil surveys in different countries, but very rarely with periodic revisits and rarely associated with documented information about aboveground forest vegetation. To evaluate forest soil C change over time is particularly challenging because the formation and
respiration of soil C is affected by various biological, environmental, and geographical factors; and land-use history; and not always correlated with more easily observable
vegetation traits. In almost every region, empirical modeling methods were used to combine data from soil surveys and field studies for developing the soil C estimates.
Harvested wood products
Where available, estimates of carbon in harvested wood products (HWP) are from country-level inventory reports as described above. Generally, estimates of carbon in HWP include both wood in use and discarded wood products remaining in landfills. For countries that lacked estimates of carbon in HWP, we derived a simple conversion factor from the countries that did report: the ratio of C in HWP (TgC yr-1) to the quantity of harvested roundwood (million m3) according to FAO reports (4), which is 0.095.
Specific methods used for each country or regional estimates
Detailed descriptions of the methods for each region are presented here and summarized in table S1. In general, countries of the temperate zone have established forest inventories that provide a sound basis for estimating C stocks and changes in C stocks. Countries of the boreal zone typically have inventories of parts of the land that are more intensively managed for timber production or other services, and use remote sensing or models to supplement the inventory data for reporting to FAO or the United Nations Framework Convention on Climate Change (UNFCCC). For the tropics, there are very few countries that have established forest inventories, and reporting to FAO and UNFCCC is very limited. In the tropics, area estimates reported to FAO are the most consistent source for information about the extent of forest land, even though there have been changes in methods and reporting quality over the years.
Russia
Area estimates for 1990 and 2000 are derived from the official inventory data of the State Forest Account (11-17); estimates for 2007 were updated from these inventories using remote sensing. Estimates of growing stock volume are based on official data of the State Forest Account for 1978-2009. These data have been corrected to eliminate biases of different methods of forest inventory which were applied in the country over the last three decades (18, 19) and to update obsolete inventory data for part of the country. Live biomass includes all components of forest ecosystems, not only trees (20).
Carbon in harvested wood is based on official statistics in units of commercial wood. Data are recalculated to estimate growing stock volume removals (multiplying by a coefficient of 1.25), then converted to carbon. All types of harvest are included (final felling, thinning etc.). Estimates of illegal logging are not included. Estimated soil C is based on the latest
assessment for 2007. Estimates for other years are based on empirical models that link soil C with amount of live biomass and level of disturbances (19). The estimates for soil C include the 1m top layer below the organic layer (litter) and 1m for organic land (peat).
Estimated dynamics of C pools give results which are rather close to estimates of full C account for Russian forests based on flux-based methods (21). The difference for the period of 2000-2007 is about 15-20%, which is mostly explained by some inconsistency in the account boundaries. The results of a recent reanalysis of the Russian forest C budget for 2003-2008 differ from the average of this study by 9% (22).
Canada
Estimates of C stocks and C stock changes are obtained from Canada’s National Forest
Carbon Monitoring, Accounting and Reporting System (NFCMARS) (23) developed to meet
international reporting requirements for greenhouse gas emissions and removals in Canada’s
managed forest. The Carbon Budget Model of the Canadian Forest Sector (CBM-CFS3) (24)
is the core model of NFCMARS. Details of data sources and regional results are provided elsewhere (25). Information on deforestation is derived from a national deforestation monitoring program implemented for all of Canada’s forests to meet the reporting
requirements of the UNFCCC and the Kyoto Protocol. Because of data limitations, estimates of C stocks and stock changes are limited to the 230 Mha of managed forest, leaving
unaccounted some 118 Mha of northern forests that are not subject to management.
The CBM-CFS3 is a well established C budget model used in Canada and internationally. It relies heavily on empirical data on forest conditions and forest changes, and simulates C stocks and stock changes in dead wood, litter and soil C as mass balances calculated from inputs (through litterfall, biomass turnover and disturbance inputs) and losses (through decomposition, transfers by harvesting, and losses to the atmosphere during disturbances such as fire) (24, 25, 26). Following the recommendations of the IPCC, the model links dynamics of dead organic matter pools directly to the dynamics of the better-known biomass dynamics. At present, the CBM-CFS3 does not account for C stocks in forested wetlands with deep (peat) organic soils whose dynamics are strongly affected by water table fluctuations for which few data exist at the national scale.
Estimates of Harvested Wood Product (HWP) C stock changes are derived in part from a spreadsheet model developed by Environment Canada for the purposes of UNFCCC
reporting. Estimates are based on the “production approach” which accounts for C stocks in HWP stocks derived from wood produced in Canada, regardless of their current location.
Alaska (the results are not included in the tables but inform the discussion)
Unlike the continental U.S., Alaska lacks an established forest inventory covering most of the State with repeated measurements. Therefore we used the Terrestrial Ecosystem Model (TEM), a process-based ecosystem model that uses spatially referenced information on atmospheric chemistry, climate, elevation, soils, and land cover to estimate monthly terrestrial carbon, nitrogen, and water fluxes and pool sizes. TEM is well-documented and has been used to examine patterns of terrestrial C dynamics across the globe and specifically applied to Alaska. For this study, we used a version of TEM modified from Felzer et al. (27), which simulated ozone pollution effects, to also include the influence of permafrost dynamics
(28, 29), atmospheric nitrogen deposition, dissolved carbon (DOC) leaching, wildfire, pastures and timber harvest on terrestrial carbon dynamics.
The forest area estimate used in TEM (42.3 x 10⁶ ha) is different from that reported in official U.S. forest statistics (51.3 x 10⁶ ha, Smith et al. (30)). This difference is primarily because of difficulty in consistently classifying areas with sparse forest cover.
Continental United States.
Forest area estimates for specific years are from the United States (U.S.) Forest Inventory and Analysis (FIA) as reported for all lands of the continental U.S. and Southeast Alaska (30). Estimated deforestation area is from the National Resources Inventory (31). The area of afforestation was calculated as the area needed to account for the total area change after estimated losses from deforestation.
Estimates of forest C stocks in the U.S. are based on the U.S. Forest Service Forest Inventory and Analysis (FIA) data base. FIA statistics are compiled from a very large sample of U.S. forest lands – about 150,000 forested sample plots are inventoried on a rotating annual basis. Statistical estimates of forest area, species, and stand density are converted to ecosystem carbon estimates using standard procedures and following national and international
accounting and reporting guidelines. Details of the methodology are available in USDA (32)
and USEPA (33), so only a brief overview is presented here. Forest tree biomass (live and dead) is estimated directly from the inventory measurements using allometric equations. Other C pools (down woody debris, forest floor, understory biomass, and soil C) are
estimated using simple empirical models, parameterized from ecosystem studies that related these variables to observed forest characteristics from the inventory. Estimates of changes in soil C stocks account for a soil depth of one meter, and include the effects of land-use change and forest type shifts, but not increases or decreases on forest land that does not change forest types. The carbon in harvested wood (remaining in use and stored in landfills) is estimated using a model that converts removals data to C stocks based on tracking of wood processing and decay rate functions (34).
The uncertainty of the estimated annual change in forest and wood products C is about 20% at the 95% confidence level (33). These uncertainty estimates are based on a Monte Carlo uncertainty analysis of the mean estimates.
Europe
The data for Europe were obtained from the country reports prepared by 41 European countries for the Global Forest Resources Assessment of 2010 (5). The quality and availability of forest area data for Europe is good. The reported values for forest area are generally based on field surveys from national forest inventories. In addition to reporting forest area, most countries also report annual (gross) rates of afforestation and the natural expansion of forest cover. Afforestation, in the terminology of this study, is the sum of these two rates of forest expansion. Deforestation can be inferred as the difference between net change forest area and afforestation. Eight countries lack values for annual afforestation. Depending on the sign of the net change of forest area in these countries, it is included in the regional totals as either afforestation or deforestation.
The estimates for carbon in living biomass in Europe are generally based on field surveys from national forest inventories that measure growing stock volume. Growing stock volume is converted to biomass, and biomass to carbon, using national factors developed by country-specific research or from IPCC’s Good Practice Guidance (1). The quality of these data is good.
The availability of data on carbon in dead wood is more restricted; approximately half of all European countries lack these data for at least one reporting year. Where data were missing, carbon in dead wood was estimated by applying ratios of dead wood carbon per hectare to forest area. For countries that lacked data for some year(s), these ratios were extrapolated based on data for other years. For countries entirely lacking data, these ratios were adopted from the country with the most similar climate and forest-use history. In these cases, the estimated ratios were constant and based on data from 1990. Due to data deficiencies, the accuracy and precision of the regional estimates of the dead wood C stock are weaker than the corresponding estimates for living biomass.
The availability of data on C stocks in litter and soils is also limited. Of the 41 European countries included in the analysis, 27 reported soil C for at least one year (1990-2010). Nearly all European countries that report soil C use forest area based extrapolations. These estimates are constructed by either applying a constant ratio of soil C per hectare to total forest area, or by applying ratios specific to soil type and soil type areas. Three countries deviate from this practice. In Austria and Sweden, soil C estimates are based on inventory data. In Finland, soil C stocks are principally estimated using the Yasso model. The soil depth at which soil C was measured varied between countries. Of the countries that had data, 17 used a soil depth of 30 cm. In the remaining 10 countries, the soil depth applied in estimates varies from 20 cm (in Belgium) to 100 cm (in Finland and the UK).
In this study, the C stocks in litter and soils for countries that lacked data were estimated by using area-based litter and soil C ratios. For countries that lacked data for some year(s), these ratios were extrapolated based on data for other years. For countries entirely lacking data, these ratios were adopted from the country with the most similar climate and forest use history. In these cases, the estimated ratios were constant and based on data from 1990. Available estimates were adjusted to a standard depth of one meter if a different depth was used, based on a model of soil C by depth reported in Jobbagy and Jackson (35). Estimates of the HWP C stock changes were derived using the method described earlier in the general methods section.
China
We estimated forest biomass C stock and its change during the 1990s and 2000s for China, using biomass expansion factors for each forest type and China’s forest inventory data for the periods 1989-1993, 1994-1998, 1999-2003, and 2004-2008 (36, 37). Since 1994, the
definition of forest in China’s forest inventory has changed from >30% canopy coverage to >20% canopy coverage. We therefore calculated forest area, C density, and C change for 1989-1993 based on the new criterion (20% canopy coverage). Analyzing the 1994-1998 inventory data that provide both criteria (20% and 30% canopy coverage), we found that there exists a robust linear relationship for the forest area and timber volume between the two criteria at the provincial level (Equations 1 and 2).
AREA0.2 = 1.183AREA0.3 + 12.137 (R2 = 0.990, n=30) (1) TC0.2 = 1.122TC0.3 + 1.157 (R2 = 0.995, n =30) (2)
where AREA0.2 and AREA0.3 are forest areas (104 ha) in a province under the two forest criteria, >20% and >30% canopy coverage, respectively; TC0.2 and TC0.3 are total forest C
stocks in province under the two criteria. The provincial forest areas and C stocks with the new criterion in 1989-1993 were calculated based on Equations 1 and 2, followed by derivation of the corresponding forest C densities for the different C pools (36). Carbon in soil to a depth of one meter was estimated using ratios of soil C to vegetation biomass. Japan and Korea
A number of field measurements of forest biomass and systematic national forest inventories in Japan made it possible to estimate the C stocks and their changes. Allometric relationships between forest biomass (above- and below-ground) and stem volume (biomass expansion factors) were first obtained for the major forest types in Japan from 945 sets of direct field measurements across the country. These relationships were used to estimate the changes in C accumulation of aboveground biomass and total living biomass from 1990 to 2005 using the national forest inventories of 1985, 1990, 1995, 2000, and 2005 (38). Soil C and changes in soil C were estimated using ratios of soil C to vegetation biomass. Litter C stocks and
changes were not estimated. An approach similar to that used for Japan was used to estimate C stocks and changes for Korea (39).
Australia and New Zealand
Australia designed a systematic national forest inventory in the mid-1990s, though no data were available for this study. However, the country has published Australia’s State of the Forest Report (ASFR) every 5 years since 1998 (40). The 2008 report includes a special section for reporting the contribution of forest ecosystems to global greenhouse gas balance, with relatively complete information back to 1989. In the carbon section, the basic
information of forest areas, area of deforestation, area of new plantations, forest biomass (above-ground plus roots), soil C (litter plus below-ground carbon), C sequestration and timber harvesting in managed native and plantation forests are provided. Australia also has the annual inventory reports of forest plantations, Australia’s UNFCCC report (41), and Australia’s National Greenhouse Accounts (42) with detailed information of use, land-use change and forestry that are tracked back to 1990. These available data were land-used in combination and carefully cross-checked to produce the information for this study. During the calculation procedure, the data from different reports were often used to fill each other’s data gaps. Also, the data in the first two ASFRs are not as complete as in the 2008 report. Therefore, some information, for instance, the ratios of biomass and soil C for different forest types, was employed to calculate the soil C component which was not included in the earlier reports. Because managed native forest in Australia is about 75% of total native forest, it is possible that the carbon values estimated in this study could be lower than the reality. New Zealand, similar to Australia, has published the country reports of forests titled “Sustainable Management of New Zealand’s Forests” (43, 44). The 2009 report included a special section to report forest contribution to the global C cycle with data of 2000, 2003 and 2008 for indigenous and plantation forests, including forest C pools and fluxes. In the other sections of the report, more information, such as forest areas, productivity, and harvesting, is provided. In contrast to Australia, New Zealand has very little timber harvest from native forests because industrial plantation forests provide sufficient quantities of wood products. Besides the data in the forest report, we used New Zealand’s UNFCCC reports and the National Greenhouse Gas Inventory (45) to provide extra information such as annual forest land C flux from 1990-2007. The data from different resources were cross-checked and used to supplement each other to produce the estimates in this study. For instance, there are
detailed data of different C pools (C in above-ground biomass, below-ground biomass, coarse woody debris, fine woody debris and little) for plantation and indigenous forests in 2005. Therefore, the ratios were calculated and applied to estimate corresponding components for years 1990 and 2000 to meet the requirements of this study.
Intact Forests of Tropical America, Africa, and Asia
Area estimates for intact tropical forests for each region were made by subtracting the area of secondary tropical regrowth forests estimated by Houghton et al. (46), and Houghton (10, 47)
from the total area of forests reported in FRA 2010 (5). To estimate areas for 2007, we interpolated between the reported areas for 2005 and 2010.
Carbon stock and stock change estimates are based on a network of permanent sample plots in each of Africa and Tropical America, while for Tropical Asia, where we lack sufficient sample sizes, we estimate changes in carbon stocks using the mean change rate of Tropical American and African forests. Methods for permanent plot work in Tropical America and Africa, and data quality control, are detailed elsewhere (8, 9, 48, 49). We developed a database (50) in which we curate several hundred tree-by-tree long-term forest demographic datasets from across the tropics (http://www.forestplots.net/). We assume that the same proportional net change detected in biomass in trees >10cm diameter is also expressed in the same proportion in all biomass compartments that are not monitored directly (shrubs,
saplings and lianas, below-ground, necromass, and litter). We do not account for possible changes in soil C stocks or harvested wood C stocks (for estimates of these pools, see sections in general methods describing soils and harvested wood products).
For Tropical America the total sample size is 135 plots, with a median size of 1 ha, mean census intervals of about four years, and mean total census length of about 12 years. We estimate mean net fluxes over a multi-decadal period prior to 2000 using all plot data earlier than that date, using the data and methods presented in Phillips et al. 2009 (census date approx 1980-2000).
In 2005 we detected a strong reversal of the Amazon biomass sink (8), but here derive a biomass change estimate for the 2000-2006 period within which time the forest was still projected to be a net sink, albeit a weaker one than in previous decades and with greater uncertainty due to the shorter monitoring period.
For Africa the underlying data was published in Lewis et al. (9), from 79 plots spanning 10 African countries, with a median plot size of 1 ha, a mean start and end date of 1987 and 1997. We derived a single multi-decade aboveground biomass change rate because the data are insufficient to split into two time periods and obtain an unbiased mean change in biomass due to the non-normal distribution of biomass change in tropical forests (9). This mimimal sample size requirement is discussed for Africa in Lewis et al.(9), for Amazonia by Gloor et al. (51), and more generally in Lloyd et al. (52).
For tropical Asia there are insufficient available, published data to provide an unbiased on-the-ground estimate of biomass change in mature forests. We therefore estimated the tropical Asian change using the mean of the proportional annual change rates for Africa (0.31%) and
South America (0.28%), which we then applied to all biomass compartments for each of the two periods, 1990-2000 and 2000-2007.
All analyses presented here refer to our dataset of lowland tropical wet, moist, and dry forests on a broad range of strata. These represent the large majority of intact forest types on each continent (>90%). Tropical forest types which cover comparatively small areas lack sufficient on-the-ground monitoring to know their biomass trajectory (notably: tropical montane forests in the Andes, sub-tropical and temperate forests in southern South America, and tropical swamp forests in each continent). For these forest types we assume the same trajectory of biomass change as for the monitored forest types.
The C stock data (biomass, deadwood, litter and soil) are incomplete with data only available for 2000 from Africa and South America. We used C stocks of 2000 and flux data of 1990-1999 and 2000-2007 to calculate C stocks for 1990 and 2007. First, we rebuilt the C stock of 2000 for tropical Asia. We used the average C density of tropical Africa and America as the C density of tropical Asia (for each C pool), and multiplied the density and the forest area to estimate the C stock of 2000 for tropical Asia. In estimating the C stocks, we considered the effect of C fluxes and also the loss of intact forest areas on C stocks. The calculation routine was performed for each C pool and each region. To make the description simple, we present here the general calculation routine. For the stock in 1990, the cumulative C sink over 1990-1999 was subtracted from the stock of 2000, then the C density was calculated (based on the forest area in 2000), resulting in our estimate of the C density of 1990. Then the C stock in 1990 was calculated based on the C density and the forest area in 1990 (i.e. a larger area), resulting in our estimate of the C stock of 1990. For the stock in 2007, the cumulative C sink over 2000-2007 (8 years) was added to the stock of 2000. Then the new C density was calculated (based on the forest area in 2000), resulting in our estimate of the C density of 2007. Then the C stock in 2007 was calculated based on the C density and the forest area (i.e. a smaller area), resulting in our estimate of the C stock of 2007.
Overall we have high confidence in a substantial long-term sink in intact tropical forests (Amazonia and Africa), notably because sample sizes are large enough to detect such an effect (51), but low confidence in any trends or comparisons amongst regions, and extremely low confidence in estimates for Asia.
Methods for Tropical Regrowth Forests of America, Africa, and Asia
We based our estimates for tropical regrowth forests on data reported in Houghton et al. (46), and Houghton (10, 47), recently updated to include revised estimates of tropical forest areas reported in the Forest Resources Assessment 2010 (5). This approach allowed our estimates to be consistent with estimates of CO2 emissions from deforestation when we aggregated the
results of our study with the other sources and sinks of the global C cycle (table 3 in the main text), which are based on forest areas reported by FAO.
The areas of tropical regrowth forests for 1990, 2000, and 2005 for each region were based on data reported in Houghton et al. (46), and Houghton (10, 47). We adjusted the area estimates in these reports to be consistent with the revised estimates for previous years reported in Forest Resources Assessment 2010 (5). To estimate areas for 2007, we interpolated between the reporting years 2005 and 2010. We estimated gross areas of afforestation and deforestation (rather than net change in land use) based on data from Houghton et al. (46), and Houghton (10, 47).
For estimating C stocks and stock changes for tropical regrowth forests, we used the stock change estimates reported by Houghton et al.(46), and Houghton (10, 47). In these studies, total C stocks and changes in C stocks, on a per-area basis, were developed from literature estimates of forest regrowth. The stock-change estimates reported in these studies were supplemented with additional unreported detail from the data bases used in the bookkeeping approach. We estimated total C stocks for the 3 regions and reporting years 1990, 2000, and 2005 for live biomass, dead wood, and soils. To estimate stocks for 2007, we extrapolated based on the rate of change from 2000 to 2005.
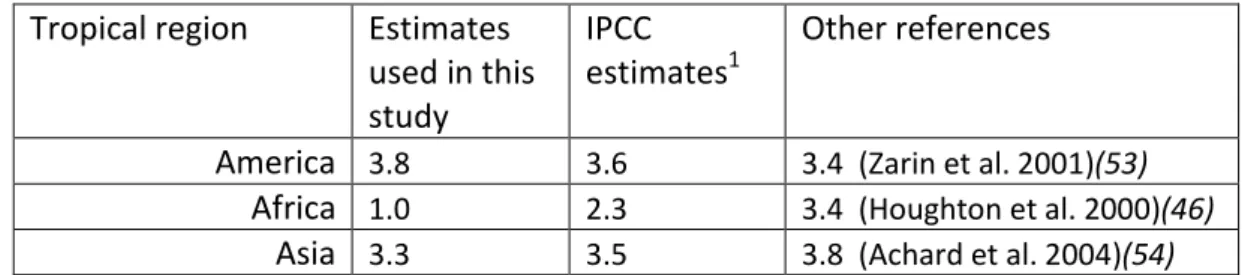
To validate our estimates of stock changes, we compared the growth estimates for tropical regrowth forests with other estimates from the literature (Table S4). Our estimates are comparable to those recommended by IPCC and to other literature sources for tropical Asia and America, but lower than other estimates for Africa, primarily because of the larger proportion of dry forest area in Africa. Because of the lack of statistical surveys and
permanent sample plots, the uncertainty of estimated values for secondary tropical forests is very significant, estimated by expert opinion to be as high as ±50%. The level of 50% for the 95% confidence level (see the following section for uncertainty estimation) was chosen for two reasons: (i) the uncertainties were greater than those estimated for tropical intact forests, which were derived directly from measurement data (except for S. America over 2000-2007 because of a great uncertainty for the Amazon drought effect on forest C uptakes in the intact forests); and (ii) the uncertainties are consistent with the widely reported uncertainty (0.7 Gt C/yr) in tropical land-use emission (that variable includes regrowth offset). Other levels such as 25% and 75% did not fit these criteria.
Approaches to estimate uncertainty
We report the Standard Error for estimates of C stocks and changes in C stocks, using the 95% confidence level. Values presented as “y ± x” should be interpreted to mean that the authors are 95% certain the actual value is between y – x and y + x. The 95% boundary was chosen to communicate the high degree of certainty that the actual value was in the reported range and the low likelihood (5% or less) that it was outside that range. This characterization is not, however, a statistical property of the estimate, and should not be confused with statistically defined 95% confidence intervals.
Where possible we used quantitative estimates of uncertainty, either calculated from sample plot data or reported in the source of data using an acceptable calculation method. If
quantitative estimates of uncertainties were not available from the source data or could not be calculated, we derived them from expert opinion using the following uncertainty scale, which has been used in previous large-scale analyses (55).
(1) 95% certain that the actual value is within 10% of the estimate reported (2) 95% certain that the estimate is within 25%
(3) 95% certain that the estimate is within 50% (4) 95% certain that the estimate is within 75% (5) 95% certain that the estimate is within 100%
These are informed categorizations, reflecting expert judgment, using all known descriptions of uncertainty surrounding the “best available” or “most likely” estimate. If multiple expert opinions were available, we used the highest uncertainty among them. In addition, we firstly estimate an uncertainty scale for carbon stock changes based on data or “expert opinions”. Then we used 50% of the scale to evaluate uncertainty of C stocks with an assumption that uncertainty for estimating C stock changes (the difference between two stocks) is the sum of uncertainties of stocks.
Main sources of uncertainty
Area
Generally, forest area estimates from countries with forest inventories are accurate (reported estimate within 5% of the true value), and the estimated net change between reporting years, calculated as the difference between successive estimates, is also accurate. However, it is often difficult to estimate the gross changes in area – afforestation and deforestation – because these estimates tend to be a small percentage of the total forest area and therefore require intensified sampling methods that may not be operationally deployed. For areas lacking forest inventories, particularly the tropics, there are well-known problems with reported estimates particularly regarding temporal consistency (6). Many reports from tropical countries are not based on remote sensing or sample surveys, but use subjective expert assessment -- 33% of countries according to Grainger (6). Updating older data, a common practice, also produces errors, as does re-estimating data for older reporting years if methods or definitions change. The separation of total tropical forest area by region into intact and regrowth forests is ambiguous with respect to accounting for small-scale selective logging, because these areas are difficult to detect from remote sensing and therefore are not clearly distinguished as part of the area of forest regrowth, which includes recovery from large-scale logging.
Carbon Stocks and Changes in Carbon Stocks
Generally, estimates for temperate and boreal forests have lower uncertainty than estimates for intact or tropical regrowth forests because they are based on unbiased statistical sample
surveys of all vegetation types and conditions. Also, estimates of above-ground biomass C stocks and changes in C stocks have lower uncertainty and more consistent results even with different estimation approaches, while there remains greater uncertainty and inconsistency in both data and methods for estimating dead wood, litter, soil, and harvested wood C stocks and changes in these stocks.
Supplemental Results, Tables and Figures
Global forest area
Detailed information about the area of global forests, by country/biome and year, including estimates of afforestation and deforestation, is shown in Table S2. The largest area of forest land is in the tropics, followed by boreal and then temperate forests. Globally, the area of forest land declined by 3% between 1990 and 2007, due to the loss of primary tropical forest, which exceeded gains in area of boreal and temperate forests, and increasing area of
secondary forest. Afforestation was greatest in temperate forests especially in the U.S., Europe, and China. The Asian part of Russia also showed a large gain in area due to afforestation. Deforestation was significantly greater in the tropics, though there were significant areas deforested in the temperate zone particularly the U.S. and Australia.
Area estimates reported here are consistent with the global forest area reported by FAO (4, 5)
for 1990, 2000, and 2010, except that we estimate less reduction in total forest area over time (Table S5). This is primarily because of higher estimates of afforestation in Russia than included in the total forest area of the FAO Forest Resources Assessment.
Forest carbon stocks and change in stocks for regions and pools
Supporting information about the C stock of global forests, by country/biome and year, including details for the major C pools, is shown in Table S3. Analysis of global forest C stocks and changes in global forest C stocks for boreal, temperate, and primary tropical forests is presented in the main text. We estimated C sequestration rates (Table 2 of main text) and C densities (Table S3) in different regions and countries, which are useful data although we did not fully analyze them in the main text. Here, we include some detailed analyses of C stocks and changes to supplement the information presented in the main text. We also briefly describe knowledge of changes in C stocks for “unmanaged” areas of the Northern Hemisphere that were excluded from our tables.
Alaska and Northern Canada
Large areas of unmanaged forests in the Northern Hemisphere lack sufficient ground data for reporting changes in C stocks in a way that is consistent with the other estimates reported here. Estimates reported for boreal forests exclude 51 Mha of Interior Alaska and 118 Mha
of Northern Canada. These areas are typically remote and not directly affected in a
significant way by human activities including fire suppression. Thus, changes in C stocks of these areas are dominated by natural disturbance cycles. Modeling studies, which have a basis in ground data but not from statistical surveys, reveal that these areas are likely to be in near equilibrium with respect to C emissions and sinks. Boreal forests of Alaska were estimated to be a small C sink of 0.01 PgCyr-1in previous studies (56, 57); however, some modeling results prepared for this study show a C source, which has increased from 0.005 Pg C yr-1in the 1990s to 0.014 Pg C yr-1 in the 2000s, caused by carbon release from litter and soils under fires and warming (considering deeper soils than used in other areas of this study), offsetting the small amount of C sequestration in biomass. Compared to the large C sink in forests of the European part of Russia, the boreal forests of North America are only small sinks or sources.
Russia
The C sink in Russian forests increased by 15% between 1990-1999 and 2000-2007 (Table 2 in main text). Asian Russia, with vast forest lands and a lower average C sequestration rate compared with European Russia, had the largest boreal sink, but that sink increased only slightly (Fig. 1 in main text) because of increased emissions from wildfire disturbances, resulting in reduced litter (-32%) and soil (-6%) sinks, and an increased deadwood sink (+46%) (58). In contrast, there was a much larger sink increase of 35% in European Russia (Fig. 1 in main text), particularly involving biomass (+129%). The large C sink increase in the European Russian forests is attributed to several factors: increased areas of forests after agricultural abandonment, reduced harvesting, and changes of forest age structure to more productive stages, particularly for the deciduous forests in European Russia and the middle taiga (58).
Japan, South Korea and Oceanic Countries
In Japan and South Korea, forests have the greatest average C sequestration rates among the major temperate countries because of a suitable oceanic climate for fast forest growth and effective application of forest management practices (Table 2 in main text) (38). However, while forests of South Korea had an increased sink over the decades due to a young forest age structure, the sink in Japan declined as the forests aged towards maturity. In Australia and New Zealand, natural forests are generally close to equilibrium state with relatively low C sequestration rates (40, 43). Drought and wildfire as well as deforestation in primary forests of Australia caused a slightly decreased C sink in biomass in the 2000s. Reported increases in total C sinks (Table 2 in main text) are primarily due to afforestation in the two countries, and a significant C increase in harvested wood products, particularly in New Zealand. Tropical intact forests
The magnitude of the C sink of African intact forests was comparable to that of tropical American forests, despite a smaller area (494 Mha vs. 773 Mha). This implies a high C sequestration rate over the large area of tropical African forests (Table 2) (59). The C sink in intact forests of tropical Asia is less than one-third of that in other continents because only
about 40% of forested areas remain as intact forests (5), much less than in tropical Africa (~70%) and America (~80%) (Table S2). However, there is large uncertainty associated with the estimated C uptake in tropical Asia because of a scarcity of long-term field data.
The reduced C uptake between 1990-1999 and 2000-2007 due to the shrinking area of tropical intact forest is 19%, 9% and 6% for tropical Asia, Africa and America, respectively. But this decreasing sink is partially compensated by C gains in tropical regrowth forests (Table 2, Fig.1 in main text). There was a 30% decline of the C sink in tropical America in 2000-2007 due to one severe drought year, which greatly affected the decadal estimate of C sink for whole tropics and reflected the sensitivity of the tropical forests to climate extremes. However, the full decadal impact of the drought on the Amazon C balance remains uncertain because data are incomplete for the post-drought period (8).
Deadwood, litter and soils
These variables are most often excluded from the global budget or forest inventory analyses. Compared with living biomass, there is usually higher uncertainty in estimating these
components, both stocks and fluxes, because of insufficient data. However, these C stocks and fluxes provide critical information about carbon dynamics and structures of forest ecosystems that enable better understanding of the impacts of environmental drivers and disturbances.
Globally, dead wood is estimated to be a small but significant component of the forest C stock (8% of total, Table S3), and the estimated C sink in dead wood accounts for more than 10% of the total C sink in forests (Table 2). The estimated sink in deadwood C stocks has increased by 36% over two decades. The significant increase of the C sink in the dead wood in boreal forests (147%) makes a major but possibly transient contribution to the total C sequestration in the high latitudinal belt, since decomposition could exceed creation of new dead wood in the future, induced by soil warming and increased wildfires in the region. In temperate forests, asubstantial part of which is intensively managed, the deadwood C sink is only 10% of the living biomass sink, and has not changed over two decades, in stark contrast to boreal forests. In intact tropical forests, the deadwood sink is also about 10% of the living biomass sink. Therefore, the global increase of deadwood simply reflects a trend in boreal forests.
The global soil C stocks are likely underestimated, especially for ecosystems with deep organic soils such as boreal peatlands and tropical mangroves. The magnitude and direction of change in deep soil C stocks in forests is currently unknown. The C sink in litter is larger in boreal forests, roughly equivalent to the soil sink. The global litter and soil stock of C is distributed 51%, 34% and 15% respectively in boreal, tropical and temperate forests, compared with the biomass stock allocation of 16%, 70% and 14%, revealing the
~16% of the total global sink and has declined by 12% globally over two decades, with a stable sink in the temperate region, and declines in other regions.
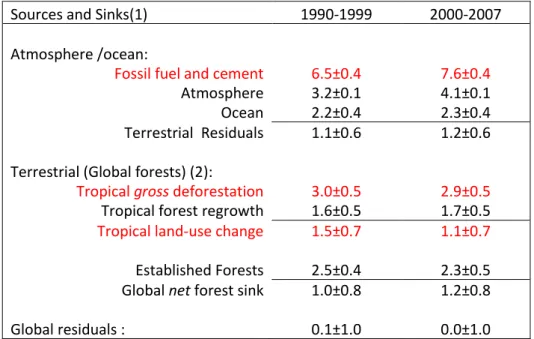
Global carbon budget
Different accounting schemes are used to describe the elements of the global C budget, which could be confusing. In the main text (Table 3), the budget was based on accounting for C sources and sinks. The two major C sources include fossil fuel emissions and the emissions from global land-use changes. The three major reservoirs for C sinks include atmosphere, ocean and terrestrial biosphere (land). In this way, the C emissions from land-use change (also from land) is also used to constrain the remaining terrestrial sink, which is in fact significantly larger since accounting includes the net loss from land-use change.
There is another way to account for the elements of the global C budget (Table S6) based on major earth systems. The land-system is constrained by fossil fuel emissions and sinks of ocean and atmosphere. The C losses from land-use changes are balanced by C uptake of lands within the system. The terrestrial sink is a net sink and seems smaller than the size based on the accounting of the above method. However, this is only because the terrestrial sink in Table 3 (main text) is a gross terrestrial sink. No matter which way is used in accounting for the global C budget, it is important to be clear about the definitions of each component and how they are combined.
References
1. IPCC. Good practice guidance for land use, land-use change, and forestry (IGES, Japan, 2003; http://www.ipcc-nggip.iges.or.jp/public/gpglulucf/gpglulucf.html)
2. IPCC, IPCC guidelines for national greenhouse gas inventories (IGES, Japan, 2006;
http://www.ipcc-nggip.iges.or.jp/public/2006gl/index.html).
3. P. Ciais, A.V. Borges, G. Abril, M. Meybeck, G. Folberth et al. The impact of lateral carbon fluxes on the European carbon balance. Biogeosciences5(5), 1259-1271 (2008) 4. Food and Agriculture Organization, Global forest resources assessment 2005 (Forestry
Paper 147, Food and Agriculture Organization, Rome, 2006).
5. Food and Agriculture Organization, Global forest resources assessment 2010 (Forestry Paper 163, Food and Agriculture Organization, Rome, 2010).
6. A. Grainger. Difficulties in tracking the long-term global trend in tropical forest area.
Proc. Natl. Acad. Sci. U.S.A. 105(2), 818–823 (2008)
7. P. E. Waggoner. Forest inventories: discrepancies and uncertainties, (Discussion paper. Washington, DC, Resources for the Future, 2009).
8. O. L. Phillips, L. E. Aragão, S. L. Lewis, J. B. Fisher, J. Lloyd et al., Drought sensitivity of the Amazon rainforest. Science 323, 1344-1347 (2009).
9. S. L. Lewis, G. Lopez-Gonzalez, B. Sonké, K. Affum-Baffo, T.R. Baker, Increasing carbon storage in intact African tropical forests. Nature 477: 1003-1006 (2009).
10. R. A. Houghton, Balancing the global carbon budget. Annual Review of Earth and Planetary Science 35, 313-347 (2007).
11. FFS 1995. “Forest Fund of Russia (state by January 1, 1993)” (Federal Forest Service of Russia, Moscow, 1995) (official data in Russian, access by title).
12. FFS 1999. “Forest Fund of Russia (state by January 1, 1998)” (Federal Forest Service of Russia, Moscow, 1999) (official data in Russian, access by title).
13. FFS 2003. “Forest Fund of Russia (state by January 1, 2003)” (Federal Forest Service of Russia, Moscow, 2003) (official data in Russian, access by title).
14. FFS 2005. “Forest Fund of Russia (state by January 1, 2005)” (Federal Forest Service of Russia, Moscow, 2005) (official data in Russian, access by title).
15. Goscomles USSR 1982. “Forest Fund of the USSR (state by January 1, 1978)”(USSR
State Committee of Forest Management, Moscow, 1982) (in Russian, access by title) 16. Goscomles USSR 1986. “Forest Fund of the USSR (state by January 1, 1983)” (USSR
State Committee of Forest Management, Moscow, 1986)(in Russian, access by title) 17. Goscomles USSR 1990. “Forest Fund of the USSR (state by January 1, 1988)” (USSR
State Committee of Forest Management, Moscow, 1990) ([in Russian, access by title) 18. A. Shvidenko, S. Nilsson. Dynamics of Russian forests and the carbon budget in
1961-1998: An assessment based on long-term forest inventory data. Climatic Change55, 5-37 (2002)
19. A. Shvidenko, S. Nilsson. A synthesis of the impact of Russian forests on the global carbon budget for 1961-1998. Tellus55B, 391-415 (2003)
20. A. Shvidenko, D. Schepschenko, S. Nilsson, Y. Bouloui. Semi-empirical models for assessing biological productivity of Northern Eurasian forests. Ecological Modelling, 204, 163-179 (2007)
21. A. Shvidenko, D. Schepaschenko, I.McCallum, F. Kraxner, S.Nilsson, S. Maksyutov. Verified terrestrial ecosystems full carbon account for Russia: A reanalysis, in
Proceedings of the 8th International CO2 Conference (Jena, September 2009, CD Rom) 22. A. Shvidenko, D. Schepaschenko, S. Maksyutov. Impact of terrestrial ecosystems of
Russia on global carbon cycle in 2003-2008: An attempt of synthesis, in Proceedings of the International Science Conference (ENVIROMIS 2010, 5-12 July, Tomsk, Russia), pp 48-52.
23. W. A. Kurz, M.J. Apps. Developing Canada’s National Forest Carbon Monitoring, Accounting and Reporting System to meet the reporting requirements of the Kyoto Protocol. Mitigation and Adaptation Strategies for Global Change, 11, 33–43 (2006).
24. W. A. Kurz, C.C. Dymond, T.M. White, G. Stinson, C. H. Shaw et al.. CBM-CFS3: a
model of carbon-dynamics in forestry and land-use change implementing IPCC standards.
Ecological Modelling220, 480-504 (2009)
25. G. Stinson, W. A. Kurz, C. E. Smyth, E. T. Neilson, C. C. Dymond, et al. An inventory-based analysis of Canada’s managed forest carbon dynamics, 1990 to 2008. Glob. Change Bio., DOI: 10.1111/j.1365-2486.2010.02369 (2010)
26. W. A. Kurz, M. J. Apps. A 70-year retrospective analysis of carbon fluxes in the Canadian forest sector. Ecological Applications 9(2), 526-547 (1999).
27. B. Felzer, D. Kicklighter, J. Melillo, C. Wang, Q. Zhuang, R. Prinn. Effects of ozone on net primary production and carbon sequestration in the conterminous United States using a biogeochemistry model. Tellus 56B, 230-248 (2004)
28. Q. Zhuang, A. D. McGuire, J. M. Melillo, J. S. Clein, R. J. Dargaville et al. Carbon cycling in extratropical terrestrial ecosystems of the Northern Hemisphere during the 20th Century: A modeling analysis of the influences of soil thermal dynamics, Tellus, 55(B), 751-776 (2003)
29. E. S. Euskirchen, A. D. McGuire, D. W. Kicklighter, Q. Zhuang, J. S. Clein et al. Importance of recent shifts in soil thermal dynamics on growing season length, productivity and carbon sequestration in terrestrial high-latitude ecosystems. Global Change Biology 12(4), 731-750 (2006)
30. W. B. Smith, P.D. Miles, C.H. Perry, S.A. Pugh. “Forest Resources of the United States, 2007” (Gen. Tech. Rep. WO-78. Washington, DC: U.S. Department of Agriculture, Forest Service, Washington Office, 2009).
31. USDA. “Summary Report: 2007 National Resources Inventory” (Natural Resources Conservation Service, Washington, DC, and Center for Survey Statistics and
Methodology, 2009;
http://www.usda.gov/oce/global_change/AFGGInventory1990_2005.htm)
32. USDA. U.S. Agriculture and Forestry Greenhouse Gas Inventory: 1990-2005 (Technical
Bulletin No. 1921, Global Change Program Office, Office of the Chief Economist, U.S. Department of Agriculture, 2008)
33. U.S. Environmental Protection Agency. Inventory of U.S. Greenhouse Gas Emissions and Sinks: 1990-2007 ( EPA 430-R-09-004, 2009;
http://www.epa.gov/climatechange/emissions/usinventoryreport.html)
34. K. Skog, Sequestration of carbon in harvested wood products for the United States. For
Prod J58(6), 56–72 (2008)
35. E. G. Jobbágy, R.B. Jackson. The vertical distribution of organic soil carbon and its relation to climate and vegetation. Ecological Applications10(2), 423-436 (2000) 36. J. Y. Fang, A. P. Chen, C.H. Peng, S. Q. Zhao, L. Ci, L. Changes in forest biomass
carbon storage in China between 1949 and 1998. Science292, 2320–2322 (2001).
37. J. Y. Fang, Z. D. Guo, S. L. Piao, A. P. Chen. Terrestrial vegetation carbon sinks in China, 1981–2000. Sci. China Ser. D, 50, 1341–1350 (2007).
38. J. Fang, O. Takehisa Oikawa, T. Kato, W. Mo, Z. Wang. 2005. Biomass carbon accumulation by Japan’s forests from 1947 to 1995. Global Biogeochemical Cycles, 19 (2005)
39. S-D. Choi, K. Lee, Y-S. Chang. Large rate of uptake of atmospheric carbon dioxide by planted forest biomass in Korea Global Biogeochem. Cycles, 16, 1089 (2002)
40. ASOFR. “Australia's State of the Forests Report”
((http://adl.brs.gov.au/forestsaustralia/publications/sofr2008.html, 1998, 2003, 2008) (Accessed December 11, 2010)
41. UNFCCC. “Australia’s UNFCCC report”
(http://unfccc.int/files/methods_and_science/lulucf/application/pdf/australia.pdf, 2007) (Accessed December 11, 2010)
42. AGEIS. “Australia’s National Greenhouse Accounts”
(http://www.climatechange.gov.au/climate-change/emissions.aspx, updating with time, 2009) (Accessed December 11, 2010)
43. MAF. Sustainable management of New Zealand's forests (Ministry of Agriculture and Forestry; http://www.maf.govt.nz/mafnet/publications/2008-nz-report-montreal-process/index.htm, 2009) (Accessed December 11, 2010)
44. MAF. A Forestry Sector Study (Ministry of Agriculture and Forestry;
http://www.maf.govt.nz/forestry/publications/forestry-sector-study-2009/, 2009) (Accessed December 11, 2010)
45. New Zealand Ministry for the Environment. New Zealand’s Greenhouse Gas
Inventory1990–2007 ( http://www.mfe.govt.nz/publications/climate/greenhouse-gas-inventory-2009/index.html, 2009) (Accessed December 11, 2010)
46. R. A. Houghton, D. L. Skole, C. A. Nobre, J. L. Hackler, K. T. Lawrence et al. Annual fluxes of carbon from deforestation and regrowth in the Brazilian Amazon. Nature 403, 301-304 (2000)
47. R. A. Houghton. Revised estimates of the annual net flux of carbon to the atmosphere from changes in land use and land management 1850-2000. Tellus55B, 378-390 (2003) 48. O. L. Phillips, T. Baker, L. Arroyo, N. Higuchi, T. Killeen et al. Pattern and process in
Amazon forest dynamics, 1976-2001. PhilosophicalTransactions of the Royal Society, Ser. B 359, 381-407 (2004)
49. O. L. Phillips, S. L. Lewis, T. R. Baker, K.-J. Chao, N. Higuchi. The changing Amazon forest. Philosophical Transactions of the Royal Society, Ser.B. 363, 1819-1828 (2008). 50. J. Peacock, T. Baker, S. L. Lewis, G. Lopez-Gonzalez, O. L. Phillips. The RAINFOR
database: monitoring forest biomass and dynamics. Journal of Vegetation Science18, 535-542 (2007)
51. M. Gloor, O. L. Phillips, Y. Malhi, J. J. Lloyd, S. L. Lewis et al. Is the disturbance hypothesis for explaining trends in Amazonian forest biomass consistent with basin-wide data? Glob. Change Bio. 15, 2418–2430(2009).
52. J. Lloyd, E. Gloor, S. L. Lewis. Are the dynamics of tropical forests dominated by large and rare disturbance events? Ecology Letters12, E19–E21 (2009)
53. D. J. Zarin, M. J. Ducey, J. M. Tucker.Potential biomass accumulation in Amazonian regrowth forests. Ecosystems4: 658-668 (2001).
54. F. Achard, H. D. Eva, P. Mayaux, H-J Stibig, A. Belward. Improved estimates of net carbon emissions from land cover change in the tropics for the 1990s. Global
Biogeochemical Cycles18: GB (2008).
55. CCSP. The First State of the Carbon Cycle Report (SOCCR): The North American
Carbon Budget and Implications for the Global Carbon Cycle, A. W. King, L. Dilling,
G.P. Zimmerman, D.M. Fairman, R.A. Houghton et al Eds. (U.S. Climate Change
Science Program and the Subcommittee on Global Change Research, National Oceanic and Atmospheric Administration, National Climatic Data Center, Asheville, NC, USA, 2007)
56. J. Yarie, S. Billings. 2002. Carbon balance of the taiga forest within Alaska: present and future. Can. J. For. Res. 32, 757–767 (2002)
57. A. D. McGuire, M. Apps, F. S. Chapin III, R. Dargaville, M. D. Flannigan et al. Land cover disturbances and feedbacks to the climate system in Canada and Alaska., in Land Change Science: Observing, Monitoring, and Understanding Trajectories of Change on the Earth's Surface, G. Gutman, A. C. Janetos, C. O. Justice, E. F. Moran, J. F. Mustard et al. Eds. (Dordrecht, Netherlands, Kluwer, 2004), pp. 139-161.
58. A. Z. Shvidenko, D. G. Schepaschenko, S. Nilsson, Materials to perception of current productivity of forest ecosystems in Russia. In Basic Problems of Transition to Sustainable Forest Management in Russia, V. A. Sokolov, A. Z. Shvidenko, O. P. Vtorina Eds (Russian Academy of Sciences, Krasnoyarsk 2007), pp. 5-35.
59. E. T. A. Mitchard, S. S. Saatchi, I. H. Woodhouse, G. Nangendo, N. S. Ribeiro et al.
Using satellite radar backscatter to predict above-ground woody biomass: A consistent relationship across four different African landscapes, Geophys. Res. Lett., 36, L23401 (2009)
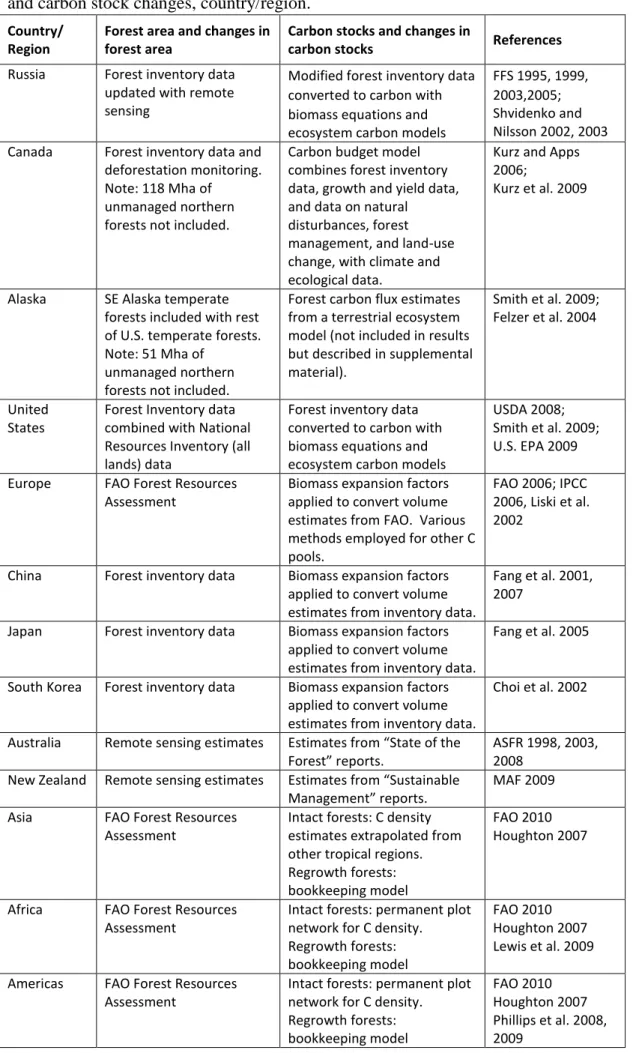
Table S1. Summary of methods and main sources of data for estimating area, carbon stocks, and carbon stock changes, country/region.
Country/ Region
Forest area and changes in forest area
Carbon stocks and changes in
carbon stocks References
Russia Forest inventory data updated with remote sensing
Modified forest inventory data converted to carbon with biomass equations and ecosystem carbon models
FFS 1995, 1999, 2003,2005; Shvidenko and Nilsson 2002, 2003 Canada Forest inventory data and
deforestation monitoring. Note: 118 Mha of
unmanaged northern forests not included.
Carbon budget model combines forest inventory data, growth and yield data, and data on natural
disturbances, forest management, and land-use change, with climate and ecological data.
Kurz and Apps 2006;
Kurz et al. 2009
Alaska SE Alaska temperate forests included with rest of U.S. temperate forests. Note: 51 Mha of
unmanaged northern forests not included.
Forest carbon flux estimates from a terrestrial ecosystem model (not included in results but described in supplemental material).
Smith et al. 2009; Felzer et al. 2004
United States
Forest Inventory data combined with National Resources Inventory (all lands) data
Forest inventory data converted to carbon with biomass equations and ecosystem carbon models
USDA 2008; Smith et al. 2009; U.S. EPA 2009 Europe FAO Forest Resources
Assessment
Biomass expansion factors applied to convert volume estimates from FAO. Various methods employed for other C pools.
FAO 2006; IPCC 2006, Liski et al. 2002
China Forest inventory data Biomass expansion factors applied to convert volume estimates from inventory data.
Fang et al. 2001, 2007
Japan Forest inventory data Biomass expansion factors applied to convert volume estimates from inventory data.
Fang et al. 2005
South Korea Forest inventory data Biomass expansion factors applied to convert volume estimates from inventory data.
Choi et al. 2002
Australia Remote sensing estimates Estimates from “State of the Forest” reports.
ASFR 1998, 2003, 2008
New Zealand Remote sensing estimates Estimates from “Sustainable Management” reports.
MAF 2009 Asia FAO Forest Resources
Assessment
Intact forests: C density estimates extrapolated from other tropical regions. Regrowth forests: bookkeeping model
FAO 2010 Houghton 2007
Africa FAO Forest Resources Assessment
Intact forests: permanent plot network for C density. Regrowth forests: bookkeeping model
FAO 2010 Houghton 2007 Lewis et al. 2009 Americas FAO Forest Resources
Assessment
Intact forests: permanent plot network for C density. Regrowth forests: bookkeeping model FAO 2010 Houghton 2007 Phillips et al. 2008, 2009