2020 4th International Conference on Modelling, Simulation and Applied Mathematics (MSAM 2020) ISBN: 978-1-60595-674-9
Optimization on the Quantity of Vehicles in Car Interior Trim
Assembly Line
Chang-shui GAO
1, Cheng-qing MA
1, Dan HU
1, Zhuang LIU
1,
Jian-chuan TIAN
2and Guang-hua MAO
21College of Mechanical and Electrical Engineering, Nanjing University of Aeronautics and
Astronautics, Nanjing, China
2Wuxi Chenguang Intelligent Technology Co., Ltd, Wuxi, China
Keywords: Plant Simulation, Optimization, Entropy weight method, TOPSIS.
Abstract. Determining quantity of vehicles in an interior trim assembly line is a key problem for a car manufacturing workshop. This paper presents a work to optimize quantity of vehicles for designing car assembly lines. A simulation model of the car interior trim assembly workshop was established using Siemens Plant Simulation system. Based on the entropy weight method and the TOPSIS method, the effect of various quantity vehicles was evaluated. An optimized solution for the number of vehicles was obtained accordingly. Compared to original design, the optimal solution can reduce the total cost of vehicles up to 6.96%. The calculation of variance for utilization rate of equipment has been reduced approximate 30%, which means the equipment utilization is more balanced than original design.
Introduction
Due to the complexity of the production system, a lot of manpower, material resources and time must put into experiments if we want to make in-depth research and improvement on the production system. Else, it is impossible to conduct actual experiments on the automobile assembly lines. Through computer simulation technology, the production system can be analyzed and evaluated, and optimized solutions can be obtained, while the existing production system works normally [1].Li et al. combined the maximum completion time, total load of machine and load of bottleneck machine into a weighted function. The function was solved through Tabu Search and Variable Neighborhood Search algorithm for solving the flexible job shop scheduling problem [2]. An experimental method was used to optimize the number of delivery trolleys, operating speed and load of trolleys. Finally an optimal solution with higher logistics efficiency was obtained by Zhou [3]. Wang studied the influence of the number of skid in the auto workshop and the capacity of the buffer on the output of the system. The number of skid and the capacity of the buffer in the production workshop are determined [4].
Both Zhou and Wang qualitatively analyze the effect of factors, and the evaluation index are single. In this paper, the operating state of the assembly line under different vehicles numbers is obtained through the DOE module in simulation system. Then the entropy weight method and TOPSIS method are used to make quantitative analysis on simulation data. After obtaining optimized vehicles delivery quantity, the cost is reduced, equipment utilization rate is improved that ensures balanced utilization of equipment. Simulation results demonstrate the effectiveness of methods listed above for optimizing quantity of vehicles.
Problem Description and Methodology
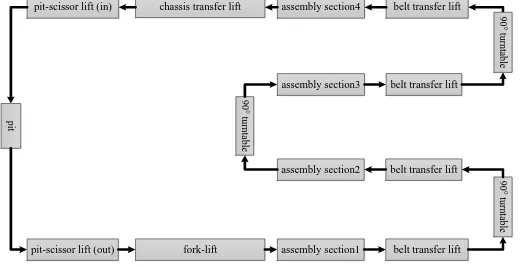
[image:2.595.171.431.190.323.2]The car interior assembly line is part of the general assembly shop, and schematic diagram of workshop is shown in Figure 1. The body is transferred to the interior assembly line from the PBS (Painted Body Store) line. Then the dashboard, the sub-dashboard, the steering wheel, the coaming and other parts are installed on body in assembly section 1-4. After that the body is transferred to the chassis assembly line for installation of the chassis, the engine and the tire components.
Figure 1. Schematic diagram of interior assembly line.
In this line, the utilization rate of fork-lift, belt transfer lift, 90° turntable, chassis transfer lift, pit-scissor lift (in), pit-pit-scissor lift (out) and the variance of utilization rate S2 are related to the productivity of the line. Optimizing the utilization rate and S2 to achieve balanced load on the equipment, increase line productivity and reduce costs. The above seven index are selected to calculate the closeness to the positive ideal solution by the TOPSIS method. Furthermore, weights of index in TOPSIS are determined by the entropy weight method.
Entropy Weight Method to Determine Weight
The entropy weight method is an objective weighting method. The method determines the weight of an index by using the amount of information provided by the entropy value of each index [5].The steps of determining the weight of the index by using the entropy weight method mainly include: forming a decision matrix, standardizing the decision matrix, calculating the characteristic weight of each index corresponding to each evaluation object, calculating the entropy value of each index, calculating the difference coefficient of each index, determining the entropy weight of each index.
This paper selects the above seven index to calculate its weight:
M= (M1, M2,…, Mm)is used as evaluation object set , D= (D1, D2,… , D7) is used as the index set.
And the value of the evaluation object Mi corresponding index Dj is xij(i=1,2,...,m; j=1,2,...,7). The
value matrix X is formed as:
1 1 1 2 1 7
2 1 2 2 2 7
1 2 7
X
m m m
x x x
x x x
x x x
(1)
By normalizing the matrix X, a standardized matrix V=(vij)mx7is formed to eliminate the influence
of different index dimensions on the plan. The index in this paper are the smaller the better, there are:
max
max min
j i j i j j j x x v x x
(2) fork-lift
chassis transfer lift
pit-scissor lift (out) pit-scissor lift (in)
belt transfer lift assembly section1 9 0 ° t u rn ta b le
belt transfer lift assembly section2 9 0 ° t u rn ta b le
belt transfer lift assembly section3
belt transfer lift assembly section4 9
Where vij is the normalized value of xij;
max(xj), min(xj)is the maximum and minimum of the j index.
The characteristic weight of the i evaluation object under the j index is calculated as:
1
i j
i j m
i j i v p v
(3) The entropy value ej of the j index is
1
1
ln ln
m
j ij ij
i
e p p
m
(4)According to the concept of entropy, the greater difference of the j index value of each evaluated object, the lager information amount of the index. Therefore, the coefficient of variation dj is
defined as:
1
j j
d e (5) The larger dj, the larger the information amount provided by the index, the greater weight of the
index should be assigned.
The entropy weight of each index according to the obtained coefficient of variation dj is
determined by:
7
1
1 2 7
j j k k d w j d
, ,, , (6) Calculating the data of equipment obtained by experiment according to the formulas (1)-(6), entropy of each index above is determined.TOPSIS Method Quantity Optimization
The TOPSIS method calculates the closeness of the plan to the positive ideal solution by calculating the weighted Euclidean Distance between a certain solution and the positive ideal solution and the negative ideal solution. The plan is evaluated with weighted Euclidean distance [6].
N= (N1, N2,…, Nn) is used as the evaluation object set, E= (E1, E2,…, E7)is used as the index set.
And the value of the evaluation object Ni corresponding index Ej is yij (i=1,2,…,n; j=1,2,…,7), the
value matrix Y is formed as:
11 1 2 1 7
2 1 2 2 2 7
1 2 7
Y
n n n
y y y
y y y
y y y
(7)
Similar to the entropy weight method, standardized matrix U= (uij)nx7 is formed by normalizing
the value matrix, which eliminates the influence of different index dimensions on the plan. The index in this paper are the smaller the better ,there are:
max max min j ij ij j j y y u y y (8)
Where uij is the normalized value of yij;
max(yj), min (yj) is the maximum and minimum of the j index.
Multiplying the index weight wj got in chapter 2.1 by the dimensionless matrix U to get a
1, 2, , ; 1, 2, , 7
ij j ij
r w u i n j (9) For the smaller and better index, the positive ideal solution and the negative ideal solution are calculated as:
1
Sj min ij , 1, 2, , 7 i n r j
(10)
1
Sj max ij , 1, 2, , 7 i n r j
(11)
The distance between each plan and the positive and negative ideal solutions are calculated as:
7 2
1
Sdi Sj ij , 1, 2, ,
j
r i n
(12)
7 2
1
Sdi Sj ij , 1, 2, ,
j
r i n
(13)The relative closeness ηi of each solution to the positive ideal solution is:
Sd
η 1, 2, ,
Sd Sd
i i
i i
i n
, (14)
The closeness of different solution to the positive ideal solution is calculated by entropy weight and the formula (7)-(14).
Assembly Line Vehicles Quantity Optimization
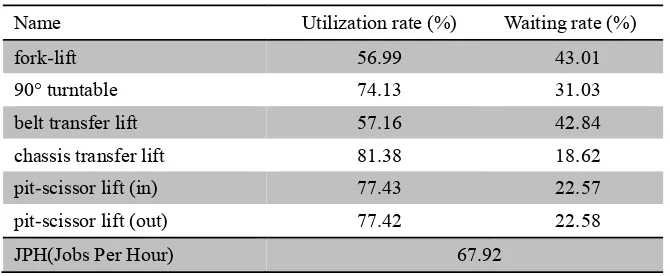
[image:4.595.131.466.501.639.2]Designed take time of assembly line is 53s (JPH = 67.92) and original quantity of vehicles is 115.The running state is simulated in the simulation system. The simulation running time is 24h. The running results are shown in Table 1:
Table 1. Simulation results.
Name Utilization rate (%) Waiting rate (%)
fork-lift 56.99 43.01
90° turntable 74.13 31.03
belt transfer lift 57.16 42.84
chassis transfer lift 81.38 18.62
pit-scissor lift (in) 77.43 22.57
pit-scissor lift (out) 77.42 22.58
JPH(Jobs Per Hour) 67.92
Figure 2. JPH of various quantity vehicles.
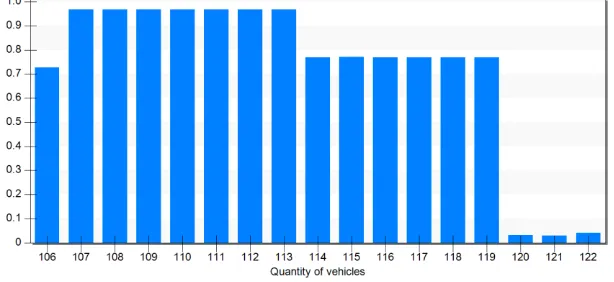
The quantity of vehicles can reach the designed take time of 53s (JPH=67.92) within the range of 106-122. The utilization rate of the equipment between the 106-122 vehicles is shown in Figure 3. After the vehicles quantity reaches 122, the utilization rate of the 90° turntable reaches 96.18% from 74.11%.The utilization rate of the chassis transfer lift dropped to 37.75% when vehicles quantity is 120 while other equipment remained unchanged. The reason is the quantity of vehicles is close to the maximum capacity of the interior line, and the 90° turntable is the bottleneck in the interior line, resulting in an increase in the utilization of the turntable and the chassis transfer lift drop.
- fork-lift - four-column transfer lift - 90° turntable - chassis transfer lift
[image:5.595.136.482.346.530.2]- pit-scissor lift (in) - pit-scissor lift (out)
Figure 3. Utilization rate of various quantity vehicles.
To evaluate plans which quantity of vehicles ranges from 106-122, calculating the data of each equipment with the formulas (1)-(6), entropy weight of equipment and S2 equals 0.1019, 0.0904, 0.0097, 0.234, 0.2758, 0.2758, 0.0124.
Corresponding to the entropy weight and the formula (7)-(14), the closeness of the 106-122 vehicles to the positive ideal solution is calculated. Results are shown in Figure 4.
[image:5.595.147.454.627.768.2]The closeness is highest when the quantity of vehicles is 107-113, considering the cost, the solution with 107 vehicles is determined. Compared with the original design, the total cost can be reduced by 6.96% and the utilization rate of the fork-lift is increased from 56.99% to 65.66%. Else, the variance for the utilization rate of equipment is reduced approximate 30%, which the balanced utilization of equipment reduces risk of equipment failure.
Summary
Compared to original optimization method, a quantitative evaluation method is applied to optimize interior assembly line. A total of 7 index such as the utilization rate of fork-lift, belt transfer lift, 90° turntable, chassis transfer lift, pit-scissor lift (in), pit-scissor lift (out), and variance of utilization rate S2 are selected to optimize interior assembly line. The weight of the 7 index is calculated by the entropy weight method. The weights of index are put into the TOPSIS method to evaluate the plans which the vehicles range from 106-122, and the optimized solution with 107 vehicles is obtained.
The cost of the optimal solution is reduced by 1.74%-6.96%. The utilization rate of the fork-lift is increased to 65.66%, which reduces the variance for the utilization rate of the equipment approximate 30%. The balanced production of the workshop is ensured. It shows the feasibility of the above method and provides a solution for interior assembly line optimization.
References
[1] Shi Y-R, Deng Y-Y and Jiang W (2009) eM-Plant simulation technology tutorial, Science Press, Beijing Hope Electronic Press, 2009 (in Chinese).
[2] Li J-Q, Pan Q-K, Suganthan P N, et al.( 2011) A hybrid tabu search algorithm with an efficient neighborhood structure for the flexible job shop scheduling problem. The International Journal of Advanced Manufacturing Technology, 52 (5-8):683-697.
[3] Zhou J-B, Fan L-Q (2012) Optimization and simulation of assembly line material distribution based on eM-Plant. Mechatronics.1007-080X, 2012, 18(06):17-20+90 (in Chinese with English abstract).
[4] Wang A-J (2012) Research on the simulation and optimization for final automobile assembly line, Beijing Jiaotong University, 2012 (in Chinese with English abstract).
[5] Zou Z-H, Yi Y and Sun J-N (2006) Entropy method for determination of weight of evaluating indicators in fuzzy synthetic evaluation for water quality assessment, Journal of Environmental sciences, 18(5), 1020-1023.