Technology (IJRASET)
Optimum Capacitor Placement for Maximum
Power Loss Reduction in Distribution System by
Using Fruitfly Algorithm
Punithavathy S 1, Ajin S 2, Jeeva M 3 Kirthana K4 1,2,3 4
PG Student [PSE], Dept. of EEE, Anna University Regional Campus, Coimbatore
Abstract- Real power loss is a major problem radial distribution system. This paper presents new methodology to optimally place capacitors in the primary feeders of the radial distribution system for maximum power loss reduction and improve voltage profile by using fruit fly algorithm. This is presented in two stages. In first stage sensitivity analysis is used to determine the optimal positions of the capacitors. In second stage the Fruit Fly optimization algorithm (FOA) is used to find the optimal capacitor size. The sizes of the capacitors corresponding to maximum loss reduction are determined. The proposed method was tested with 13 and 33 bus system and their results are presented.
Keywords-Sensitivity analysis, bus selection, Fruit Fly optimization algorithm, loss reduction NOMENCLATURE
PL - Real Power Loss
QL - Reactive Power Loss
Vi - Voltage at bus i
Vj - Voltage at bus j
Yij - Admittance at the bus i,j
j i
,
- Angle at the bus i,jKW - Kilo Watts
FOA - Fruit Fly Optimization Algorithm FL - Fuzzy Logic
I. INTRODUCTION
Radial distribution system were typically spread across large areas are responsible for major portion of total power losses in the system. Reduction of total power loss in distribution system is very important to improve the overall efficiency of the power delivery system. This can be obtained by placing the optimal value of capacitors at proper positions in radial distribution systems. For reactive power compensation capacitors are widely installed in distribution systems. The proper positioning of capacitor reduces energy loss and to improve voltage regulation. The benefits are extended by based on the size, type and number of capacitors by the optimization techniques.
For fixed load in distribution systems fixed capacitors are installed, for varying loads switched capacitors is deployed. In common practice shunt capacitor were used in primary feeder to reduce loss. The main objective of the optimal capacitor placement problem is to evaluate the optimal locations where the capacitors to be placed and optimal sizes of the capacitors. Because the total power loss in the system can be minimized by optimal capacitor placement.
The extensive amount of research work was done in the area of optimal capacitor placement, but there is still a need to develop more suitable and effective methods for the optimal capacitor placement. In this paper two stages are presented. In first stage, for the selection of location of capacitors with respect to maximum real power loss sensitivity analysis is used. It is the basic method to calculate the capacitor locations.
Technology (IJRASET)
In [1] a dynamic approach is used to optimally place the capacitor. A method to minimize the power loss is proposed [2].
In [3] it is proposed the capacitor placement problem for loss reduction by using Artificial Bee Colony Algorithm. In the first stage fuzzy logic(FL) approach is used, and in the second stage artificial bee colony algorithm is used.
II. PROBLEM FORMULATION
A. Real Power Loss In Distribution System The complex power is,
* *
Y VV Q
PL L (1)
where the real power loss is
N i N j ij j i ij j i L VVY P1 1
cos
(2) The real power loss with respect to reactive power is
L L L
P
.
P
Q
P
V
V
(3)This paper presents a method that efficiently reduces the real power loss with respect to reactive power loss by optimally locating the capacitors.
B. Sensitivity Analysis Method For Identification Of Optimal Capacitor Locations
The buses where the capacitors are to be placed with maximum impact on real power losses with respect to reactive power are determined by sensitivity analysis. Sensitivity analysis helps to reduce the search space for the optimization procedure.
V P P J J Q P L L L L L 4 3| (4)where
J
L1,
J
L2,
J
L3,
J
L4are the sub matrices of
1
T
J
.The buses are arranged in descending order according to their value calculated by above equation. The top two or three busses are selected as candidate buses where the capacitor to be placed. The control variables in the capacitor problems are generally locations and capacities of the capacitor. The sizes of the capacitors are determined by the proposed algorithm.
C. Identification Of Capacitor Size By Fruitfly Algorithm
Fruit Fly optimization algorithm (FOA) is the new technique of swarm intelligence based on the foraging behavior of fruit fly. Fruit fly has the advantage in sense organ and feeling, especially in vision and smelling. They can collect all the smell in air; even can match the food resources out of 40km. When reach the food’s location, they will fly to them directly by sense vision and the location confirmed by partner. The steps of Fruit Fly algorithm are as following.
STEP 1: Find a random location of fruit fly group.
)
2
,
1
(
*
rands
a
axis
X
)
2
,
1
(
*
rands
a
axis
Y
(5) Where a is flexible parameter.
STEP 2: Endow the personal fruit fly with random direction and location of searching food by smelling.
c
rand
b
axis
X
X
*
()
c
rand
b
axis
Y
Y
*
()
(6) Where b and c are both flexible parameter.
Technology (IJRASET)
2 2
)
1
(
)
1
(
Y
X
E
2 2
)
2
(
)
2
(
Y
X
D
(7)
E
sign
F
(
)
/
D
sign
T
(
)
/
(8)Where
is the random value between (-1, 1).STEP 4: Apply smell density decision parameters (F,T) to smell density decision function f and find out the smell density value of that personal fruit fly.
)
,
(
F
T
f
smell
(9)STEP 5: Repeating the step two to step four, and calculating the smell density value of every fruit fly in the group size, and find out the fruit fly with best and min value.
[Best smell best index]=max (Smell) (Or min (Smell)).
STEP 6: Keep the best smell density value and location parameter. Then let the group fly to that location. Best value=best smell
X-axis=X (best index) Y-axis=Y (best index)
STEP 7: Enter in the iterative optimization, and back to carry on step two to step five, and check whether the smell density value is better than the previous one, if yes, go on the step six, or carry on the step seven, until match the max iteration, the calculating finished.
III. RESULTS AND DISCUSSIONS
In this first stage sensitivity analysis is used to determine the capacitor locations. In second stage FOA is used to determine the capacitor sizes with respect to maximum real power loss with respect to reactive power.
Result of 13 bus system
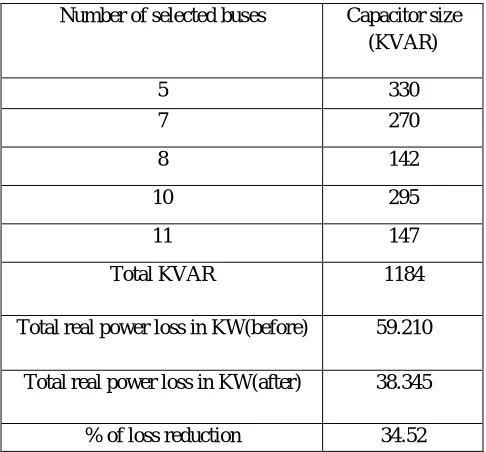
The proposed algorithm is tested with 13 bus system. Five optimal locations are identified for the 13 bus system. The capacitor sizes for each optimal locations and real power losses before and after compensations are shown in table1
Number of selected buses Capacitor size (KVAR)
5 330
7 270
8 142
10 295
11 147
Total KVAR 1184
Total real power loss in KW(before) 59.210
Total real power loss in KW(after) 38.345
[image:4.612.185.428.484.710.2]Technology (IJRASET)
From the table 1 it can be said the power loss reduce by 35% with capacitors are placed in optimal location. This reduce in power loss improve the system performance
Result of 33 bus system
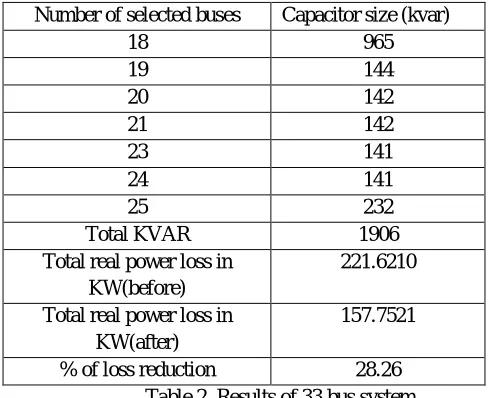
A 33 bus system is analyzed with the proposed algorithm. Seven optimal locations are identified for the 33 bus system. The capacitor sizes for each optimal locations and real power losses before and after compensations are shown in table 2
Number of selected buses Capacitor size (kvar)
18 965
19 144
20 142
21 142
23 141
24 141
25 232
Total KVAR 1906
Total real power loss in KW(before)
221.6210
Total real power loss in KW(after)
157.7521
[image:5.612.184.429.168.367.2]% of loss reduction 28.26 Table 2. Results of 33 bus system
From the table 2 it can be said the power loss reduce by 28% with capacitors are placed in optimal location. This reduce in power loss improve the system performance.
IV. CONCLUSION
In this paper a two stage method is presented for finding the optimal locations of the capacitors and sizes of the capacitor in 13 and 33 bus radial distribution system. Sensitivity analysis is used to determine the optimal capacitor locations where the capacitor to be placed and Fruit Fly algorithm is used to determine the capacitor locations to maximize the loss reduction. By placing the capacitors in optimal locations, the total real power loss is reduced significantly and voltage profile is improved by enhancing the system performance.
REFERENCES
[1] H. Duran , “Optimum number, location and size of shunt capacitors in radial distribution feeders: A dynamic programming approach”, IEEE Transactions on Power Apparatus and Systems, vol. - 87, no. 9, pp. 1769-1774, September 1968.
[2] J. J. Grainger and S.H. Lee, “Optimum size and location of shunt capacitors for reduction losses on distribution feeders” IEEE Transactions on Power Apparatus and Systems, vol. PAS- 100, no. 3, pp. 1105-1118, March 1981.
[3] Suman Zakka, M. Bhaskar Reddy, Suresh Babu Palepu “optimal capacitor placement using fuzzy and artificial bee colony algorithm for maximum loss reduction” International Journal of Scientific & Engineering Research, Volume 3, Issue 10, October-2012,ISSN 2229-5518.
[4] Jin-Man Sohn, and Jong-Keun Park, Jong-Young Park, “Optimal Capacitor Allocation in a Distribution System Considering Operation Costs”, IEEE transactions on power systems, vol. 24, no. 1, February 2009.
[5] M.E Baran and F.F Wu, “Optimal capacitor placement on radial distribution systems”, IEEE Transactions on Power Delivery, vol.4,no-1, pp. 725- 734, January 1989.
[6] Dervis karaboga, “An idea based on honey bee swarm for numerical optimization,” technical report-tr06, October, 2005.
[7] Bahriye Basturk, Dervis Karaboga, “A powerful and efficient algorithm for numerical function optimization: artificial bee colony (ABC) algorithm” J Glob Optim (2007) 39:459–471 DOI 10.1007/s10898-007-9149-x.
[8] Fuqiang Xu, Youtian Tao, “The Improvement of Fruit Fly Optimization Algorithm -Using Bivariable Function as Example” (ICCIA 2012).
[9] H. D. Chiang, G. Darling and K. N.Miu, “Capacitor placement, replacement and control in large-scale distribution systems by a GA-based two-stage algorithm,” IEEE Trans. Power Syst., vol. 12, no. 3, pp. 1160–1166, Aug. 1997.