Image Segmentation & Performance
Evaluation
Nirmal Patel#1, Rajiv Kumar*2
#
Department of Computer Science and Engineering, Maharshi Dayanand University, Rohtak, India Gurgaon Institute of Tech. & Mgmt., Gurgaon, India
Abstract—Images are widely used in all walks of life. Image use in daily needs insists upon a robust and result oriented way of analyzing images across all domains. Let it be remote sensing pictures, medical science critical image analysis, biometrics, it has proven to be indispensable to come out with a cut piece of sophisticated algorithms to dispense huge load of image processing requirements. Here we list out some of the effective ways of differentiating image pixels. Image segmentation is the way to carry out segregation of pixels as per desired criteria. Further parameters are figured out to evaluate the performance of these techniques.
Keywords—Segmentation, image processing, evaluation parameters, clustering
I. INTRODUCTION
Image is termed as a two-dimensional representation of pictures consisting of values in numerical form. In digital form, the image comprises of data premised as pixels at the lowest level. Pixels are the smallest individual element in an image, holding finite, discrete, quantized values that represent the brightness, intensity or gray level at any specific point. [1]
Image processing refers to the analysis of the image and
obtaining desired results. Medical science image
interpretation, remote sensing pictures, face recognition, pattern matching are among useful applications of image processing. Image segmentation, morphological operations, edge detection, image enhancement and restoration are several operations in image processing. [2]
We have categorized the paper in four sections. First section brings in light the concept of image segmentation. Second section presents various segmentation techniques used these days. Third section describes the performance evaluation parameters for the segmentation algorithms. Fourthly, the paper is concluded with a note of revisit.
II. IMAGE SEGMENTATION
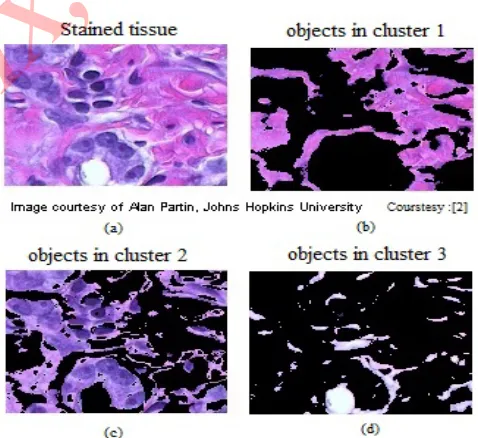
Image segmentation is a primary process of image analysis in any situation. It is a process of subdividing an image into constituents regions or objects so that the minute details of the image are read or analyzed. [3] Whether one has to classify
stained cells in a tissue or dislocation of constituent areas depending upon vegetation in an image of a big city taken from space, image segmentation is the most useful tool available in MATLAB image processing product.
[image:2.612.318.557.396.615.2]III. SEGMENTATION TECHNIQUES
There exist many different types of segmentation techniques in literature but there is no particular method which can be applied on different types of images which would generate same result. Algorithm development for one class of images may not always be applied to other class of images [3]. There is a constant challenge to develop a general segmentation algorithm that could address a large section of issues concerned with edges, clustering of pixels, region similarities, pixel classification depending on desired criteria. Here we present some of the most widely used methods for segmentation..
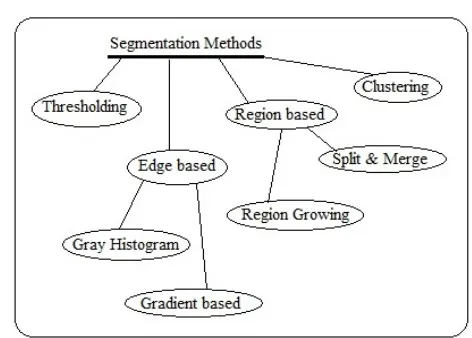
A. Thresholding
Thresholding method proposes the use of a threshold value set by the administrator. If a pixel value lies is equal to or greater than the threshold value the pixel could be picked up else left. It implies the picked pixel constitutes the foreground and the left ones form the background part of the image.[1] This operation could be classified as local, global and adaptive application. The local thresholding refers to use of threshold values over small region. Global thresholding is considered when intensity variation of object and background is conviniently distinct. Further if the threshold value is depending upon the spatial co-ordinates, adaptive thresholding could be used. Histogram shape-based, entropy-based, spatial methods and local methods are some algorithms based on thresholding.[4].
B. Edge Based
The pixels reflecting abrupt change in intensity are known as edge pixels. These pixels define different regions in the image. For detecting these pixels two techniques are used namely, Gray Histogram Technique and Gradient Based Method. These methods require a balance between detecting accuracy and noise immunity in practice. In the former method, segmentation is done on the basis of a threshold value. Firstly depending upon the color or intensity a histogram is calculated from the entire pixel in the image, and then edges are located on the basis of contours and valleys in image are located [5]. While in the latter one, convolving gradient operators with the image is applied. Gradient is defined as change in magnitude in the image while traversing from one end to another. If the gradient magnitude is high, then there is a possibility of rapid transition from one region to another. Then these are pixels which form edges and linking of these edges is done to form closed boundaries to
result regions. In these methods commonly used edge detection operators used in gradient based method are Sobel, Prewitt and Roberts. Thus, edge detection algorithms are suitable for images that are simple and noise-free as well often produce missing edges or extra edges on complex and noisy images.
C. Region Based
Region based segmentation refers to the way of forming regions in the image based on some seed pixels. Seed pixels are the main pixels to which other pixels belonging to the same region must adhere to in terms of gray level within a certain threshold range..
2) Split and Merge: For the merge and split process blocks of 16X16 pixels size are taken. If the max-min difference of a block is near by the max-min difference of its neighbors, then the blocks are merged . A threshold value is required for this purpose. This threshold defines which blocks can be merged into a particular block and which others could be split into smaller blocks based on the difference between the maximum and minimum intensities in every block. A block is split in partial if the max-min difference of the block outstands the threshold. The process is pulled over recursively until, no blocks satisfy the conditions to be split or merged. Thus a block whose max- min variance exceeds the threshold will continue to be split until the max-min variance of the subsequent block(s) are within the threshold. There needs to be the lower check on upto what extent the blocks to be splitted. In case this is specified the algorithm remains consistent and doesn't take a chance to retire into unwanted situation producing awkward results. This could be done by specifying the smallest block dimensions that could be generated through splitting.
D. Clustering
Clustering is the way of grouping a set of objects in such a way that objects in the same group called a cluster, are more similar in some sense or another to each other than to those in other groups or clusters.
A cluster is therefore a collection of objects which are
“similar” between them and are “dissimilar” to the objects
belonging to other clusters. An image can be grouped based on keyword (metadata) or its content (description). A variety of clustering techniques have been introduced to make the segmentation more effective.
1) K-Means Clustering: In K-means algorithm data vectors are grouped into predefined number of clusters. At the beginning the centroids of the predefined clusters is initialized randomly. The dimensions of the centroids are same as the dimension of the data vectors. Each pixel is assigned to the cluster based on the closeness, which is determined by the Euclidian distance measure. After all the pixels are clustered, the mean of each cluster is recalculated. This process is repeated until no significant changes result for each cluster mean or for some fixed number of iterations. [9].
Steps :
K clusters are formed by partitioning the dataset and the data points are randomly assigned to the clusters resulting in clusters that have roughly the same number of data points.
For all data point the distance from the data point to each cluster is calculated.
Leave the data point where it is only if it closes to its own cluster. If the data point is not close to its own cluster, shift it into the closest cluster.
Repeat the above step until a complete pass
through all the data points‘ results in no data point
moving from one cluster to another cluster. On this point the clusters are stable and the clustering process ends
2) Fuzzy C-Means Clustering: The fuzzy clustering method is devised to confront the real situations when some issues may erupt due to partial spatial resolution, intensity of
overlapping, poor contrast, noise and intensity in
homogeneities. Taking into consideration the two main clustering strategies - the hard and the fuzzy clustering, fuzzy clustering scheme is a soft segmentation method and has been generally studied and successfully applied in image clustering and segmentation. Due to robust characteristics for ambiguity and can retain much more information than hard segmentation methods. Fuzzy c-means (FCM) algorithm is most popularly used than other fuzzy clustering techniques[10].
Steps :
Set values for c, m and e. Where 'c' is number of clusters, 'm' is fuzzy factor and 'e' is stopping condition.
Do initialization of fuzzy partition matrix.
Set the loop counter b.
Calculate the c cluster centers.
Calculate the membership matrix.
Fig. 2 Image segmentation methods
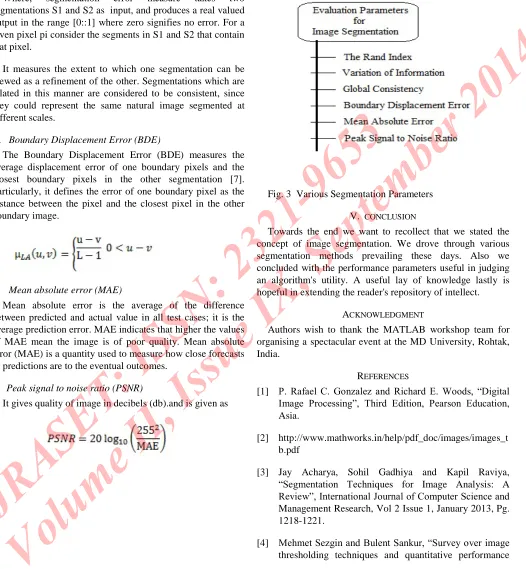
IV. EVALUATION PARAMETERS
Having segmentation evaluation measures is an efficient way to analyze the performance of existing and future algorithms. Segmentation evaluation metrics can be divided into boundary –based and region –based methods. Before one gets to know the performance of an algorithm, knowing comprehensively the definitions of these metrices is inevitable. Various performance parameters used for evaluation of image segmentation are as follows.
A. The Rand index (RI)
Rand index counts the fraction of pairs of pixels who’s labeling are consistent between the computed segmentation and the ground truth averaging across multiple ground truth segmentation [6]. The Rand index or Rand measure is a measure of the similarity between two data clusters. Given a set of n elements and two partitions of S to compare, we define the following(a), the number of pairs of elements in S that are in the same set in X and in the same set in Y. (b), the number of pairs of elements in S that are in different sets in X and in different sets in Y. (c), the number of pairs of elements in S that are in the same set in X and in d ifferent sets in Y.( d), the number of pairs of elements in S that are in different sets in X and in the same set in Y The Rand index I is,
Where, a + b is the number of agreements between X and Y and c + d is the number of disagreements between X and Y. The Rand index has a value between 0 and 1, with 0 indicating that the two data clusters do not agree on any pair of points and 1 indicating that the data clusters are exactly the same.
B. Variation of Information (VOI)
The Variation of Information (VOI) metric defines the distance between two segmentations as average conditional entropy of one segmentation given the other, and thus measures the amount of randomness in one segmentation which cannot be explained by the other [6]. Suppose we have two clustering (a division of a set into several subsets) X and Y where is:
Then the variation of information between two clustering
Where, H(X) is entropy of X and I(X, Y) is mutual information between X and Y. The mutual information of two clustering is the loss of uncertainty of one clustering if the other is given. Thus, mutual information is positive and bounded by
C. Global Consistency Error (GCE)
Where, segmentation error measure takes two segmentations S1 and S2 as input, and produces a real valued output in the range [0::1] where zero signifies no error. For a given pixel pi consider the segments in S1 and S2 that contain that pixel.
It measures the extent to which one segmentation can be viewed as a refinement of the other. Segmentations which are related in this manner are considered to be consistent, since they could represent the same natural image segmented at different scales.
D. Boundary Displacement Error (BDE)
The Boundary Displacement Error (BDE) measures the average displacement error of one boundary pixels and the closest boundary pixels in the other segmentation [7]. Particularly, it defines the error of one boundary pixel as the distance between the pixel and the closest pixel in the other boundary image.
E. Mean absolute error (MAE)
Mean absolute error is the average of the difference between predicted and actual value in all test cases; it is the average prediction error. MAE indicates that higher the values of MAE mean the image is of poor quality. Mean absolute error (MAE) is a quantity used to measure how close forecasts or predictions are to the eventual outcomes.
F. Peak signal to noise ratio (PSNR)
[image:6.612.53.579.115.684.2]It gives quality of image in decibels (db).and is given as
Fig. 3 Various Segmentation Parameters
V. CONCLUSION
Towards the end we want to recollect that we stated the concept of image segmentation. We drove through various segmentation methods prevailing these days. Also we concluded with the performance parameters useful in judging an algorithm's utility. A useful lay of knowledge lastly is hopeful in extending the reader's repository of intellect.
ACKNOWLEDGMENT
Authors wish to thank the MATLAB workshop team for organising a spectacular event at the MD University, Rohtak, India.
REFERENCES
[1] P. Rafael C. Gonzalez and Richard E. Woods, “Digital
Image Processing”, Third Edition, Pearson Education,
Asia.
[2] http://www.mathworks.in/help/pdf_doc/images/images_t
b.pdf
[3] Jay Acharya, Sohil Gadhiya and Kapil Raviya,
“Segmentation Techniques for Image Analysis: A
Review”, International Journal of Computer Science and
Management Research, Vol 2 Issue 1, January 2013, Pg. 1218-1221.
evaluation”, Journal of Electronic Imaging 13(1), 146– 165 (January 2004).
[5] Vishal B. Langote and Dr. D. S. Chaudhari,
“Segmentation Techniques for Image Analysis”,
International Journal of Advanced Engineering Research and Studies (IJAERS)/Vol. I/ Issue II/January-March, 2012.
[6] Vijay Kumar Chinnadurai, Gharpure Damayanti
Chandrashekhar,” Improvised levelset method for
segmentation and grading of brain tumors in dynamic contrast susceptibility and apparent diffusion coefficient
magnetic resonance images”, International journal of engineering science and technology , vol.2(5), 2010, 1461-1472.
[7] S.L.A Lee, A.Z.Kouzani, E.J.Hu,” Empirical Evaluation
of segmentation algorithms for lung modeling”, 2008
International conferences on systems, man and cybernetics (SMC 2008).
[8] Allan Hanbury, Julian Stottinger,” On segmentation
evaluation metrics and region count”.
[9] Monika Xess and S.Akila Agnes”, Survey On Clustering Based Color Image Segmentation And Novel
Approaches To Fcm Algorithm”, IJRET: International
Journal of Research in Engineering and Technology eISSN: 2319-1163 pISSN:2321-7308.