Comparison: KNN & SVM Algorithm
Dr.Amita Goel1, Saarthak Mahajan2
1
Associate Professor in Department of Information Technology, Maharaja Agrasen Institute of Technology)
2
Department of Information Technology Maharaja Agrasen Institute of TechnologySector-22, Rohini, New Delhi-110086, India
Abstract: The importance of image classification in the field of Machine Learning cannot be understated. Specifically, the use of algorithms such as KNN and SVM are the core engines behind the proper functioning of an Optical Character Recognition (OCR). The field of character recognition has been long researched for some decades and today, it is possible to create production grade technologies with high level accuracy. As the computational power has increased over the years, the quality of pattern recognition systems has also gone up. There are many classification algorithms. In this paper, we discuss the comparison of two classification algorithms – K-Nearest-Neighbors (KNN) and Support Vector Machines (SVM). We shall discuss the characteristics of both the algorithms. We shall also weigh the pros and cons of each of these and finally arrive at a conclusion on which one has higher performance. We shall discuss the performance characteristics of each algorithm based on their learning curve, comparing their accuracy on different categories of the English alphabet. It is observed that SVM has a higher accuracy rate than KNN.
Keywords: Machine Learning, K-Nearest-Neighbors, Support vector machine.
I. INTRODUCTION
The ability to recognize and classify objects by humans is an important application of the power of human sight. It’s been many decades since the research on how to incorporate this power into computers. This is done with the help of Machine Learning algorithms used for classification of characters. This power is implemented with the concept of Optical Character Recognition (OCR). As the names suggests, it deals with their cognition of characters that are optically processed. OCR has various applications in today’s world – License Plate Detection, Pattern Recognition etc. It considerably helps to improve the interaction between humans and machines. It incorporates – Image Classification, labelling of objects or images into pre-defined categories. Although easy for humans, it is not so easy to implement Image classification in machines. It requires use of complex algorithms – KNN, SVM to correctly classify the unlabelled data. One of the most important tasks in OCR is to recognize documents electronically. For past many years, huge amount of research has been done on printed recognition. A highly accurate system of any recognition system is dependent on proper functioning of all several elements such as optimized detection and classification, high speed and resolution cameras.
In this paper, we discuss the strengths and short-comings of K-NN and SVM that have been widely used. We also identify areas in these algorithms which could be improved for higher accuracy. In the end, performance parameters such as Level of Accuracy gives the final verdict on both of them.
II. ENGLISH ALPHABET CHARACTER SET
Figure 1: English alphabet character Set
The modern English alphabet is a Latin alphabet consisting of 26 letters (each having an uppercase and a lowercase form) [1]. It consists of five vowels – A, E, I, O, U and the rest 21 alphabets are consonants. Compound characters may be a combination of consonant and vowel or consonant and consonant. The words become difficult to recognize as a result.
The OCR system first separates the segmented characters (alphabets) which are then examined and reviewed in isolation with the
A B C D E F G
H I J K L M N
only the use of uppercase characters. It is believed that English as a language is spoken by more than a billion people on the earth at one time [2]. The exact shape of printed letters varies depending on the typeface (and font). The shape of handwritten letters can differ significantly from the standard printed form (and between individuals), especially when written in cursive style.
III. CLASSIFICATION
Classification is the problem of identifying to which of a set of categories a new observation belongs, on the basis of a training set of data containing observations (or instances) whose category membership is known in machine learning and statistics.For example, putting email into "spam" or "non-spam" classes or assigning a diagnosis to a given patient as described by observed characteristics of the patient (gender, blood pressure, presence or absence of certain symptoms, etc.). Classification is an example of pattern recognition. In the terminology of machine learning, classification is considered an example of supervised learning, i.e. learning where a training set of correctly identified observations is available. The corresponding unsupervised procedure is known as clustering, and involves grouping data into categories based on some measure of similar characteristic or distance. An algorithm that implements classification, especially in a concrete implementation, is known as a classifier. The term "classifier" sometimes also refers to the mathematical function.
Supervised learning [7] is the machine learning task of inferring a function from labelled training data. The training data consist of a set of training examples. In supervised learning, each example is a pair consisting of an input object (typically a vector) and a desired output value (also called the supervisory signal). A supervised learning algorithm analyses the training data and produces an inferred function, which can be used for mapping new examples. An optimal scenario will allow for the algorithm to correctly determine the class labels for unseen instances. This requires the learning algorithm to generalize from the training data to unseen situations in a "reasonable" way.
A. K-Nearest Neighbour (KNN)
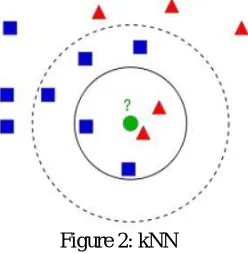
[image:3.612.247.371.398.525.2]KNN is one of the simplest of classification algorithms available for supervised learning. The idea is to search for closest match of the test data in feature space. We will look into it with below image.
Figure 2: kNN
In the image, there are two families, Blue Squares and Red Triangles. We call each family as Class. Their houses are shown in their town map which we call feature space. (We can consider a feature space as a space where all data is projected. For example, consider a 2D coordinate space. Each data has two features, x and y coordinates. We can represent this data in your 2D coordinate space. If there are three features, you need 3D space. Now consider N features, where you need dimensional space. This N-dimensional space is its feature space. In our image, we consider it as a 2D case with two features. Now a new member comes into the town and creates a new home, which is shown as green circle. He should be added to one of these Blue/Red families. We call that process, Classification. One method is to check its nearest neighbour. From the image, it is clear it is the Red Triangle family. So it is also added into Red Triangle. This method is called simply Nearest Neighbour, because classification depends only on the nearest neighbour.
it all changes with value of k. If k = 4, it has 2 Red and 2 Blue neighbours. We come across a stalemate tie. So it is preferable take k as an odd number. Hence, this method is called k-Nearest Neighbour since classification depends on k nearest neighbours.
B. Support Vector Machine (SVM)
In machine learning, support vector machines [3][4] (SVMs, also support vector networks) analyse data used for classification and regression analysis. Given a set of training examples, each marked as belonging to one or the other of two categories, an SVM training algorithm builds a model that assigns new examples to one category or the other.
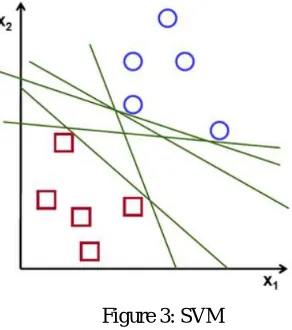
[image:4.612.225.371.213.378.2]The image below which has two types of data, red and blue. In kNN, for a test data, we used to measure its distance to all the training samples and take the one with minimum distance. It takes plenty of time to measure all the distances and plenty of memory to store all the training-samples.
Figure 3: SVM
Our main goal is to find a line that uniquely divides the data into two regions. Such data which can be divided into two with a straight line (or hyperplanes in higher dimensions) is called Linear Separable. In above image, plenty of such lines are possible. Intuitively, the line should be passing as far as possible from all the points because there can be noise in the incoming data. This data should not affect the classification accuracy. Hence, a farthest line will provide more immunity against noise. Hence, SVM finds a straight line (or hyperplane) with largest minimum distance to the training samples.
Figure 4: Hyperplane in SVM
We need training data to find this decision boundary. In the image above, the training data are the shapes filled up with colour. This training data is support vector and the lines passing through them Support Planes.
IV. COMPARISON BETWEEN KNN AND SVM
[image:4.612.241.364.459.596.2]approach is used mostly used in multiclass classification. When it comes to One-vs-All approach, we have to train as many SVMs as there are classes of unlabelled data. As in the other approach, we give the unknown pattern to the system and the final result if given to the SVM with largest decision value.
Although, SVMs look more computationally intensive, once training of data is done, that model can be used to predict classes even when we come across new unlabelled data. However, in KNN, the distance metric is calculated each time we come across a set of new unlabelled data. Hence, in KNN we always have to define the distance metric. SVMs have two major cases in which classes might be linearly separable or non -linearly separable. When the classes are non-linearly separable, we use kernel function such as Gaussian basis function or polynomials.
Hence, we only have to set the K parameter and select the distance metric suitable for classification in KNN whereas in SVMs we have to select the R parameter (Regularization term) and also the parameters for kernel if the classes are not linearly separable.
Figure 5: Example KNN OCR
When we talk about accuracy of both of the classifiers, SVMs usually have higher accuracy than KNN as shown. [5][6][8]
Classifier Training Set
Test Set Accuracy rate (in %)
SVM 10,000 10,000 98.9
KNN 10,000 10,000 96.47
TABLE 1: Accuracy of Classifiers
While conducting the tests in visual studio after incorporating the libraries of OpenCV, the accuracy percentage for SVM [6] was found to be 94% and for KNN [5] it was 93%.
V. CONCLUSION
The results and observations show that SVMs are a more reliable more of classifiers. However, KNN is less computationally intensive than SVM. Since, KNN is easy to implement, the classification of Multi-class data should be done with kNN. The algorithm that guarantees reliable detection in unpredictable situations depends upon the data. If the data points are heterogeneously distributed, both should work well. If data is homogenous to look at, one might be able to classify better by putting in a kernel into the SVM. For most practical problems, KNN is a bad choice because it scales badly - if there are a million labelled examples, it would take a long time (linear to the number of examples) to find K nearest neighbours.
VI. ACKNOWLEDGMENT
I would like to thank Dr. Amita Goel for her immense help and support, useful discussions and valuable recommendations.
REFERENCES [1] https://en.wikipedia.org/wiki/English_alphabet
[2] https://en.wikipedia.org/wiki/Modern_English [3] https://en.wikipedia.org/wiki/Support_vector_machine
[4] https://en.wikipedia.org/wiki/Support_vector_machine#Modern_methods
[5] https://docs.opencv.org/3.0beta/doc/py_tutorials/py_ml/py_knn/py_knn_opencv/py_knn_opencv.html - 93.22 [6] https://docs.opencv.org/3.0beta/doc/py_tutorials/py_ml/py_svm/py_svm_opencv/py_svm_opencv.html- 94 [7] https://en.wikipedia.org/wiki/Supervised_learning