R E S E A R C H
Open Access
Localization and abundance analysis of human
lncRNAs at single-cell and single-molecule
resolution
Moran N Cabili
1,2,3*†, Margaret C Dunagin
4†, Patrick D McClanahan
4, Andrew Biaesch
4, Olivia Padovan-Merhar
4,
Aviv Regev
1,5†, John L Rinn
1,3*†and Arjun Raj
4*†Abstract
Background:Long non-coding RNAs (lncRNAs) have been implicated in diverse biological processes. In contrast to extensive genomic annotation of lncRNA transcripts, far fewer have been characterized for subcellular localization and cell-to-cell variability. Addressing this requires systematic, direct visualization of lncRNAs in single cells at single-molecule resolution.
Results:We use single-molecule RNA-FISH to systematically quantify and categorize the subcellular localization patterns of a representative set of 61 lncRNAs in three different cell types. Our survey yields high-resolution quantification and stringent validation of the number and spatial positions of these lncRNA, with an mRNA set for comparison. Using this highly quantitative image-based dataset, we observe a variety of subcellular localization patterns, ranging from bright sub-nuclear foci to almost exclusively cytoplasmic localization. We also find that the low abundance of lncRNAs observed from cell population measurements cannot be explained by high expression in a small subset of‘jackpot’cells. Additionally, nuclear lncRNA foci dissolve during mitosis and become widely dispersed, suggesting these lncRNAs are not mitotic bookmarking factors. Moreover, we see that divergently transcribed lncRNAs do not always correlate with their cognate mRNA, nor do they have a characteristic localization pattern.
Conclusions:Our systematic, high-resolution survey of lncRNA localization reveals aspects of lncRNAs that are similar to mRNAs, such as cell-to-cell variability, but also several distinct properties. These characteristics may correspond to particular functional roles. Our study also provides a quantitative description of lncRNAs at the single-cell level and a universally applicable framework for future study and validation of lncRNAs.
Background
Deep-sequencing based studies have revealed thousands of long non-coding RNAs (lncRNAs) expressed from mammalian genomes. While a number of studies have implicated functional roles lncRNAs [1-3] the vast ma-jority remain uncharacterized [4,5]. Even very basic properties such as subcellular localization or absolute abundance in single cells remain unknown.
Knowledge of lncRNA subcellular localization patterns can provide fundamental insights into their biology and fosters hypotheses for potential molecular roles. Unlike mRNAs, which produce proteins, lncRNA themselves must localize to their particular site of action, making their location within the cell important. For instance, ex-clusively nuclear localization would argue against puta-tive lncRNAs encoding short peptide sequences, because translation occurs in the cytoplasm. Further, localization to particular areas within the nucleus may suggest differ-ent functionalities - for instance, finding a lncRNA pri-marily in the nucleus near its site of transcription may suggest that it regulates transcription of a proximal gene
(that is, regulation in cis or regulation of proximal loci
in three dimensions) [6-8]. Sequencing studies cannot
* Correspondence:[email protected];[email protected];
†Equal contributors
1
Broad Institute of MIT and Harvard, 7 Cambridge Center, Cambridge, MA 02142, USA
4
School of Engineering and Applied Science, University of Pennsylvania, Philadelphia, PA 19104, USA
Full list of author information is available at the end of the article
discriminate these possibilities, and so there is as yet no systematic categorization of lncRNA localization patterns.
The absolute abundance of lncRNAs in single cells is also subject to debate, but has critical implications for the stoichiometry of molecular mechanisms. On the whole, the expression of most lncRNAs tends to be lower than that of mRNA [9], and so their total abun-dance is likely far lower than that of proteins, which greatly restricts the number of sites at which a lncRNA may be active. One hypothesis [10] is that despite a low average abundance of lncRNAs, small numbers of cells in the population may express high numbers of lncRNA, thereby allowing for an increased number of sites of ac-tion in those cells. This hypothesis, however, has not yet been subjected to rigorous examination.
RNA fluorescence in situ hybridization (RNA FISH)
[11,12] is an approach that can address these questions and suggest potential mechanisms for lncRNA activity. Indeed, direct observation of lncRNA localization by RNA FISH led to many of the early hypotheses about lncRNA function that now serve as paradigms in the field. An early example is the lncRNA XIST [13,14], a key regulator of X inactivation [15], in which RNA FISH demonstrated that XIST accumulates on the in-active X-chromosome [6,7]. Other more recent examples include MALAT1, NEAT1, and MIAT (Gomafu) which are localized to nuclear bodies [16-20] and the lncRNA GAS5 which shuttles between the nucleus and cyto-plasm [21]. One notable early study surveyed lncRNA expression in brain at tissue level resolution using these
in situ hybridization techniques [22]. These examples
are, however, among the mostly highly abundant RNAs in the cell, whereas the vast majority of lncRNAs are considerably less abundant [9], precluding the use of conventional RNA FISH techniques that have relatively low sensitivity.
More recently, researchers have developed and applied single molecule RNA FISH techniques based on hybridization of multiple short, fluorescently labeled, oligonucleotide probes [23,24] to estimate the absolute level and subcellular localization of even low abundance lncRNAs [8,25-31]. Single-cell correlations between a lncRNA and its puta-tive mRNA target (simultaneously monitored with two differently colored fluorescent dyes) can suggest poten-tial regulatory interactions [27,32]. For instance, com-bining correlation analysis with subcellular localization revealed that lncHOXA1 represses the neighboring
Hoxa1 gene incisin a subpopulation of cells, a finding
made possible by directly visualizing lncRNA activity at the site of transcription [8].
Yet, no study has systematically applied single molecule RNA FISH to explore lncRNA localization and abundance from cDNA and RNA-seq catalogs, such as those in [9,33-38]. Furthermore, no study has systematically tackled
the unique technical challenges posed by performing sin-gle molecule RNA FISH on lncRNAs, which are shorter, lower abundance and more likely to contain repeats than mRNA [9,39].
Here, we used single molecule RNA FISH in single cells to characterize the sub-cellular localization patterns and abundance of 61 lncRNAs across three human cell types. We focused on the subclass of intergenic lncRNAs (lincRNAs) [40] from our well-annotated Human lincRNA Catalog [9], and systematically selected a subset spanning a wide range of tissue specificity and expression levels while encompassing both syntenically orthologous lincRNAs [9,37] and divergently transcribed lincRNAs [9,35,41-43].
Our first observation was that lncRNA FISH is prone to artifacts (likely owing to low abundance and repetitive nature of lncRNAs), and so we established a pipeline for rigorous validation of single molecule RNA FISH probe sets. Once established, this approach allowed us to ad-dress several fundamental questions about lncRNA biol-ogy. First, lncRNAs exhibited a wide range of subcellular localization patterns, including distinct categories of nu-clear localization, with most lncRNAs showing stronger nuclear localization than most mRNAs. In most cases, these localization patterns were consistent across the three different cell types tested. Second, we found that the low abundance of lncRNAs in bulk population mea-surements is not due to a small subpopulation of cells expressing lncRNAs at high-levels, and overall lncRNA are no different than mRNA in their levels of cell-to-cell heterogeneity. Third, we found that in mitotic cells, lncRNAs do not associate with chromatin, showing that (at least for the examined cases) retention at specific regulatory regions through mitosis is likely not a mech-anism of mitotic inheritance. Finally, simultaneous analysis of matching pairs of divergently transcribed lncRNAs and mRNAs showed that these pairs are not always co-regulated and that the localization patterns of divergently transcribed lncRNA do not differ from those of other lncRNAs. Taken together, these finding describe
the fundamental properties of lncRNA’s cell-to-cell
ex-pression variability and establish a canonical set of pat-terns of lncRNA localization.
Results
A single molecule, single cell RNA FISH survey of lncRNAs in three human cell types
fibroblasts (hLFs), or HeLa cells, the target cell lines for our study; (2) the lncRNAs span a wide range of expression levels and tissue specificity (Additional file 1: Figure S1; Additional file 2); (3) the set includes a subset of 43 lncRNAs that have an expressed syntenic ortholog in
mouse; and (4) the set includes a subset of 16 lincRNAs that are transcribed divergently to a neighboring mRNA (within 10 KB). These criteria and subsets are not mutually exclu-sive (Figure 1b). Finally, we included 16 previously studied lncRNAs as a point of reference. We also included two Divergent Neighbors
lncRNA Coding gene
Human - Mouse Syntenic Orthologs
Human Mouse
Tissue Specificty
Specific lncRNA
Ubiquitous lncRNA
lncRNA selection RNA FISH in 3 cell types Probe Validation
Test for RNA FISH signal
Two-color test for specificity
a
b
Invalid: quantitative inconsistency
Valid probe set
Single-color labeling
lincRNA target
Odds/evens dual-color labeling
Invalid: qualitative inconsistency odds evens full probe
HeLa
0 10 20 30
Number of RNA molecules per cell Full probe
set Two-color colocalized
hLF hFF
Syntenic ortholog Divergent neighbor Tissue Specificty
Expression across tissues
(RNA-Seq)
Analyzed ?
HeLa hLF hFF SkeletalMuscle Thyroid Kidney Heart Ovary Adipose Lung Prostate Colon LymphNode Adrenal WhiteBloodCells Breast Liver Testes Brain Placenta H1-hESC H1-NSC iPS odds evens colocalized mRNAs
lincRNAs
lncRNAs by FISH
−5 0 5 10
0 0.05
0.1
log2 FPKM HeLa
Density
Expression range
0 20 40 60
Full probe set
Two-color colocalized
Number of RNA molecules per cell
Yes No signal Invalid
lncRNAs
0.1 0.4
[image:3.595.58.538.93.568.2]0 0.4
Figure 1An RNA-FISH survey of lncRNAs. (a)Study workflow.(b)Key features of 61 lincRNAs for which probe sets were successfully designed
different groups of mRNA controls (Additional file 3; 34 in total): (1) nine mRNAs transcribed divergently to
those ‘divergent lncRNAs’ in this study the cyclin CCNA2
as a marker of cell cycle; and (2) 24 mRNAs that span a wide range of expression levels in hFF (Padovan-Merhar and Raj, personal communication).
To visualize single lncRNA molecules directly inside of cells, we used an established protocol for single molecule RNA FISH [24], where we design 10 to 48 complementary DNA oligonucleotides, each 20 bases long and labeled
with a single fluorophore at its 3′end (Figure 1a). When
these probes hybridize to a single RNA molecule, the con-centration of so many fluorophores at a single location renders the RNA molecule detectable by fluorescence microscopy. When applied to mRNAs, this method has typically been proven highly specific, as signal is only de-tectable when a large fraction of the probe set hybridizes to the target [24], and is highly accurate as gauged by quantitative polymerase chain reaction (qPCR) [44-48]. We successfully designed probe sets for 61 lncRNAs in hFFs, hLFs, and HeLa cells (Methods; Additional file 3), 53 of which yielded a detectable signal in at least one cell type. In all of the hybridizations we performed, we co-stained for CCNA2 mRNA, a cyclin whose transcripts are present only in S/G2/M, thus providing us with cell cycle information for the cells we imaged.
During the course of our investigations, we noticed that performing RNA FISH on lncRNAs presented a major challenge due to off-target binding of oligonucleotides. Even a single oligonucleotide binding to a highly abundant off-target RNA can lead to spurious signals, problems
exacer-bated by lncRNAs’ higher repeat content [39] (leading to
more potential off-targets) and typically lower abundance than mRNAs [9] (making off-target binding more notice-able). For example, we noticed images of a particular lncRNA with similar localization patterns to MALAT1; however, removal of just one oligonucleotide from the probe pool with homology to MALAT1 resulted in complete loss of the dominant signal (Additional file 1: Figure S2a).
To control for these‘rogue’oligonucleotides with
off-target signal, we used a two-color co-localization ap-proach [23,24] in which we analyzed each lncRNA after
partitioning its probe set into two subsets (‘even’and‘odd’
oligonucleotides), each labeled with a differently colored fluorophore (Figure 1a; Additional file 1: Figure S2b-d; Methods). If the oligonucleotides in the probe set were binding specifically, the signals from these two subsets should largely co-localize (for example, Figure 1a middle; Additional file 1: Figure S2b), with the number of co-localized spots roughly equaling those obtained from the
full probe set (‘quantitative consistency’; Figure 1a right;
Additional file 1: Figure S2d). If a single oligonucleotide hybridizes to a highly abundant off target, we would see the signal only in either the odd or even channel (see for
example Figure 1a right or Additional file 1: Figure S2c for
an‘invalid’probe set targeting). Note that for mRNA, the
presence of nuclear bright foci of off-target signal is less of a concern than for lncRNA because they seldom display such bright foci without also exhibiting very large num-bers of cytoplasmic RNA, whereas for lncRNA, we have found several examples for which the legitimate signal can take on this pattern (for example, Xist, Kcnq1ot1 [6,28]). We also observed cases in which the number of spots in the full probe set differed dramatically from the number of co-localized spots, potentially indicating some other
non-specific background (‘quantitative inconsistency’,
Figure 1a right; Additional file 1: Figure S2c).
Using the ‘two-color co-localization’ validation, we
eliminated 19 probe sets from further analysis, as they had major qualitative or quantitative differences in the two color co-localization assay, underscoring the import-ance of testing for off-target effects for lncRNA FISH (Figure 1a; Additional file 1: Figure S2d-e and Figure S21; Additional file 4). Another eight probe sets had no discernible signal in any of the three examined cell types. We were unable to attribute the cases of no detectable signal or co-localization inconsistencies to low number of oligonucleotides and observed a very slight bias toward lower abundance lncRNAs (Kruskal-Wallis one
way analysis of variance P <8.4X10⁻³; Additional file 1:
Figure S3). Importantly, our validation approach was re-quired in each cell type investigated, as some probes were valid in one cell type but not in another (Additional file 1: Figure S4). Upon further checking for quantitative consistency (Methods; Additional file 1: Figure S1a, Figure S2e, Figure S21; Additional file 4), we were left with 70 lncRNA-cell type pairs with valid signal, corresponding to 34 unique lncRNAs (Additional file 4; Additional file 1: Figure S22). Altogether, we acquired over 2,000 images overall in three to five separate fluorescence channels, with two to three biological replicates per gene-cell pair (the final analysis included 80, 24, and 28 cells per gene on average, for HeLa cells, hLFs, and hFFs, respectively).
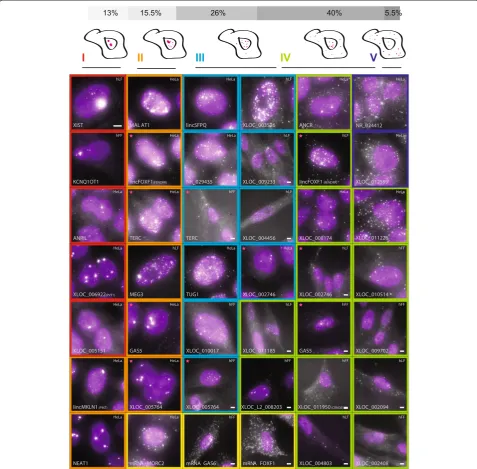
lncRNAs exhibit a diversity of localization patterns composed of a few basic characteristics
observe bright accumulations of lncRNA in the cytoplasm. These features did not manifest independently -for instance, the presence of nuclear foci was typically associated with more nuclear than cytoplasmic spots. Thus, we classified the lncRNA into the following types: (Methods; Additional file 5): (I) one or two large foci in the nucleus (nine pairs); (II) large nuclear foci and single molecules scattered through the nucleus (11 pairs); (III)
[image:5.595.58.536.90.559.2]predominantly nuclear, without foci (18 pairs); (IV) cyto-plasmic and nuclear (28 pairs); and (V) predominantly cytoplasmic (four pairs). Validating our approach, 11 of the 12 lncRNA previously imaged by RNA FISH [6,19,21,25,49-56] showed patterns that were consistent with previous reports (Additional file 3). These included the large nuclear foci previously observed for XIST and Kcnq1ot1 [6,7,51], localization of GAS5 to both the
Figure 2LncRNAs exhibit a variety of cellular localization patterns.Florescence micrographs of representative expressing cells for each of 34
lncRNAs with a validated probe set. LncRNA-cell pairs are classified to cellular localization types I to V as described in the Methods (marked by their border color). Magenta stars mark five lncRNAs that are presented in two different cell types and two different classes (see same row for
comparison). Scale bar, 5μm; when a scale bar is not specified, reference the scale bar within the top left image. Top panel: fraction of each
0 0.2 0.4 0.6 0.8 1
Nuclear fraction of spots
Meg3 : hLF XLOC−005764 : hela lincSFPQ : hela TERC : hela XLOC−003526 : hLF lincSFPQ : hFF lincFOXF1 : hela XLOC−006922 : hela lincMKLN1−A1 : hela lincSFPQ : hLF XLOC−006922 : hLF XLOC−010017 : hFF XLOC−010017 : hela lincMKLN1−A1 : hFF TUG1 : hela NR−029435 : hFF XLOC−006922 : hFF GAS5 : hela NR−029435 : hLF Anril : hela NR−029435 : hela lincFOXF1 : hFF XLOC−002746 : hela XLOC−009233 : hLF TERC : hFF XLOC−005764 : hFF XLOC−009233 : hFF GAS5 : hLF XLOC−008174 : hela Kcnq1ot1 : hFF XLOC−011185 : hLF XLOC−L2−008203 : hela lincFOXF1 : hLF XLOC−008174 : hLF GAS5 : hFF XLOC−002094 : hLF XLOC−L2−008203 : hFF XLOC−011226 : hela Kcnq1ot1 : hLF XLOC−L2−008203 : hLF XLOC−011950 : hela XLOC−004803 : hFF XLOC−011185 : hFF XLOC−008174 : hFF ANCR : hela XLOC−002746 : hLF XLOC−011950 : hFF NR−024412 : hela XLOC−003526 : hFF XLOC−005764 : hLF XLOC−009702 : hLF XLOC−010017 : hLF Anril : hFF XLOC−009702 : hFF XLOC−004803 : hLF XLOC−012599 : hela XLOC−004456 : hLF XLOC−010514 : hFF XLOC−012599 : hFF XLOC−010514 : hLF ANCR : hFF XLOC−005151 : hela NR−024412 : hFF XLOC−002408 : hFF
a
0 20 40 60 80 100 120 0
0.2 0.4 0.6 0.8 1
Median spot count
Nuclear fraction Not divergent Divergent
c
0 20 40 60 80 100 120 0
0.2 0.4 0.6 0.8 1
Median spot count
Nuclear fraction No ortholog
Ortholog
d
Median spot count
Nuclear fraction
b
0 20 40 60 80 100120 0
0.2 0.4 0.6 0.8 1
I
II
III
IV
V
mRNA
XIST MEG3 XLOC_006922 (PVT1)
XLOC_005151
XLOC_005764 ANRIL
[image:6.595.59.538.87.690.2]e
nucleus and cytoplasm [21] and the speckle- and para-speckle-like structures of MALAT1 and NEAT1, re-spectively [19,49].
The majority of lncRNAs (55% classified as class I to III; 38 lncRNA-cell type pairs) are predominantly in the nucleus (Additional file 1: Figure S3a and b; Methods; compared to 1/49 of mRNAs using the I to III classifica-tion criteria of more than 65% of molecules in the nu-cleus), with approximately 13% of lncRNA-cell type pairs mainly located in one or two large foci (type I). As noted, we also observed two distinct types of nuclear localization patterns: (1) localization to tight foci in the nucleus (for example, XLOC_006922, XLOC_005764);
and (2) a more diffuse but spatially ‘speckled’ pattern
(for example, MALAT1, MEG3, XLOC_003526). Interest-ingly, using simultaneous imaging of MALAT1, MEG3, and XLOC_003526 by labeling each target with different fluorescent dye in hLFs and hFFs, we find that the three
lncRNA share a‘speckle like’localization pattern, and a
significant fraction of MEG3 molecules co-localize with MALAT1 (statistically significant overlap in approxi-mately 80% of cells examined; Additional file 1: Figure S6, Methods; Additional file 5).
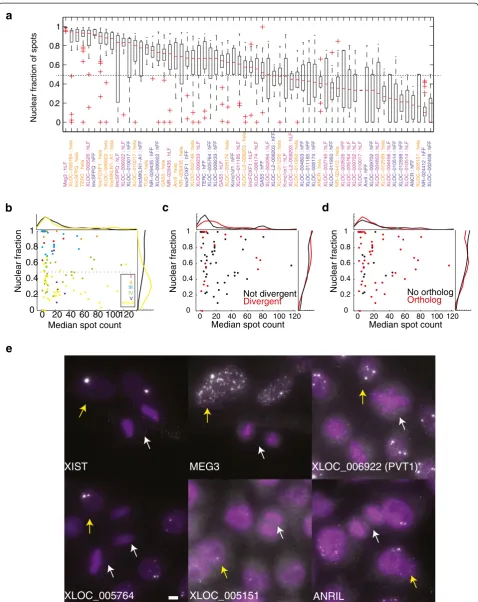
The bias toward nuclear localization was significant compared to localization of mRNAs (67% of lncRNAs vs. 10% of mRNAs have more than 50% of their RNA in the
nucleus; Kolmogorov Smirnov (KS)P<13×10-11; Figure 3a
and b). Within the lncRNA set, divergent lncRNAs pre-sented a slightly higher bias toward nuclear localization
(KS P <2.12×10⁻²; effect size = 0.35; Figure 3c) while
syntenic orthologs did not present such bias over the lncRNA background distribution. The latter set did, however, exhibit a slight bias toward higher expression
(KSP<3.25×10⁻³; Figure 3d).
In the vast majority (85%) of cases, the lncRNA localization pattern was consistent across the cell types where data were available. The notable exceptions were five lncRNAs (lincFOXF1, TERC, XLOC_005764, GAS5, XLOC_002746) that displayed distinct patterns in at least two cell types. These differences, however, appeared mostly to result from differences in overall abundance that likely leads to the appearance of additional bright foci in the nucleus (Figure 2, magenta stars, Additional
file 1: Figure S7, S8, S9; Additional file 5). For example, we identified large lncRNA foci for TERC and XLOC_ 005764 in HeLa cells (type II), where they are more abundant (approximately 81 and 22 molecules per cell, respectively) than in hFFs (type III, approximately 17 and 4 molecules per cell, respectively), where these foci are missing. Similarly, GAS5 has dominant nuclear foci in HeLa cells (type II, approximately 195 molecules per cell), and less frequent foci in fibroblasts, where its ex-pression is lower (type IV, approximately 75 molecules per cell). In other cases, higher abundance was associ-ated with the appearance of RNA in the cytoplasm as well. For example, lincFOXF1 was more abundant in fi-broblasts than in HeLa cells, where it more frequently appears in the cytoplasm (type IV in fibroblasts vs. type II in HeLa cells; Additional file 1: Figure S8).
We next applied single molecule RNA FISH for a few of our lncRNAs on tissue sections [57,58] to test whether the localization patterns we observed in cultured cells were consistent with the patterns found in intact tissues. We selected MALAT1, NEAT1, and PVT1 (XLOC_006922), which have orthologous expressed transcripts in mouse, and performed single molecule RNA-FISH in both mouse embryonic stem cells (mESCs) and mouse neonatal car-diac/kidney tissue (Methods). For each of these lncRNAs, we observe the same unique focal nuclear pattern across species (that is, in both HeLa cells and mESCs) and in the mouse tissue (Additional file 1: Figure S10; Methods), showing that the patterns we observed in cultured cells
re-capitulate what we observedin vivo.
lncRNAs do not persist at nuclear foci during mitosis The appearance of bright nuclear foci of specific lncRNAs raised the question of whether these foci persist through mitosis; persistence at the target locus through mitosis could suggest that lncRNA play a role in potential mechanisms for the maintenance of epigenetic states through cell division. To address this question, we ex-amined the staining in mitotic cells of six lncRNA that exhibit nuclear specific localization patterns (approxi-mately 50% of such cases).
None of the lncRNA we examined exhibited nuclear foci in cells undergoing mitosis (Figure 3e; Additional (See figure on previous page.)
Figure 3Most lincRNAs are predominantly localized to the nucleus. (a)Boxplots describing the distribution of the fraction of molecules
localized to the nucleus (Y axis) for each validated lncRNA-cell pair (X axis, orange: HeLa, blue: hFF, purple: hLF). Red bar: medians. Whiskers are
at 1.5* the inner quartile range.(b)Scatter plot of the relationship between expression level (X axis; median number of molecules per cell) and
nuclear localization (Y axis, median fraction of nuclear spots across all expressing cells). Each data point is one gene-cell pair and is colored by its classification to the localization classes I to V (Methods) of Figure 2. mRNA sets 1 to 2 (yellow) serve as a reference. Histograms on top and right
are the distribution of all lncRNAs- (black) and mRNA- (yellow) cell pairs.(c)Scatter and histograms as in (b) but for lncRNA with (red) or without
(black) a divergently transcribed mRNA counterpart.(d)Scatter and histograms as (b) but for lncRNA with (red) or without (black) a syntenic
ortholog.(e)Representative image of mitotic cells (marked with white arrows) lacking foci that are seen in interphase cells (marked with yellow
a
d
(1) XLOC_006922 (PVT1)
(3) XLOC_003526 (4) CCNA2 (coding)
(2) FOXF1 (coding)
0 1-4 4-7 7-10 10-13 13-16 16-19 19-22 22-25 25-28 28-31 31-34 34-37 37-40 40-43 43-46 46-49 49-50 50-60 60-70 70-80 80-90 90-100 100-110 110-120 120-130 130-140 140-150 150-160 160-170 170-180 180-190 190-200 200-210 210-220 220-230 230-240 240-250 250-260 260-270 270-280 280-290 290-300 >300
Id
Meg3 HLF
GAS5 HeLa
lincFOXF1 HLF
TERC HeLa
GAS5 HLF
GAS5 HFF
lincFOXF1 HFF
ANCR HeLa
lincFOXF1 HeLa
TUG1 HeLa
lincSFPQ HeLa
XLOC_011226 HeLa
XLOC_011950 HeLa
XLOC_L2_008203 HFF
XLOC_L2_008203 HLF
XLOC_012599 HFF
lincSFPQ HFF
XLOC_006922 HeLa
XLOC_011950 HFF
XLOC_012599 HeLa
NR_024412 HeLa
NR_024412 HFF
XLOC_005764 HeLa
XLOC_011185 HLF
lincSFPQ HLF
TERC HFF
XLOC_005764 HLF
XLOC_006922 HFF
XLOC_006922 HLF
ANCR HFF
NR_029435 HLF
NR_029435 HeLa
NR_029435 HFF
XLOC_L2_008203 HeLa
XLOC_003526 HLF
XLOC_004803 HLF
XLOC_008174 HeLa
XLOC_009233 HLF
XLOC_010514 HFF
XLOC_011185 HFF
lincMKLN1_A1 HeLa
XLOC_002094 HLF
XLOC_008174 HLF
XLOC_008174 HFF
XLOC_004803 HFF
XLOC_010514 HLF
XLOC_009233 HFF
XLOC_009702 HFF
XLOC_010017 HeLa
XLOC_002746 HLF
XLOC_005764 HFF
XLOC_009702 HLF
XLOC_010017 HFF
Anril HeLa
Kcnq1ot1 HLF
lincMKLN1_A1 HFF
Kcnq1ot1 HFF
XLOC_002408 HFF
XLOC_010017 HLF
Anril HFF
XLOC_002746 HeLa
XLOC_004456 HLF
XLOC_005151 HeLa
XLOC_003526 HFF
Bin size =10 Bin size =3
0 20 40 60 80 0
1 2 3 4 5 6
7XLOC_006922− HeLa
0 100 200 300 400 0
1 2
3 FOXF1− hLF
0 50 1 00 1 50 0
5 10 15 20
25 XLOC_003526− hLF
0 50 1 00 1 50 2 00 2 50 0
2 4 6 8 10
12 CCNA2− hLF
e
(1) (2)
(3) (4)
b
c
0 50 100 150
0 0.5 1 1.5 2 2.5 3 3.5 4
0 50 100 150
−50 0 50 100 150 200
Mean
Median
Mean
CV
(2)
(1)
(3) (4)
(4)
(3)
(1) (2)
lncRNAs mRNA set 1 mRNA set 2
Molecule count
Number of cells
Number of cells
Molecule count
[image:8.595.55.547.86.699.2]Molecule count Molecule count
file 5). (The potential foci we observed in approximately one-third of ANRIL mitotic cells were not validated when using two-color co-localization; Additional file 5). Notably, for five of the lncRNAs, including XIST, we ob-served some molecules spread throughout the cytoplasm during mitosis (consistent with previous observations for XIST [6]). In the case of XLOC_001515 we did not ob-serve any lncRNA molecules whatsoever during mitosis. Thus, we found no evidence for mitotic retention of these lncRNA to the nuclear foci they inhabit during interphase.
The extent of cell-to-cell variability in lncRNA expression is similar to that of mRNAs
When measured in bulk cell populations, lncRNAs are typically expressed at low levels compared to mRNAs [4,9]. Several studies have hypothesized that these bulk measurements may obscure an extreme cell-to-cell het-erogeneity in which lncRNA are expressed very highly in a small fraction of cells, but lowly or not at all in most others cells, resulting in average low expression [10,59]. We tested this hypothesis by quantifying the cell-to-cell variability of the lncRNAs in our panel.
We first confirmed that the average (cell population) expression level estimates for our lncRNAs were gener-ally consistent between RNA FISH and RNA-Seq
(Pear-son r = 0.55; P value <2.5×10⁻⁶; Additional file 1), with
discrepancies possibly due to the high variability in RNA-Seq abundance estimates for some of the examined transcripts (Additional file 1: Figure S11). We observed
even higher consistency with qPCR (Pearson r = 0.788,P
value <3.96×10⁻³, in comparison to Pearson r = 0.579
when comparing RNA-Seq on the same subset of genes; Additional file 1: Figure S12; Methods), as also reported by others [44-48].The distribution of single cell counts demonstrated the relatively low overall expression of lncRNAs, with 43% of lncRNA-cell pairs having 10 or fewer molecules per cell on average and with a median of 14 molecules across all gene-cell-pair distribution
medians (vs. 36 for the 49 mRNA-cell pairs we exam-ined) (Figure 4a).
We also checked whether any of our lncRNAs showed evidence for G1 or S/G2/M dependent expression by simultaneously measuring the cyclin CCNA2 transcript count in every image we obtained, which is high in the S, G2, and M phases of the cell cycle [60,61]. We identi-fied two lncRNAs whose expression positively correlated with CCNA2 (lincSFPQ and XLOC_001226), and one negatively correlated (XLOC_011185), (Additional file 5; Additional file 1: Figure S13), suggesting that expression of these lncRNAs was regulated through the cell cycle. Still, for the majority, any variability we observed was not due to variability in cell cycle phase.
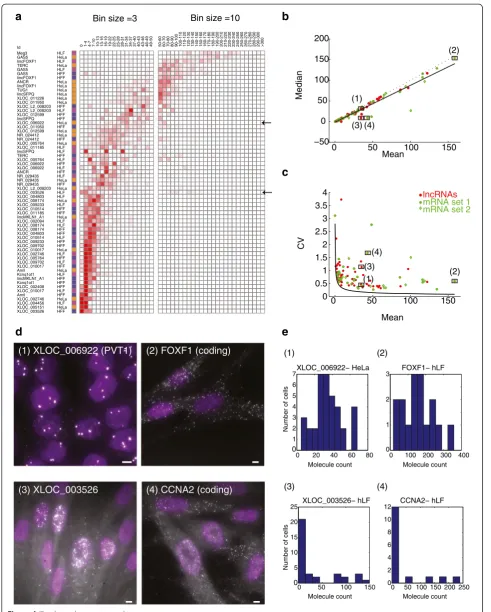
In most cases, cell-to-cell variability in lncRNA levels was similar to that of protein coding mRNAs expressed at comparable average levels and did not reveal the presence of low frequency, highly expressing cells (Additional file 1; Figure 4c). In particular, the mean and the median mol-ecule counts were similar, highlighting the lack of outlier cells in the single cell distributions (Additional file 1: Methods; Figure 4b; Additional file 1: Figure S9; Pearson
r = 0.98, P value <2.5×10-39). One notable exception was
the tissue specific lncRNA XLOC_003526 encoded from a poorly conserved 900 Kb gene desert (Figure 4d, e): it is lowly expressed on average (FPKM <1 in a population of hLF RNA-Seq, with few, if any, spliced reads; Additional file 1: Figure S14), but in RNA-FISH approximately 25% of the cells express it highly (107 +/- 26 molecules on average), whereas the other cells express it very lowly (9 +/- 1.2 molecules on average). Its expression did not correlate with CCNA2, suggesting that its variability is not related to cell cycle.
Since we only obtained a few dozen cells for most of the lncRNA-cell line pairs examined (due to limited im-aging throughput), we could not rule out the possibility of a particularly rare cell with extraordinarily high ex-pression levels. To increase our statistical power, we im-aged 500 to 700 cells for each of four lncRNA in HeLa (See figure on previous page.)
Figure 4Cell-to-cell variability does not appear to explain the low abundance of the lncRNAs in our survey. (a)Distribution of RNA
single molecules counts (bins, columns; Red intensity: fractional density of molecule counts across the population) for the 64 lncRNA-cell pairs in the validated set that are quantitative (rows, Methods). Cell type color coding: orange - HeLa, blue - hFF, purple - hLF. Left bins are sized 3 (0 to 50 molecules ), where right in bins are sized 10 (50 to 300 molecules). A heterogeneously expressed lncRNA (XLOC_003526) and a homogenously
expressed lncRNA (XLOC_006922), are pointed by black arrows and referenced in figures b and c.(b, c)The relationship between the mean
molecule count (X axis) vs. median molecule count (Y axis, b) or vs. variability in molecule counts (Y axis, coefficient of variation, c) for the 64 lncRNA-cell pairs in the quantitative validated set (red), mRNA set 1 (green circles; Methods) and mRNA set 2 (green diamonds; Methods). A linear regression line in b (black) supports the consistency of the majority of transcript-cell pairs with a unimodal distribution (Y = 0.87X-1.25, Pearson r = 0.96). Dotted line is Y = X. Black curve in (c) is the theoretic Poisson distribution. Four transcripts marked (1 to 4) are analyzed further in d and
e. LncRNA pairs with mean >170 (less than 10% of all pairs) are not presented, but show a similar pattern on a log scale.(d)Fluorescence
micrographs of single molecule RNA FISH of a homogenously expressed lncRNA (1-XLOC_006922; top left) and mRNA (2-FOXF1; top right) and of a heterogeneously expressed lncRNA (3- XLOC_003526; bottom left) and mRNA (4 - CCNA2; bottom right). XLOC_003526 and CCNA2 are
both heterogeneous but do not correlate with each other based on co-staining in two colors. Scale bar, 5μm.(e)Molecule count distributions
Divergent Neighbors
lncRNA Coding gene
a
c
NR_029435 HeLa lincMKLN1 HeLa
GAS5 HeLa TUG1 HeLa
lincFOXF1 hLF
XLOC_011950 hFF
XLOC_010514 hLF
XLOC_009233 hLF
hLF
lincFOXF1 hFF
XLOC_010514 hFF
XLOC_0119501 hLF
XLOC_009233 HeLa
NR_029435 HeLa
TUG1
HeLa
lincMKLN1 HeLa
GAS5
b
0 200 400
0 5 10 15 20
lncRNA
coding mRNA
GAS5: Hela TUG1: Hela NR_029435: Hela
0 10 20
0 200 400 600
lncRNA
coding mRNA
XLOC_010514: hLF
0 100 200
0 100 200 300
lncRNA
coding mRNA
XLOC_011950: hFF
0 100 200 300 0
100 200 300 400
lncRNA
coding mRNA
lincFOXF1: hLF
lincMKLN1: Hela
r =0.91 r =0.84 r =−0.04
r =0.44
0 10 20 30
0 5 10
lncRNA
coding mRNA
XLOC_009233: hLF
r =0.12
0 50 100
0 10 20 30 40
lncRNA
coding mRNA
r =0.215
0 50 100 150 0
50 100 150
lncRNA
coding mRNA
r =0.4
0 20 40
0 20 40 60
lncRNA
coding mRNA
[image:10.595.59.539.90.651.2]r =0.406
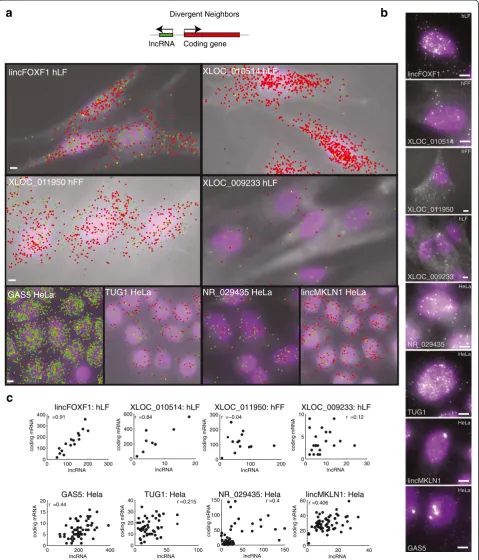
Figure 5Cellular localization of divergent lincRNAs and their neighbors. (a)Two-color overlay micrograph presenting florescence probes
targeting the lincRNA (green) and coding neighbor (red). Co-localized spots are marked yellow. The lincRNA and cell type are marked on the
image. Scale bar, 5μm; marked on the left most image. Top: illustration of the positional genomic orientation of a divergent lincRNA and its
coding gene neighbor.(b)Representative fluorescence micrographs as shown in Figure 2 for the lincRNAs in a. Scale bar, 5μm.(c)Scatter plots
of the relationship in each cell between the expression level of the lincRNA (X axis, molecule count) and that of its neighboring coding gene
(Y axis). Pearson correlation coefficients (r) after removal of outliers (Additional file 1) are denoted on top. Data in(a-c)are presented for eight of
cells (Additional file 1: Figure S15), including XLOC_ 004456, which displayed no signal in HeLa in our initial assessment. None of these images revealed the presence of any highly expressing outlier cells. With a sample size of n = 500 cells, we can place an upper bound of 0.6% of cells that may express high levels of the lncRNA but went undetected in our assay with a statistical power of 0.95 (Additional file 1).
Cellular localization and expression correlation of divergently transcribed lncRNA-mRNA transcript pairs We have previously distinguished a subset of lincRNAs
that are transcribed divergently from protein coding genes’
promoters (approximately 500, approximately 13% of human lincRNAs [9,35]; Figure 5a), but are stable,
proc-essed and spliced. One hypothesis is that these ‘
diver-gent’ lncRNAs are co-regulated with their neighbors
and possibly have a regulatory effect on their neighbor at the transcription site [35,62], with bulk assays observ-ing co-expression of divergent transcripts [35,42,43,62]. To look for correlations at the single cell level and potential localization to the site of transcription, we simultaneously measured abundance and localization of divergent lncRNA and their mRNA neighbor for eight of the nine candidate divergent lncRNAs for which we had valid probe sets (Figure 5; Additional file 5).
We observed that in most cases (7/8) the bi-directionally promoted lncRNAs were not simply localized at one or few foci (characteristics of type I; likely to be the site of transcription), but rather were located throughout the cell (Figure 5a and b; Additional file 1: Figure S16). For example, RNA from XLOC_011950 and XLOC_010514 were substantially cytoplasmic and showed no nuclear foci (type VI). NR_029435, TUG1, and XLOC_009233 RNA were mostly nuclear but with no apparent foci (type III). Lastly, lincMKLN1 (type II; also known as PINT [63]), lincFOXF1 (also known as FENDRR [64]), and GAS5 (type II and VI) RNA were all present as nu-clear foci in some cell types. Substantial numbers of lincFOXF1and GAS5 RNA were also found outside these foci and in the cytoplasm. Together, the subcellu-lar localizations displayed by divergent lncRNAs were distinct from each other, and were not qualitatively dif-ferent from those of the other lncRNAs in our survey.
We also observed a spectrum of correlation and expres-sion levels of the lncRNA and its neighboring protein cod-ing gene (Figure 5c). Both lincFOXF1 and XLOC_010514 tightly correlated with their neighbors in hLFs (Pearson r = 0.91, 0.84, respectively). XLOC_011950 and its neigh-bor are positively correlated in HeLa cells, but did not correlate in hFFs, where they were still expressed to the same extent on average (Figure 5c; Additional file 1: Figure S17). NR_029435 and GAS5 were positively corre-lated with their neighbors in HeLa cells (Pearson r = 0.4
and 0.44, respectively), although it is possible that these relatively mild correlations resulted from a generic cor-relation with cellular volume (Padovan-Merhar and Raj, personal communication). We note that there was no correspondence between the existence of an expression correlation between the lncRNA and its neighbor and a particular subcellular localization pattern. Taken to-gether, while the divergent lncRNA in this study shared a common genomic layout, no consistent pattern of localization nor co-expression levels with their neigh-boring coding gene emerged.
Discussion
In this study, we applied single molecule RNA FISH to quantitatively characterize the expression and localization of 34 lncRNAs chosen to span diverse characteristics at the single cell and subcellular level in three human cell types (overall, 70 gene-cell pairs). Our analysis provides a quantitative framework, important controls, and consider-ations for analyzing fundamental properties of lncRNAs by RNA FISH. Using this approach, we have shown that
lncRNAs’localization patterns are formed of combinations
of a set of archetypical localizations, including a variety of predominantly nuclear localization patterns. These patterns suggest the possibility that these particular lo-calizations correspond to functional categories. We also found that they express in a mostly uniform manner from cell to cell, and do not remain attached to chro-mosomes during mitosis.
While single molecule RNA FISH has the potential to be a very powerful technique for the analysis of lncRNA, our results emphasize that one must exercise extra cau-tion in this applicacau-tion of the technology. We found that
the background resulting from one ‘rogue’
oligonucleo-tide binding off target can often resemble legitimate lncRNA signal patterns, such as nuclear foci. For an mRNA, typically, the vast majority of the RNA is cyto-plasmic; thus, counting any suspect nuclear foci will not greatly affect the overall quantification. However, for many legitimate lncRNAs, it is precisely this sort of nu-clear staining pattern that may be of interest, making it difficult to ignore such signals. In general, we have not found particular rules for which oligonucleotides lead to this background, and hopefully future bioinformatics al-gorithms can limit these issues, perhaps by further refin-ing strategies to avoid repetitive elements which may be transcribed at high levels. Regardless, our extensive trou-bleshooting and validation strategies strongly suggest that two-color validation of lncRNA FISH probe sets is crucial to ensuring the validity of RNA FISH signals.
distinguish different subnuclear patterns. (The cytoplas-mic lncRNA we observed did not show any readily dis-cernable patterns.) One commonly observed pattern was bright, tightly localized nuclear foci (approximately 30% of our set), which may be consistent with a role for these lncRNAs in chromatin regulation [5], as shown for XIST [15], KCNQOT1 [51], AIR [65], and other lncRNA in-volved in imprinting [66]. These were likely localized to the transcription site itself, potentially during transcrip-tional bursts [67], and did not persist during mitosis.
The pattern we observed for MEG3 was one reminis-cent of MALAT1, which is known to localize to nuclear speckles and was shown to affect various cellular pro-cesses [16]. This pattern was almost solely nuclear, and
showed a ‘clumping’ that may indicate association with
specific nuclear bodies [68]. MEG3 is an imprinted lncRNA which is downregulated in many types of can-cers and previously hypothesized to function as a tumor suppressor in a mechanism that is still not well under-stood [69-71]. Interestingly, co-staining for these two lncRNA showed that a substantial and significant frac-tion of MEG3 molecules co-localized with MALAT1 (Additional file 1: Figure S6). These results suggest the possibility that MEG3 and MALAT1 are functionally re-lated, showing the potential for our image-based ap-proach to reveal relationships between lncRNAs that would not be apparent through other methods.
Our single cell analysis suggests that - at least for the set we examined - the low abundance of lncRNAs in bulk cell population was most likely not a result of high expression
in a small subset of ‘jackpot’cells as previously
hypothe-sized [10,59]. Overall, the extent of cell-to-cell variability of lncRNAs resembled that of mRNA expressed at similar levels. Although in some cases the number of imaged cells is low, we nevertheless observe a relatively homogenous expression of few molecules per cell (Figure 4). This conclusion is bolstered by our analysis of over 500 cells for a few representative lncRNAs. Some lncRNA (not-ably XLOC_003562, expressed at approximately 110 molecules per cell in approximately 25% of the cells) display high levels of variability, but this is within the range of variability also observed for mRNAs, and the frequency of positive cells was not particularly low. We cannot definitively rule out the possibility that very rare
‘jackpot’cells exist, but they are not necessary to explain
the average expression in bulk assays. One interesting observation, however, was two rare daughter cells, prob-ably resulting from asymmetric division of HeLa cells, which contain high levels of NR_029435 (Additional file 1: Figure S18). It is hard to know if this finding has bio-logical meaning, or was just a symptom of cytobio-logical abnormalities in cultured HeLa cells.
While almost all divergent transcription results in short unstable transcripts [41-43,72,73], we and others
have reported over 500 lincRNAs that are transcribed di-vergently to protein coding genes [9,35,62]. We exam-ined eight of these pairs in detail, wondering if they exhibited any features that may distinguish this class of lncRNA. We found a variety of characteristics, with var-ied abundances and localizations ranging from almost exclusive nuclear foci to broadly cytoplasmic. Moreover, correlations with the neighboring genes revealed some potential regulatory interactions for a few of the lncRNA in our set, but no general rule emerged; indeed, a recent model suggests that divergent transcription may be a mechanism for evolving new, functionally unrelated genes [74] rather than signifying a regulatory mechanism per se. Overall, our results suggest that these lncRNA may have a variety of functions despite their common genomic layout.
Conclusions
Collectively, our study highlights important differences and similarities between lncRNAs and mRNAs, includ-ing a characterization of the subcellular localization of lncRNAs. This study further provides a workflow for ap-plying single molecule RNA FISH to study lncRNA. The rich set of localization patterns we observe suggest a broad range of potential functions for lncRNA and high-lights specific lncRNAs for future mechanistic studies.
Methods
Design and synthesis of RNA FISH probe sets
We designed oligonucleotides sets using software avail-able through Stellaris Probe Designer [75]. Since the software avoids sequence elements deemed to cause high levels of background, it can sometimes result in only a limited number of potential oligonucleotides tar-geting a particular RNA. As a conservative choice, we only included in the actual screen those lncRNAs for which we had at least 10 designed oligonucleotides. Additional file 3 contains all the oligonucleotide se-quences used in this study.
We ordered all Stellaris™-type oligonucleotides from
Biosearch Technologies, but instead of a dye on the 3′
end of the oligonucleotide, we ordered oligonucleotides
with an amine group on the 3′end, to which we coupled
Cell culture, tissue collection, and RNA FISH
We cultured human foreskin fibroblasts (CRL-2097, ATCC), human lung fibroblasts (IMR-90, ATCC), and HeLa cells (gift from the lab of Phillip Sharp, MIT) in
Dulbecco’s modified Eagle’s medium with Glutamax
(DMEM, Life Technologies), supplemented with 10% fetal bovine serum, Penicillin and Streptomycin. We grew the cells in 2-well chambered coverglass (Lab Tek). We washed cells with 1x phosphate buffered saline (PBS) and then fixed them in 3.7% formaldehyde in 1X PBS for 10 min at room temperature. After fixation, we washed the cells twice with 1X PBS and then perme-abilized them in 70% ethanol at 4°C at least overnight or until we performed RNA FISH staining.
We collected tissue sections following a modified ver-sion of the protocols described in [57,58]. Briefly, tissue harvested from neonatal mice was immediately flash-frozen in OCT (optimal cutting temperature compound) in liquid nitrogen. We stored frozen tissue blocks at -80°C prior to sectioning. Five micron thick sections were cut at -20°C and adhered to positively charged slides. Imme-diately after sectioning, we washed tissue sections briefly with 1X PBS and fixed in 3.7% formaldehyde for 10 min. Following fixation, we washed twice with 1X PBS and then submerged slides in 70% ethanol for permeabilization and storage of tissue at 4°C until per-forming RNA FISH.
We performed RNA FISH staining as previously de-scribed [24,76]. Briefly, we washed cells with a solution of 10% formamide in 2X sodium citrate buffer (SSC), then applied the appropriate amount of probe in a hybridization solution containing 10% formamide, 2X SSC, and 10% dextran sulfate (w/v). Hybridization was allowed to occur overnight in a humid chamber at 37°C. Cells were then washed twice for 30 min at 37°C with 10% formamide in 2X SSC. DAPI was applied during the second wash. Cells were then rinsed twice with 2X SSC before imaging.
Imaging
After performing RNA FISH, we imaged the cells on a Nikon Ti-E inverted fluorescence microscope using a Plan Apochromat 100X objective and a cooled CCD camera. We acquired around 25 to 30 optical slices at
0.3μm intervals, thereby covering the entire vertical
ex-tent of the cell. As described previously, we used band-pass filters specifically for these channels that have essentially no signal crossover [61], and acquired succes-sive image stacks for DAPI (nuclear stain), each fluores-cence channel targeted with an RNA FISH probe. We also acquired images in a fluorescence channel with a 488 nm excitation (similar to fluorescein/Alexa 488); this channel has no probe in it, and thus reveals the degree of autofluorescent background in the sample.
Image analysis
Image analysis was performed using custom software written in Matlab (The Mathworks, Natick, MA, USA) as previously described [24]. Briefly, images were first manually segmented to define cellular boundaries by using a custom user interface. Images were then proc-essed with a linear filter akin to a Laplacian-of-Gaussian to remove non-uniform background and to enhance par-ticulate signals. RNA particles in each channel were then identified in a semi-automated manner by selecting an intensity threshold above which a spot is considered an RNA particle. Specifically, the threshold was computa-tionally estimated (and then manually confirmed or ad-justed) by identifying a plateau in the graph comparing the intensity threshold (X axis) and total particles above that threshold (Y axis; Additional file 1: Figure S19). The accuracy of this threshold may vary from RNA to RNA depending on the quality of the signal, but we generally believe that our spot detection algorithms are typically accurate to within 10% [67] for the following reasons. First, our numbers match well with absolute RT-qPCR [44-47]. Second, when we label two parts of the same RNA molecule with different colors and then look for co-localization, we typically see very strong co-localization of roughly 95% or more [48,77]. We then determined each
spot’s intensity by fitting a two-dimensional Gaussian to
the spot signal and obtaining amplitude. Finally, we deter-mined which spots co-localize across channels following
the methods outlined in Levesqueet al.[77] in a two stage
process: first, we find spots that co-localize within a rela-tively large spatial window, then we use those co-localized spots to register the two images (correcting for any shifts between channels) and run the co-localization again, but this time with a smaller window. We ignored spots that co-localized with spots identified in the GFP channel (which represent auto-fluorescent background). Details re-garding subsequent analysis steps are described in the fol-lowing sections.
Validation of probe sets by two-color co-localization To validate each probe set we used a two-color co-localization approach similar to that previously described [23,24]. Briefly, we partitioned each probe set to the even-and odd- numbered oligonucleotides even-and coupled each subset with a different fluorophore (evens with Alexa 594, odds with Cy3). We then hybridized the two probe sets and imaged each color.
To determine the total number of RNA particles above background signal in each color we pursued the follow-ing procedure. First, we determined the total number of particles imaged in each cell using the full probe set
coupled to Alexa 594 (termed the ‘single-colored probe
set’), using the previously described, semi-automated
(Additional file 1: Figure S19). We also estimated the distribution of particle counts for the single-colored
probe set and its mean mi. Next, for every cell in the
two-color co-localization dataset we selected the xi
par-ticles with the highest signal for each of the
even-numbered and odd-even-numbered probe subsets, wherexi=
max (50, 5*mi). We then calculated the number of
co-localized spots among these xispots from each color in
every cell. Finally, we determined the distribution of the number of co-localized spots for each probe set across cells. We only consider the co-localized spots as repre-senting a true mRNA particle in each channel when we analyze images acquired in the two-color assay.
We applied this analysis to every probe set in each of the three cell types (HeLa, hLF, hFF) in which it displayed a signal. A probe set was considered invalid in a specific cell type if there was either (Figure 1a, Additional file 1: Figure S2d): (1) a qualitative difference between the localization pattern obtained using one color channel vs. the other; or (2) a quantitative differ-ence defined as a statistically significant differdiffer-ence in the distribution of the number of co-localized particles and
the single-color probe set particles (P <0.05,
Mann-Whitney U rank sum test). The remaining cell-probe set pairs were considered valid and images acquired with the full-single-colored probe set were used for all subse-quent analyses. Manual examination recovered 14 add-itional borderline cases in which the clear pattern seen in one cell type was similar to that in a different cell type for which the two color and single color assays were con-sistent. The specific classifications and distribution com-parisons are specified in Additional file 4 and Additional file 1: Figure S21.
For many of the two-color experiments it was impos-sible to robustly determine the total number of mRNA particles in each channel using the plateau method [24] used for the single-colored probe set (Additional file 1: Figure S19b). This is likely due to the smaller number of oligonucleotides that actually hybridize to the target when using only half the probe set, resulting in a lower contrast between the real signal and background [24]. The ap-proach we used above to evaluate the number of co-localized spots does not rely on the plateau method and is not sensitive to the selection of an intensity threshold.
Localization to the nucleus
Nuclear localization of a spot was heuristically deter-mined based on co-localization with DAPI after consid-ering the maximal signal across all z-stacks. We determined nuclear localization by two approaches that yielded similar results: (1) the percent of spots across
the entire cell population localized to the nucleus (‘
mol-ecule level’); or (2) the percent of cells in which more
than 50% of the spots were localized to the nucleus (‘cell
level’). Classification of a gene as predominantly nuclear
was estimated based on the‘cell level’approach by
calcu-lating the fraction of nuclear spots for each cell, and then taking the median across this distribution.
Each lncRNA:cell-type pair was assigned to one of the following classes: (I) one or two large foci; (II) both large foci and single molecules scattered through the nucleus; (III) predominantly nuclear (without foci); (VI) cytoplas-mic and nuclear; and (V) predominantly cytoplascytoplas-mic.
Assignment was performed with the following steps: (1) For each lncRNA-cell pair we calculated the fraction of nuclear spots for each cell, and then determined the median of that distribution. (2) LncRNA-cell pairs with a median fraction of nuclear spots >0.65 were then manually assigned to classes I, II, or III, by manual in-spection of the images and visual recognition of large foci. (3) LncRNA-cell pairs with a median fraction of nu-clear spots <0.35 and an average spot count >20 were classified as V. The selection of a spot count threshold was made in order to be conservative when classifying to V. (4) All other cases were classified as IV. (5) Finally, we reassigned two borderline cases to IV (lincFOXf1-hFF and XLOC_011950-(lincFOXf1-hFF, median nuclear fraction of 0.67, 0.35 respectively), since we were unable to manu-ally identify specific cells that support a predominant localization to either compartment. Assignments to localization patterns are specified at Additional file 5.
RT-qPCR
We performed RT-qPCR on subset of lncRNAs in our set spanning a broad range of expression in HeLa for which we were able to design qPCR primers with high efficiency (>85%) (Additional file 3; three biological rep-licates). We used these data to compare RT-qPCR ex-pression estimates and RNA FISH molecule counts.
Total RNA from HeLa cells (three biological repli-cates) was isolated using RNeasy mini kit (Qiagen, Venlo, Netherlands) according to the manufacturer in-structions. cDNA was generated using SuperScript III First-Strand Synthesis System for RT-PCR (Invitrogen) kit and RT-qPCR was performed using FastStart Univer-sal SYBR Green Master (Roche) according to the manu-facturer instructions on a 7900HT Fast Real-Time PCR System (Applied Biosystems).
Catalog access
Our lncRNA FISH catalog can be accessed at [78] (select lincRNA-FISH catalog on the left menu). All supplemen-tary datasets as well as raw image data can be down-loaded from the website. Individual images can be viewed through an image database linked to the website.
Accession number
Additional files
Additional file 1:Supplementary text and figures.
Additional file 2: Supplementary dataset 2, RNA-Seq analysis.
Additional file 3:Supplementary dataset 3, candidate set info.
Additional file 4:Supplementary dataset 4, two-color validation
analysis.
Additional file 5:Supplementary dataset 5, single cell analysis of
valid set.
Abbreviations
hFF:human foreskin fibroblasts; hLF: human lung fibroblasts; lincRNAs: large
intergenic non-coding RNAs; lncRNAs: long non-coding RNAs; RNA
FISH: RNA fluorescencein situhybridization; RNA-Seq: RNA sequencing.
Competing interests
AR has consulted for Biosearch Technologies and has received royalty income from intellectual property related to RNA FISH licensed to Biosearch Technologies. The other authors declare no competing interests.
Authors’contributions
The project was conceived and directed by MNC with guidance from ARegev, JLR, and ARaj. All data analyses were performed by MNC with guidance from ARegev, JLR, and ARaj. MNC performed most of the image analysis with assistance from MCD and guidance from ARaj. MCD performed most of the experiments with help from PDM and AB and with guidance from JLR and ARaj. OP-M contributed pre-analyzed mRNA FISH datasets. The paper was written by MNC with input from MCD, ARegev, JLR, and ARaj. MNC and MCD are equal first contributors. ARegev, JLR and ARaj are equal last contributors. All authors read and approved the final manuscript.
Acknowledgments
We are greatly indebted to Ron Cook, Marc Beal, and Arturo Orjalo of Biosearch Technologies for providing Stellaris RNA FISH reagents. We gratefully thank Marshall Levesque and Gautham Nair for insightful comments and code, Paul Ginart for assistance with the mouse tissue sections, and Michael Morse, Chiara Gerhardinger, Martin Sauvageau, and Scott Donovan for experimental support. We thank Ray Pete and Mark-Anthony Bray for informatics support. We thank the members of the Raj, Rinn, and Regev labs for critical comments and discussion. We thank the reviewers of the manuscript for their helpful feedback. This work was supported by: The HHMI International Graduate Student Research Fellowship
(MNC), the NIH Director’s New Innovator Award (1DP2OD008514) (ARaj), a
Burroughs-Welcome Fund Career Award at the Scientific Interface, an NSF
CAREER award (ARaj), the NIH Director’s New Innovator (DP2OD006670)
(JLR), P01 GM099117 (JLR), Center for Cell Circuits (P50 HG006193-01) (JLR, ARegev), NIH Pioneer Award (DP1OD003958-01) (ARegev), the Klarman Cell Observatory (ARegev), and HHMI (ARegev).
Author details
1Broad Institute of MIT and Harvard, 7 Cambridge Center, Cambridge, MA
02142, USA.2Department of Systems Biology, Harvard Medical School,
Boston, MA 02115, USA.3Department of Stem Cell and Regenerative Biology,
Harvard University, Cambridge, MA 02138, USA.4School of Engineering and
Applied Science, University of Pennsylvania, Philadelphia, PA 19104, USA.
5Howard Hughes Medical Institute, Department of Biology, Massachusetts
Institute of Technology, Cambridge, MA 02140, USA.
Received: 10 October 2014 Accepted: 13 January 2015
References
1. Rinn JL, Chang HY. Genome regulation by long noncoding RNAs. Annu Rev
Biochem. 2012;81:145–66.
2. Mercer TR, Dinger ME, Mattick JS. Long non-coding RNAs: insights into
functions. Nat Rev Genet. 2009;10:155–9.
3. Sauvageau M, Goff LA, Lodato S, Bonev B, Groff AF, Gerhardinger C, et al.
Multiple knockout mouse models reveal lincRNAs are required for life and brain development. eLife. 2013;2:e01749.
4. Ulitsky I, Bartel DP. lincRNAs: genomics, evolution, and mechanisms. Cell.
2013;154:26–46.
5. Kung JT, Colognori D, Lee JT. Long noncoding RNAs: past, present, and
future. Genetics. 2013;193:651–69.
6. Clemson CM, McNeil JA, Willard HF, Lawrence JB. XIST RNA paints the
inactive X chromosome at interphase: evidence for a novel RNA involved in
nuclear/chromosome structure. J Cell Biol. 1996;132:259–75.
7. Brown CJ, Hendrich BD, Rupert JL, Lafreniere RG, Xing Y, Lawrence J, et al.
The human XIST gene: analysis of a 17 kb inactive X-specific RNA that contains conserved repeats and is highly localized within the nucleus. Cell.
1992;71:527–42.
8. Maamar H, Cabili MN, Rinn J, Raj A. linc-HOXA1 is a noncoding RNA that
represses Hoxa1 transcription in cis. Genes Dev. 2013;27:1260–71.
9. Cabili MN, Trapnell C, Goff L, Koziol M, Tazon-Vega B, Regev A, et al.
Integrative annotation of human large intergenic noncoding RNAs reveals
global properties and specific subclasses. Genes Dev. 2011;25:1915–27.
10. Dinger ME, Amaral PP, Mercer TR, Mattick JS. Pervasive transcription of the
eukaryotic genome: functional indices and conceptual implications. Brief
Funct Genomic Proteomic. 2009;8:407–23.
11. Singer RH, Ward DC. Actin gene expression visualized in chicken muscle
tissue culture by using in situ hybridization with a biotinated nucleotide
analog. Proc Natl Acad Sci U S A. 1982;79:7331–5.
12. Harrison PR, Conkie D, Paul J, Jones K. Localisation of cellular globin messenger
RNA by in situ hybridisation to complementary DNA. FEBS Lett. 1973;32:109–12.
13. Brown CJ, Lafreniere RG, Powers VE, Sebastio G, Ballabio A, Pettigrew AL,
et al. Localization of the X inactivation centre on the human X
chromosome in Xq13. Nature. 1991;349:82–4.
14. Brockdorff N, Ashworth A, Kay GF, McCabe VM, Norris DP, Cooper PJ, et al. The
product of the mouse Xist gene is a 15 kb inactive X-specific transcript containing
no conserved ORF and located in the nucleus. Cell. 1992;71:515–26.
15. Froberg JE, Yang L, Lee JT. Guided by RNAs: X-inactivation as a model for
lncRNA function. J Mol Biol. 2013;425:3698–706.
16. Ip JY, Nakagawa S. Long non-coding RNAs in nuclear bodies. Develop
Growth Differ. 2012;54:44–54.
17. Hutchinson JN, Ensminger AW, Clemson CM, Lynch CR, Lawrence JB, Chess
A. A screen for nuclear transcripts identifies two linked noncoding RNAs associated with SC35 splicing domains. BMC Genomics. 2007;8:39.
18. Sone M, Hayashi T, Tarui H, Agata K, Takeichi M, Nakagawa S. The mRNA-like
noncoding RNA Gomafu constitutes a novel nuclear domain in a subset of
neurons. J Cell Sci. 2007;120:2498–506.
19. Clemson CM, Hutchinson JN, Sara SA, Ensminger AW, Fox AH, Chess A, et al.
An architectural role for a nuclear noncoding RNA: NEAT1 RNA is essential
for the structure of paraspeckles. Mol Cell. 2009;33:717–26.
20. Sasaki YT, Ideue T, Sano M, Mituyama T, Hirose T. MENepsilon/beta
noncoding RNAs are essential for structural integrity of nuclear
paraspeckles. Proc Natl Acad Sci U S A. 2009;106:2525–30.
21. Kino T, Hurt DE, Ichijo T, Nader N, Chrousos GP. Noncoding RNA gas5 is a
growth arrest- and starvation-associated repressor of the glucocorticoid receptor. Sci Signal. 2010;3:ra8.
22. Mercer TR, Dinger ME, Sunkin SM, Mehler MF, Mattick JS. Specific expression
of long noncoding RNAs in the mouse brain. Proc Natl Acad Sci U S A.
2008;105:716–21.
23. Femino AM, Fay FS, Fogarty K, Singer RH. Visualization of single RNA
transcripts in situ. Science. 1998;280:585–90.
24. Raj A, van den Bogaard P, Rifkin SA, van Oudenaarden A, Tyagi S. Imaging
individual mRNA molecules using multiple singly labeled probes. Nat
Methods. 2008;5:877–9.
25. Khalil AM, Guttman M, Huarte M, Garber M, Raj A, Rivea Morales D, et al.
Many human large intergenic noncoding RNAs associate with chromatin-modifying complexes and affect gene expression. Proc Natl Acad Sci U S A.
2009;106:11667–72.
26. Wang KC, Yang YW, Liu B, Sanyal A, Corces-Zimmerman R, Chen Y, et al. A
long noncoding RNA maintains active chromatin to coordinate homeotic
gene expression. Nature. 2011;472:120–4.
27. Bumgarner SL, Neuert G, Voight BF, Symbor-Nagrabska A, Grisafi P, van
Oudenaarden A, et al. Single-cell analysis reveals that noncoding RNAs contribute to clonal heterogeneity by modulating transcription factor
recruitment. Mol Cell. 2012;45:470–82.
28. Mohammad F, Pandey RR, Nagano T, Chakalova L, Mondal T, Fraser P, et al.
Kcnq1ot1/Lit1 noncoding RNA mediates transcriptional silencing by