5
X
October 2017
Early Prediction of Mental Health Problems of
Children Using Fuzzy Clustered Ensemble
Classifier
Sumathi M.R.1, Poorna B2
1
Bharathiar University, India 2
Shri Shankarlal Sundarbai Shasun Jain College for Women, India
Abstract: Recent surveys show that 12% of children between 4 to 16 years suffer from psychiatric disorders. Early diagnosis and effective treatment are needed to improve the quality of life of children and to avoid complicated problems at a later stage. Mental health decision support systems are generally based on single classifier model. In this research article, anensemble classifier is proposed for predictingmental health problems of children. The proposed ensemble classifier ensembles Random Forest classifiers with different features clustered upon the mutual information among them. The data set was collected from a clinical psychologist. The study investigated the effectiveness of the ensemble classifier with different feature sets and by comparing the results with single classifier-based models. K-fold cross-validation technique is used to assess the performance of the ensemble-classifier. The experimental results show that the proposedfuzzy clustered ensemble classifier achieved high diagnostic accuracy for language and communication problem and for attention & academic problem.
Keywords: Ensemble technique, Random forest classifier, Fuzzy clustering, Prediction, Mental health problem
I. INTRODUCTION
A. Background
ental Health Problem (MHP) has become one of the main causes for the burden of the disease worldwide. It often starts at an early stage and may destroy lives, with an impact on families, colleagues and communities. Empirical research has shown that the depressive disorders will become the second leading cause of the global disease burden by 2020. It has also been found that physical and mental healths are strongly co-related. World Health Organization (WHO) has stated that 10-20% of children and adolescents all over the world are experiencing mental disorders. Correct diagnosis of mental disorders at an early stage improves the quality of life of children and avoids complicated problems at a later stage in their lives. However, it is not easy to make correct diagnosis and is often delayed due to many factors. The mental health professionals perform a series of investigations to diagnose the MHP. Based on the preliminary investigations, they decide on further investigations and proceed. Generally, the mental health professionals diagnose disorders using the lists of symptoms specified in International Classification of Diseases – 10 (ICD10)[1] and Diagnostic and Statistical Manual –IV (DSM-IV). Research has proved that the symptoms of mental disorders are overlapping and are shared among numerous disorders. The investigation of causes has also proved that the same causes may lead to different disorders in different people. On the other hand, two people diagnosed with same disorder may have no causes/symptoms in common. This makes the mental health diagnostic process a complicated one.
The issues of overlapping of causes/symptoms, shortage of mental health professionals and a steep rise in mental illness among children have made the professionals to develop sophisticated computational tools to understand mental illness and improve treatment decisions. As the computational tools reduce the time of intensive diagnosis and improves diagnostic accuracy, it is crucial to develop reliable and powerful decision support systems (DSSs) that support the aforementioned increasingly complicated decision process.
B. Related Work
hybrid machine learning approaches have also been tried to boost the performance of conventional single model methods and to overcome the inherent weaknesses in any single method.
TABLEI
MACHINE LEARNING TECHNIQUES EMPLOYED FOR DIAGNOSING VARIOUS DISORDERS Ref.No. Techniques employed Mental Disorders diagnosed
[3] Constraint-based Reasoning DSM-III-R, DSM-IV & ICD-10 Disorders [4] OneR, SVM, Information Gain and ReliefF Depression
[5] Rule-based Reasoning, Fuzzy logic and Fuzzy-genetic algorithm
Treatment plan
[6] Neuro-fuzzy approach Adult depression [7] Production rules and Probabilities Schizophrenia [8] Depth First Search with backward search
strategy
Depression or Dementia
[9] Artificial Neural Networks and Support Vector Machines
Parkinson’s Disease
[10] Bayesian Network Dementia, Alzheimer’s and Mild Cognitive Impairment
[11] Multi-layer Perceptron Parkinson’s Disease
[12] Neural Network Anxiety, Behavioral, Depression and Post-traumatic stress disorders
[13] Artificial Neural Networks, Decision Tree and Naïve Bayes
Parkinson’s and Primary tumor disease
To overcome the limited performance of single models and simple hybrid models, ensemble methods have been suggested. The ensemble method is a technique involving a combination of the decisions of multiple classifiers. The ensemble is trained to solve the same problem but make different errors. Ensembles can reduce the variance of estimation errors and improve the overall classification accuracy [14]. A two layer machine learning model was constructed to diagnose Dementia at an early stage from clinical data [15].
C. Motivation
The majority of Decision Support System diagnoses the MHPs at an extreme stage of the disorder. This makes the treatment process a complicated and a useless one. Hence, it is essential to develop a decision support system for diagnosing the MHPs at an early stage. To our knowledge, mental health diagnostic DSS for diagnosing the problems at an early stage does not currently exist. The aim of this project is to develop an ensemble based DSS by utilizing the information documented by the professionals. The developed system supports the professionals by providing supplementary diagnosis information which can be used effectively for further treatments. The rest of the paper is organized as follows: In Section 2, we discuss about the Ensemble of classifiers. In Section 3, a Fuzzy Clustered Ensemble Classifier (FCEC) has been constructed for diagnosing the basic mental health problems of children below age 16. In section 4, experimental results are reported along with data description, pre-processing and feature selection, quality analysis of data and discussions of the results. Section 5 draws conclusions from this study.
II. ENSEMBLEOFCLASSIFIERS
A. Ensemble-Methods
B. Popular Ensemble techniques
Some of the other popular techniques for ensemble are Bagging, Boosting and Stacking. Baggingor Boot-strapping aggregating starts by taking B bootstraps from the underlying sample[16]. A bootstrap is a sample with replacement. Build a classifier for each bootstrap. The number of bootstraps B can either be fixed or tuned via an independent validation data set. Then, a new observation will be classified by letting all B classifiers vote or can be used in regression by taking average of the outcomes of the B models. Boosting is a sequential technique, in which the base model is trained on the entire dataset and the subsequent models are built by fitting the residuals of the base model. This technique gives higher weight to those observations that were poorly predicted by the base model and reduces the bias. Some examples of boosting algorithms are AdaBoost, GBM, etc. Stacking is the technique in which multiple layers of machine learning models are placed one over another, where each of the models passes their predictions to the models in the layer above it. The top layer model takes decisions based on the outputs of the models in layers below it. Two of the key principles for selecting the models are (1) the individual models fulfill particular accuracy criteria and (2) the model predictions of the individual models at base layer are not highly correlated with the predictions of the other models.
C. Need for Ensemble Methods
Ensemble is a proven method for improving the accuracy of the model and works in most of the cases. It makes the model more robust and stable, thus, ensuring relativelyhigher performance on the test cases in most scenarios.
D. Construction of Ensemble-Classifiers
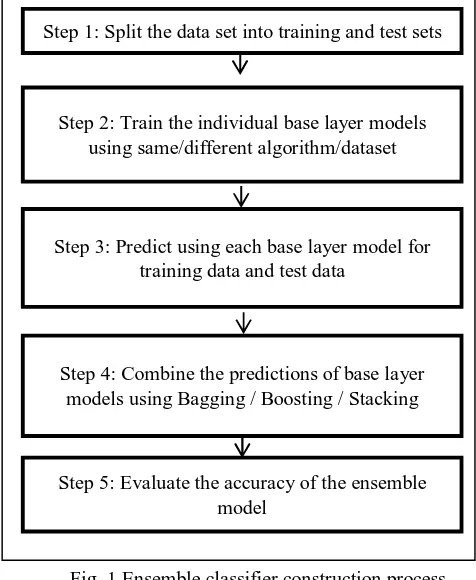
[image:4.612.177.415.370.660.2]The first step to construct an ensemble-classifier is to create multiple classification/regression models using some training dataset. These models are called as base models. Different splits of the same training dataset and same algorithm, or using the same dataset with different algorithms or any other may be used for creating base models. Next, the predictions are made for each instance model and save them for ensemble-model.
Fig 1: Ensemble Classifier Process
Fig. 1 Ensemble classifier construction process
III.FUZZY CLUSTERED ENSEMBLE CLASSIFIER (FCEC)
Fig. 1 Ensemble classifier construction process
III. FUZZY CLUSTERED ENSEMBLE CLASSIFIER (FCEC
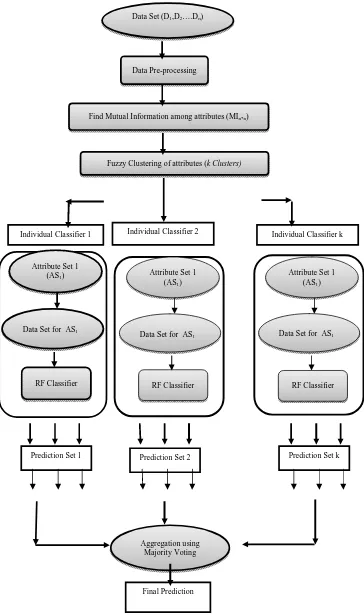
The steps involved in the proposed Fuzzy Clustered Ensemble-Classifier (FCEC) of Random Forests, for predicting the basic MHPs of children, are shown in Fig. 2.
Step 1: Split the data set into training and test sets
Step 3: Predict using each base layer model for training data and test data
Step 2: Train the individual base layer models using same/different algorithm/dataset
Step 4: Combine the predictions of base layer models using Bagging / Boosting / Stacking
Fig. 2 Fuzzy Clustered Ensemble Classifier
Individual Classifier 1 Individual Classifier 2 Individual Classifier k
Attribute Set 1 (AS1)
Data Set for AS1
RF Classifier
Prediction Set 1 Prediction Set 2 Prediction Set k
Aggregation using Majority Voting
Final Prediction Data Set (D1,D2….Dn)
Data Pre-processing
Find Mutual Information among attributes (MIn*n)
Fuzzy Clustering of attributes (k Clusters)
Attribute Set 1 (AS1)
Data Set for AS1
RF Classifier
Attribute Set 1 (AS1)
Data Set for AS1
A. Data Sets
[image:6.612.164.452.194.275.2]In this study, an experiment has been performed on the data set collected as text documents from the Clinical Psychologist of Chennai Institute of Learning and Development (CHILD). The purpose of this data set is to predict the basic MHPs, Attention-Academic problem and Language-Communication deficit, of children. The profile and the psychometric data of 113 children are collected from the clinical psychologist as text documents. The statistics of the data set is given in Table II. The age group of children ranges from 2 years to 16 years. It should be noted that there is no missing values in the data set and the whole features are of categorical type. The data set is composed of 45 input attributes and 2 class attributes. The features extracted from the text documents are presented in Annexure I along with its description.
TABLE II DATA SET STATISTICS
Mental Health Problem Sample Size Presence Absence Attention & Academic Problem 71 42
Language & Communication Deficit 24 89
Table iii features description B. Experimental Setup
The Random Forest Ensemble Classifier was implemented using Microsoft Excel and R tool. MS Excel was used to store the attribute value pairs extracted from the text document profiles collected from the psychologist. The continuous variable Age is discretized as Infant (I), Early Childhood (E), Middle Childhood (M) and Adult Childhood (A). All the features are of nominal type and the missing values were filled after consulting with the psychologist. The experiment was conducted with all features and compared with the results of experiment conducted with the extracted features. Recursive Feature Elimination (RFE) algorithm is used to extract the relevant features for prediction. The RFE algorithm, commonly used with a classifier, repeatedly constructs the classifier model and removes features with low weights. Random Forest is the classifier used for feature selection.
In order to ensemble, the features were clustered on mutual information among them and the fuzzy clustered features are passed as inputs to the Random Forest classifiers. For example, if the features are fuzzily clustered and if the number of clusters is 3, three subsets of features are passed as inputs to 3 Random Forest classifiers. The class labels are predicted by applying Majority Voting to the outputs of classifiers.
The 10-fold Cross Validation was used to evaluate the classification accuracy of the FCEC. The cross validation technique helps us to gain an unbiased estimate of the generalization accuracy. In cross validation, all the test sets are independent. The main idea of 10-fold CV procedure is that in each 10-fold one of the 10 subsets is used as the test set and the remaining 9 subsets are used as a training set.
C. Measures for Performance evaluation
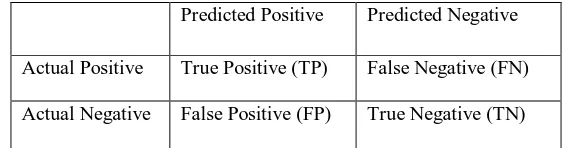
Classification accuracy(ACC), Sensitivity, Specificity and Kappa statistic are used to test the performance of the proposed FCEC model. These measures are derived from the confusion matrix. The confusion matrix has been given in table IV. In the table, the columns show the predicted values and the rows show the actual values. ‘Predicted Positive’ means the model or classifier has predicted the child as having the mental health problem while ‘Predicted Negative’ means the model or classifier has predicted the child as not having the mental health problem. ‘Actual Positive’ means the expert has diagnosed the child as having the mental health problem and ‘Actual Negative’ means the expert has diagnosed the child as not having the mental health problem. ‘True Positive’ indicates that the expert and the model have diagnosed the child as having the problem, while, the ‘True Negative’ indicates that the expert and the model have diagnosed the child as not having the problem. ‘False Positive’ and ‘False Negative’ indicate the contradictions between the model predictions and the expert diagnosis.
Table iv confusion matrix
Predicted Positive Predicted Negative
Actual Positive True Positive (TP) False Negative (FN)
[image:6.612.163.444.652.726.2]The measures like Accuracy, Sensitivity and Specificity are calculated using the values in table IV. The formula for calculating the measures are defined as follows:
ACC = (TP + TN) / (TP + FP + FN + TN) * 100 Sensitivity = TP / (TP + FN) * 100 Specificity = TN / (FP + TN) * 100
Kappa Statistic = (Observed Accuracy – Expected Accuracy) / (1 – Expected Accuracy)
For example, TP represents the number of true positives, which means that some cases with ‘AABE_PROB’ class is correctly classified as AABE_PROB=Y, FN represents the number of false negatives, which means that some cases with the ‘AABE_PROB’ class are classified as AABE_PROB=N; TN represents the number of true negatives, which means that some cases with AABE_PROB=N are classified correctly as AABE_PROB=N; and FP represents the number of false positives, which means that some cases with AABE_PROB=N are classified as AABE_PROB=Y.
The Kappa statistic is a metric that compares observed accuracy with expected accuracy (random chance). The kappa statistic is used to evaluate classifiers among themselves, especially on imbalanced data set. Generally, the kappa statistic values below 0.70 might be considered low. However, in studies related to cognitive states such as day dreaming, the kappa statistic values above 0.40 might be considered exceptional. This measure is used to test inter-rater reliability (i.e.) It can be used to compare the ability of different raters to classify the observations into one of several groups. In this research work, this metric has been used to measure of agreement between the diagnosis made by the psychologists and the proposed Fuzzy Clustered Ensemble Classifier (FCEC). The Kappa statistic values may vary from -1 to +1. Kappa of 0 occurs when there is no agreement between the diagnosis made by the psychologist and prediction made by the classifier. Kappa of 1 indicates that the there is a perfect agreement between the psychologist’s diagnosis and the classifier’s diagnosis. Negative kappa means that there is less agreement than expected by chance. According to research, the kappa value for epidemiology and medicine are scaled as follows:
Table VI Interpretation of Kappa Values
Balanced Accuracy: This is the average accuracy obtained on either class and stands for the relationship defined by True Positive Rate (TPR) ad False Positive Rate (FPR) of a 2-class problem, including the True Negative Rate (TNR) and False Negative Rate (FNR). Based on confusion matrix, the balanced accuracy can be easily calculated as:
Balanced Accuracy =1
2( TP
P +
TN
N )
(or)
Balanced Accuracy =Sensitivity + Speci icity 2
The balanced accuracy for Random Forest classifier is compared with the Fuzzy Clustered Ensemble Classifier (FCEC).
IV. EXPERIMENTALRESULTSANDDISCUSSIONS
A. Random Forest Classifier
Random forest classifier creates a set of decision trees from randomly selected subset of training set. The predictions of different decision trees are aggregated over majority voting to decide the final class prediction of the test object. The random forest works better than a single decision tree by reducing the effect of noise and giving more accurate results. Even if one or few decision trees re prone to noise, overall result would tend to be correct. This technique can be used for both classification and regression
Kappa value Interpretation
0.81 – 1.00 Excellent
0.61 – 0.80 Good
0.41 – 0.60 Fair
In order to evaluate the performance of the proposed model, two measures have been used. The measures are balanced accuracy and Kappa Statistic. Both the measures have been proved to be efficient in analyzing the performance of the classifiers.
TABLE V
PERFORMANCE OF CLASSIFIERS BASED ON BALANCED ACCURACY
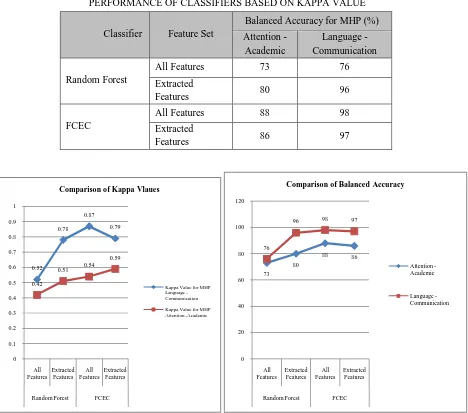
[image:8.612.80.548.308.721.2]The following table shows the kappa statistic measures for the Random Forest classifier with and without ensemble. Figure 3 shows the charts comparing the Kappa and Balanced Accuracy values of individual and ensemble classifiers. The charts clearly indicate that the kappa value and balanced accuracy value are higher for ensemble classifiers with full feature set.
TABLE VII
PERFORMANCE OF CLASSIFIERS BASED ON KAPPA VALUE
Fig. 3 Charts showing the comparison of Kappa values and Balanced Accuracy values
0.52 0.78 0.87 0.79 0.42 0.51 0.54 0.59 0 0.1 0.2 0.3 0.4 0.5 0.6 0.7 0.8 0.9 1 All Features Extracted Features All Features Extracted Features
Random Forest FCEC
Comparison of Kappa Vlaues
Kappa Value for MHP Language -Communication Kappa Value for MHP Attention -Academic
73 80
88 86
76
96 98 97
0 20 40 60 80 100 120 All Features Extracted Features All Features Extracted Features
Random Forest FCEC
Comparison of Balanced Accuracy
Attention -Academic
Language -Communication
Classifier Feature Set
Kappa Value for MHP Attention -Academic Language - Communication Random Forest
All Features 0.42 0.52
Extracted Features 0.51 0.78
FCEC All Features 0.54 0.87
Extracted Features 0.59 0.79
Classifier Feature Set
Balanced Accuracy for MHP (%)
Attention -Academic
Language - Communication
Random Forest
All Features 73 76
Extracted
Features 80 96
FCEC
All Features 88 98
Extracted
V. CONCLUSION
Mental health decision support systems are complex to diagnose and various researches have shown that machine learning techniques are effective in diagnosing mental health problems. In this study, a novel fuzzy clustered ensemble classifier that predicts basic mental health problems (BMHP) of children (age <=16 years) with relatively higher accuracy is proposed. The proposed classifier used Random classifier as the base model and the features were selected using Fuzzy clustering technique. The optimal number of clusters is identified and the feature set are fuzzily clustered based upon the mutual information among them into k clusters. The data set with clustered are features are given as input to the Random Forest classifiers. The data set for predicting BMHP was collected from a clinical psychologist. The effectiveness of the ensemble classifier with different feature sets were investigated and the results are shown. K-fold cross-validation tests were used to assess the performance the ensemble-classifier. The experimental results have shown that our fuzzy clustered ensemble classifier achieved high diagnostic accuracy of 98% for language and communication problem and 88% accuracy for attention & academic problem. In future, this FCEC technique may be checked with other benchmark data sets and the predictive performance may be enhanced by altering the procedure. Thus, the diagnosis made by the classifier may be used by the psychologists as a support and further treatment can be made effectively and efficiently.
VI. ACKNOWLEDGMENT
We would like to acknowledge Dr. SangeethaMadhu, Clinical Psychologist of CHILD Centre, Chennai for her contribution towards data set and expert knowledge.
REFERENCES
[1] The ICD-10 Classification of Mental and Behavioural Disorders: Clinical Descriptions and Diagnostic Guidelines. Geneva: World Health Organization, 1992. Print.
[2] American Psychiatric Association. "Narcolepsy." Diagnostic and Statistical Manual of Mental Disorders: DSM-5. 5th ed. Arlington: American Psychiatric Association, 2013. 372-78. Print.
[3] Yap, R. H., & Clarke, D. M. (1996). An expert system for psychiatric diagnosis using the DSM-III-R, DSM-IV and ICD-10 classifications. Proceedings of the AMIA Annual Fall Symposium, 229–233.
[4] Kipli, Kuryati, Abbas Z. Kouzani, and Isredza Rahmi A. Hamid. "Investigating machine learning techniques for detection of depression using structural MRI volumetric features." International journal of bioscience, biochemistry and bioinformatics 3.5 (2013): 444-448.
[5] Masri, R.Y.; Jani, H.M., "Employing artificial intelligence techniques in Mental Health Diagnostic Expert System," in Computer & Information Science (ICCIS), 2012 International Conference on , vol.1, no., pp.495-499,12-14 June 2012 doi:10.1109/ICCISci.2012.6297296
[6] Chattopadhyay, S., Kaur, P., Rabhi, F., Acharya, U.R., 2011. An automated system to diagnose the severity of adult depression. In: Jana, D., Pal, P. (Ed.), Proceedings of Second International Conference on Emerging Applications of Information Technology (CSI EAIT-2011), IEEE Computer Society and Conference Publishing Services, Kolkata, India, pp. 121–124.
[7] Luciano Comin Nunes, Plácido Rogério Pinheiro, Tarcísio Pequeno Cavalcante, and Mirian Calíope Dantas Pinheiro, “Handling Diagnosis of Schizophrenia by a Hybrid Method,” Computational and Mathematical Methods in Medicine, vol. 2015, Article ID 987298, 13 pages, 2015. doi:10.1155/2015/987298
[8] Basavappa SR; Rao SL; Harish B; Shantala R Basavappa ; Shobini L Rao Department of Electronics & Communication, Manipal Institute of Technology, Manipal, India. Expert system for dementia / depression diagnosis. NIMHANS Journal. 1996 Apr; 14(2): 99-106
[9] Gil, David, and M. A. G. N. U. S. Johnson. "Diagnosing parkinson by using artificial neural networks and support vector machines." Global Journal of Computer Science and Technology 9.4 (2009): 63-71.
[10] Seixas, FlávioLuiz, et al. "A Bayesian network decision model for supporting the diagnosis of dementia, Alzheimer׳ s disease and mild cognitive impairment." Computers in biology and medicine 51 (2014): 140-158.
[11] Khemphila, Anchana, and VeeraBoonjing. "Parkinsons disease classification using neural network and feature selection." World Academy of Science, Engineering and Technology 64 (2012): 15-18.
[12] Dabek, Filip, and Jesus J. Caban. "A Neural Network Based Model for Predicting Psychological Conditions." Brain Informatics and Health.Springer International Publishing, 2015.252-261.
[13] TawseefAyoubShaikh.,”A Prototype of Parkinson’s and primary tumor disease prediction using data mining techniques”, International Journal of Engineering Science Invention, vol 3,Issue:4.
[14] J. Eom, S. Kim, B. Zhang, AptaCDSS-E: a classifier ensemble-based clinical decision support system for cardiovascular disease level prediction, Expert Systems with Applications 34 (4) (2008) 2465–2479.
ANNEXURE I
Attribute Name Description Values
ACA_PERF Academic Performance of the Child
{Below Average (B), Average (A)
and Above Average (AA)}
AFFECTIONATE Does the child show affectionate to
parents? {Yes (Y) / No (N)}
AGE Age group of the child
{Infant(I), Early Childhood (E), Middle Childhood
(M), Adult Childhood (A)}
ALOOF Does the child stays alone most of the
time? {Yes (Y) / No (N)} ANXIOUS Is the child anxious? {Yes (Y) / No (N)}
APPETITE Does the child have regular / irregular appetite?
{Regular (R)/ Irregular (I)}
ARI_SKILL Is the arithmetic skill of the child adequate or inadequate?
{Adequate (A)/ Inadequate (I)}
ATTENTION Is the attention of the child adequate or inadequate?
{Adequate (A)/ Inadequate (I)}
BWL_MVMT Is the bowel movement of the child regular or irregular?
{Regular (R)/ Irregular (I)}
CONCENTRATION Is the concentration level of the child adequate or inadequate?
{Adequate (A)/ Inadequate (I)} DEM_ATT Does the child demand attention? {Yes (Y) / No (N)} DEV_DELAY Is there any developmental delay? {Yes (Y) / No (N)} DISTRACTIBLE Is the child easily distractible? {Yes (Y) / No (N)}
EYE_CONTACT Does the child maintain eye_contact? {Yes (Y) / No (N)}
FAM_HIST Is there any family history of mental
health disorder? {Yes (Y) / No (N)} FEARFUL Is the child afraid of anything? {Yes (Y) / No (N)}
FIDGETS Does the child have fidgets problem? {Yes (Y) / No (N)}
FIGHTS Does the child fight with
siblings/friends? {Yes (Y) / No (N)}
FRND_OLD_CHLDRN Does the child make friendship with
older children? {Yes (Y) / No (N)}
NO_FRNDS Number of friends the child has {Few (F) / Many (M)} IMPULSIVE Is the child impulsive? {Yes (Y) / No (N)} INDEPENDENT Is the child independent? {Yes (Y) / No (N)}
LISTEN_SKILL Does the child have adequate / inadequate listening skill?
PREG_COMP Did thechild's mother have any
pregnancy problems? {Yes (Y) / No (N)}
READ_SKILL Does the child have adequate / inadequate reading skill?
{Adequate (A)/ Inadequate (I)} COMP_SCHL_WORK Does the child completes school work? {Yes (Y) / No (N)}
SEIZURES Is the child affected by seizures? {Yes (Y) / No (N)}
SEX The gender of the child {Male (M) /
Female (F)+D11}
SLEEP_PROB Is the sleeping habit of the child regular / irregular?
{Regular (R)/ Irregular (I)} SPINNING Is the child attracted to spinning objects? {Yes (Y) / No (N)} STUBBORN Is the child stubborn? {Yes (Y) / No (N)} TEMP_TANTRUMS Does the child have temper_tantrums? {Yes (Y) / No (N)}
UNDER_MEDCN Is the child under medication? {Yes (Y) / No (N)} UNDERACTIVE Is the child underactive? {Yes (Y) / No (N)} UNUSUALLY_LOUD Is the child unusually loud? {Yes (Y) / No (N)}
WHINES Does the child scream? {Yes (Y) / No (N)}
WRITE_SKILL Does the child have adequate / inadequate writing skill?
{Adequate (A)/ Inadequate (I)}
IQ_LEVEL The Intelligence-Quotient level of the child
{Below Average / Average / Above
Average}
ATT_ACA_PROB Is the child affected by attention /
academic problem? {Yes (Y) / No (N)}
LANG_COMM_DEFICIT Does the child have language /
communication deficiency? {Yes (Y) / No (N)}
ANX_DEP Is the child affected by anxiety /
depression? {Yes (Y) / No (N)}
PDD Does the child have Pervasive
Developmental Disorder? {Yes (Y) / No (N)}
AUTISM Is the child affected by+C23 autistic
problems? {Yes (Y) / No (N)}
ADHD Is the child affected by Attention Deficit