ISSN: 1992-8645 www.jatit.org E-ISSN: 1817-3195
ANALYSIS AND IMPROVEMENT ON STATISTICAL
NATURALNESS MEASURE
1NUR HALILAH BINTI ISMAIL, 2SOONG-DER CHEN, 3YUSRA AL-NAJJAR
1, 2
Department of Computer Science and Information Technology, University Tenaga Nasional
Nasional
E-mail: [email protected] , [email protected]
ABSTRACT
Although Statistical Naturalness Measure (SNM) can rate the naturalness of image’s contrast relatively well, but it suffers from the problem of inconsistent rating across different spatial resolution; ratings for images with identical content and contrast level but different spatial resolution might be significantly different. The statistical model SNM was developed upon sample images with certain spatial resolution and the contrast was defined using a specific block size. This paper suggests that the problem is due to the computation of contrast using fixed block size regardless of the spatial resolution of the input image. It is proposed to rescale the block size based on the spatial resolution of input image to keep the ratio of block size to image size similar to those of the sample images used in developing the statistical model of SNM. The proposed method is tested and proven statistically to be effective in reducing the inconsistency in the ratings of images across different spatial resolution such there is no significant difference among them.
Keywords: Naturalness, Contrast, Statistical Naturalness, Contrast, Image Quality Assessment Algorithm
1. INTRODUCTION
Contrast enhancement has been widely used in daily life to increase the visibility of image details t [1]. One of the common problems that might happen after contrast enhancement is unnatural contrast enhancement. An extensive review regarding to the problem has been presented in [2]. Existing Image Quality Assessment Algorithms (IQAs) which are related to naturalness such as Lightness Order Error (LOE) [3] and Structure Measure Operator (SMO) [4] are found not giving ratings consistent to human perception. Details of weaknesses found in LOE and SMO also presented in [2]. SNM were reported to rate the naturalness of image’s contrast relatively well but suffers from the problem of inconsistent ratings for images of identical content and contrast level but different spatial resolution. This paper aims to study the performance of SNM in differentiating image of good contrast from those of poor or unnatural contrast and also to look into the problem mentioned above.
2. STATISTICAL NATURALNESS
MEASURE
2.1 Overview
The statistical naturalness measure is part of Tone Mapped Quality Index (TMQI) [5]. It is specifically designed for tone mapped low dynamic range (LDR) images. The quality index comprises multi-scale structural fidelity measure and statistical naturalness measure. The structural similarity (SSIM) approach [6] used to predict the perceptual quality. The statistical naturalness is based on successful approach of natural scene statistic [7]. The structure of TMQI is shown in Figure 1.
Figure 1. Structure of TMQI
2.1 Statistical Model of SNM
According to [8], naturalness is defined based on the matching between perceived visual info of image and the knowledge stored in memory. A study was conducted [9] to study the correlation of various attributes of image to the naturalness of
TMQI
Structural similarity
Brightness Attribute
Contrast Attribute
ISSN: 1992-8645 www.jatit.org E-ISSN: 1817-3195 image perceived by human. The attribute studied
were brightness, contrast, color reproduction, visibility and reproduction details. The results showed that contrast and brightness are among the attributes with the highest correlation [5].
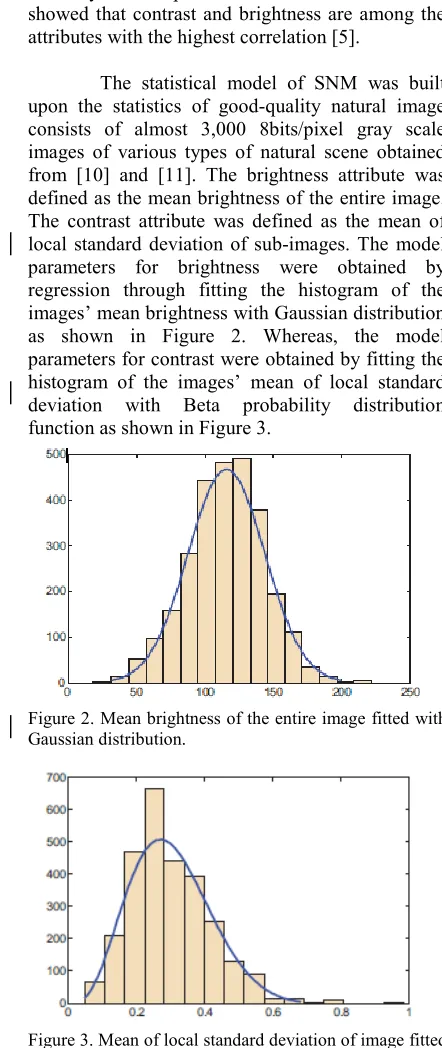
[image:2.612.326.524.79.195.2]The statistical model of SNM was built upon the statistics of good-quality natural image consists of almost 3,000 8bits/pixel gray scale images of various types of natural scene obtained from [10] and [11]. The brightness attribute was defined as the mean brightness of the entire image. The contrast attribute was defined as the mean of local standard deviation of sub-images. The model parameters for brightness were obtained by regression through fitting the histogram of the images’ mean brightness with Gaussian distribution as shown in Figure 2. Whereas, the model parameters for contrast were obtained by fitting the histogram of the images’ mean of local standard deviation with Beta probability distribution function as shown in Figure 3.
[image:2.612.76.297.127.651.2]Figure 2. Mean brightness of the entire image fitted with Gaussian distribution.
Figure 3. Mean of local standard deviation of image fitted with Beta probability density function.
The function for Gaussian distribution and Beta probability density functions are defined as follows:
The parameters found were µm = 115.94 and σm = 27.99 for Equation 1 and αd = 4.4 and ßd = 10.1 for Equation 2. The final rating of SNM is defined as the joint probability product of two probabilities as follows:
The value for K indicates the normalization factor for K = max (Pm, Pd). This paper focuses only on the contrast rating, Pd to solve the problem of unnatural contrast enhancement.
3. ANALYSIS AND IMPROVEMENT OF
SNM
The contrast rating, Pd range between 0 and 1. High rating indicates the naturalness is good while low rating indicates the naturalness is poor. For evaluation purpose, 40 test images with good contrast that consist of various types of content such as natural scenery and man-made object were downloaded from the public and dataset sources The contrast of each of the test images was modified generate images with poor contrast and also unnatural contrast. Contrast rating of all test images presented in Figure 4.
3.1 Analysis on Contrast Rating
Figure 4 shows that in most cases, good contrast images are given the highest rating, while unnatural contrast images are given the lowest rating near to zero. Such ratings are consistent to human opinion However, there are 11 test images which are given ratings inconsistent to human opinion; the ratings given to test images with good contrast are lower than those of poor contrast. Sample of test images with contrast ratings consistent and inconsistent to human opinion are shown in Figure 5 and Figure 6 respectively.
(1)
(2)
ISSN: 1992-8645 www.jatit.org E-ISSN: 1817-3195
Figure 4. Contrast rating for 40 test images
[image:3.612.90.298.316.407.2]Another test images illustrated in Figure 5 and Figure 6 with its contrast rating as shown in Table 1.
Figure 5. Test image with consistent contrast rating
Figure 6. Test image with inconsistent contrast rating
Table 1: Contrast Rating for Different Contrast Level
Test Image (a) poor contrast
(b) good contrast
[image:3.612.89.293.438.557.2](c) unnatural contrast
Figure 5 0.7512 0.8597 0.0052
Figure 6 0.3839 0.7694 0.9971
The contrast ratings in Figure 5 are consistent to human opinion, where image (c) with unnatural contrast is given the lowest rating and image (b) with good contrast is give the highest rating. However, the contrast ratings in Figure 6 are inconsistent to human perception where the image (c) with unnatural contrast is given the highest
rating while image (b) with good contrast is given a lower rating. This indicates that inconsistency may happen to specific type of images such as those with human since the statistical model of SNM is built upon an images of natural scenery. There, it remains questionable if SNM contrast rating could work well across all types of images.
3.2 Analysis on SNM Contrast Ratings across
Different Spatial Resolution
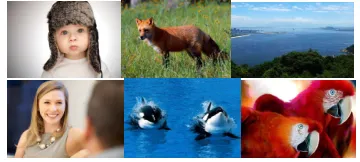
[image:3.612.325.505.525.606.2]This section presents a study on the consistency of SNM contrast ratings for images with identical content and contrast level but different spatial resolution. 25 test images of high spatial resolution with good contrast, size around 1000x1000 pixels and diversified content including human and natural scenery, downloaded from public sources are used in this study. Each of the test images are then downsized to around 640x480 pixels without any change to the contrast level. Figure 7 shows some of the test images used for the different spatial images.
Figure 7. Different Spatial Test Images
All the test images are of good contrast before and after downsizing, so the contrast rating should be high. Figure 8 shows the SNM contrast ratings for each pair of test images of high and low spatial resolution. Notice that in most cases, the test image with high spatial resolution is given a rating lower than those of the low resolution image. Unnatural contrast
(a) (b) (c)
(a) (b) (c)
[image:3.612.90.302.596.635.2]ISSN: 1992-8645 www.jatit.org E-ISSN: 1817-3195
Figure 8. Contrast Rating for Different Spatial Resolution with Default Block Size.
[image:4.612.107.274.302.364.2]Sample of test images which suffer from the problem of inconsistent contrast rating are shown in Figure 9 and their ratings are as in Table 2.
[image:4.612.316.519.409.714.2]Figure 9. Problem Contrast Rating of Spatial Test Images
Table 2: Contrast Rating for Different Spatial Images
Images High Resolution Low Resolution
(a) 0.203 0.863
(b) 0.297 0.995
3.3 Suggestion to Improve the Statistical
Naturalness
The computation of local standard deviation in SNM is based on a fixed block size 11x11. The paper suggests that the problem of inconsistent rating is due to the use of fixed block size regardless of the spatial resolution of input image. The sub-image in image of low spatial resolution covers a bigger area than sub-image of similar size in the image of high spatial resolution as illustrated in Figure 10.
Figure 10. Illustration of Block Size in Different Spatial Images
Consequently, the local standard deviation of the sub-images of different spatial resolution tend to be different and hence, lead to the problem of inconsistent rating. In Figure 10, the local standard deviation of the sub-image in the low and also the high resolution images are 61.19 and 21.35 respectively. It is observed that the problem tends to happen on image with spatial resolution much higher than those of the sample images used to build the statistical model of SNM. It is therefore proposed to rescale the block size based on the spatial resolution of the input image to keep the ratio of block size to image size similar to those of the sample images used in developing the statistical model of SNM. The equation is as follows:
Scale = 11 × (HR(r)) / LR(r))
Where HR is the high spatial resolution image and
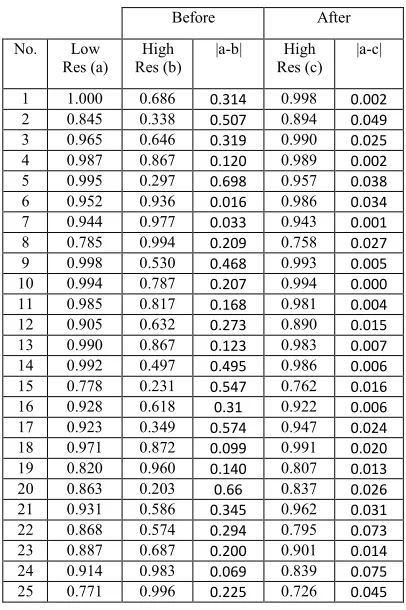
LR is the low spatial resolution image. The r is the row size of the image. The value of 11 is the default block size. This suggestion for improvement is only applicable to high spatial resolution image. The low spatial resolution image should use the default block size. The differences in the contrast ratings before and after the proposed rescaling of block size are as shown in Table 3.
Table 3: Difference in Contrast Ratings Before and After Rescaling
Before After
No. Low
Res (a) High Res (b)
|a-b| High
Res (c) |a-c|
1 1.000 0.686 0.314 0.998 0.002
2 0.845 0.338 0.507 0.894 0.049
3 0.965 0.646 0.319 0.990 0.025
4 0.987 0.867 0.120 0.989 0.002
5 0.995 0.297 0.698 0.957 0.038
6 0.952 0.936 0.016 0.986 0.034
7 0.944 0.977 0.033 0.943 0.001
8 0.785 0.994 0.209 0.758 0.027
9 0.998 0.530 0.468 0.993 0.005
10 0.994 0.787 0.207 0.994 0.000
11 0.985 0.817 0.168 0.981 0.004
12 0.905 0.632 0.273 0.890 0.015
13 0.990 0.867 0.123 0.983 0.007
14 0.992 0.497 0.495 0.986 0.006
15 0.778 0.231 0.547 0.762 0.016
16 0.928 0.618 0.31 0.922 0.006
17 0.923 0.349 0.574 0.947 0.024
18 0.971 0.872 0.099 0.991 0.020
19 0.820 0.960 0.140 0.807 0.013
20 0.863 0.203 0.66 0.837 0.026
21 0.931 0.586 0.345 0.962 0.031
22 0.868 0.574 0.294 0.795 0.073
23 0.887 0.687 0.200 0.901 0.014
24 0.914 0.983 0.069 0.839 0.075
25 0.771 0.996 0.225 0.726 0.045
(a) (b)
Low Spatial Image Fix window size 11 x 11
High Spatial Image
[image:4.612.90.270.597.697.2]ISSN: 1992-8645 www.jatit.org E-ISSN: 1817-3195 T-test is conducted to find out if the
propose rescaling does help to reduce the difference of ratings significantly. One of the output of T-test is P-value, the probability that there is no significant difference among the samples. In standard practice, P-value below 0.05 is interpreted there is significant difference. The P-value of the T-test conducted on the pair of the magnitude of the difference, |(a) – (b)| and |(b) – (c)| is 2.97×10⁻⁷ , indicating that the rescaling does help to reduce the differences significantly. In addition, the P-values of the T-test conducted on each of the differences are 1.08×10⁻⁴ and 0.30, indicating that the rescaling has effectively resolved the problem of inconsistent ratings as the differences have been reduced to a negligible level.
4. CONCLUSION
The statistical naturalness measure (SNM) is developed based on the successful approach - natural scene statistics. Although SNM can rate the naturalness of the contrast of image, but it suffers with problem of giving inconsistent rating to images with same contents and contrast level but different spatial resolution. The problem is due to the use of fixed block size in the computation of local standard deviation. This paper proposed to rescale the block size based on the size of input image to keep the ratio of block size to the input image size similar to those used to build the statistical model of SNM. The proposed method has been tested and proven statistically to be effective in reducing the inconsistency in the contrast ratings of images across different spatial resolution such that there is no significant difference among them.
REFERENCES:
[1] Shapiro L.G. and C.G.Stockman, “Computer Vision” Prentice Hall, New Jersey, 2001. [2] Nur Halilah and Soong-Der Chen, “A Review of
Image Quality Assessment Algorithm to Overcome Problem of Unnatural Contrast Enhancement” The 3rd National Graduate Conference, 2015.
[3] Shuhang Wang, Jin Zheng, Hai-Miao Hu, And Bo Li, “Naturalness Preserved Enhancement Algorithm For Non-Uniform Illumination Images”, IEEE Transaction Image Processing, (Vol.22), 2013.
[4] H. D. Cheng and Yingtao Zhang, “Detecting of Contrast Over Enhancement”, ICIP 2012
[5] Hojatollah Yeganeh, and Zhou Wang, “Objective Quality Assessment of Tone-Mapped Images”, IEEE transaction on image processing, (Vol.22), 2013.Z. Wang, A.C. Bovik, H.R. Sheikh, and E.P. Simoncelli, “Image quality assessment: From error visibility to structural similarity,” Institute of Electrical and Electronics Engineers Trans. Image Process,(Vol. 13, no. 4), pp. 600– 612, April 2004.
[6] Z. Wang, A. C. Bovik, H. R. Sheikh, and E. P. Simoncelli, “Image quality assessment: From error visibility to structural similarity,” IEEE Trans. Image Process., vol. 13, no. 4, pp. 600– 612, Apr. 2004
[7] Z. Wang and A. C. Bovik, “Reduced- and no-reference image quality assessment,” IEEE Signal Process. Mag., vol. 28, no. 6, pp. 29– 40, Nov. 2011.
[8] Janssen, T.J.W.M. and Blommaert, F.J.J., “Predicting the usefulness and naturalness of color reproductions,” J.Imaging Sci. Technol. 44(2), 93-104 (2000)
[9] M. Cˇ adík and P. Slavík, “The naturalness of reproduced high dynamic range images,” in
Proc. 9th Int. Conf. Inf. Visual., 2005, pp. 920– 925.
[10]Computer Vision Test Images. (2005) [Online]. Available:
http://www2.cs.cmu.edu/afs/cs/project/cil/ww w/v-images.html
[11]UCID - Uncompressed Colour Image
Database. (2004) [Online]. Available:
http://www-