BIROn - Birkbeck Institutional Research Online
Peskett, T.R. and Rau, F. and O’Driscoll, Jonathan and Patani, R and
Lowe, Alan R. and Saibil, Helen R. (2018) A liquid to solid phase transition
underlying pathological huntingtin exon1 aggregation. Molecular Cell 7 (4),
P588-601.E6. ISSN 1097-2765.
Downloaded from:
Usage Guidelines:
Please refer to usage guidelines at
or alternatively
Article
A Liquid to Solid Phase Transition Underlying
Pathological Huntingtin Exon1 Aggregation
Graphical Abstract
Highlights
d
Aggregates of huntingtin exon1 exist in distinct liquid-like and
solid-like forms
d
Liquid-like assembly formation is driven by polyQ and
proline-rich regions of exon1
d
The liquid-like assemblies convert into solid-like assemblies
in vitro
and in cells
d
Electron tomography reveals liquid and solid assemblies
have distinct structures
Authors
Thomas R. Peskett, Fre´de´rique Rau,
Jonathan O’Driscoll, Rickie Patani,
Alan R. Lowe, Helen R. Saibil
Correspondence
[email protected] (T.R.P.),
[email protected] (H.R.S.)
In Brief
In Huntington’s disease, a polyglutamine
expanded exon1 fragment of the
huntingtin protein forms aggregates in
the brains of affected individuals. Peskett
et al. show that this protein fragment can
form reversible liquid-like assemblies,
which convert into solid-like fibrillar
assemblies when the polyglutamine tract
reaches disease-associated lengths.
Peskett et al., 2018, Molecular Cell70, 588–601
Molecular Cell
Article
A Liquid to Solid Phase Transition Underlying
Pathological Huntingtin Exon1 Aggregation
Thomas R. Peskett,1,5,*Fre´de´rique Rau,2,6Jonathan O’Driscoll,1,7Rickie Patani,2,3Alan R. Lowe,1,4and Helen R. Saibil1,8,* 1Institute of Structural and Molecular Biology, Birkbeck College and University College London, London, WC1E 7HX, UK
2Institute of Neurology, University College London, London, WC1N 3BG, UK 3The Francis Crick Institute, London, NW1 1AT, UK
4London Centre for Nanotechnology, University College London, London, WC1H 0AH, UK
5Present address: Institute of Biochemistry, Department of Biology, ETH Zurich, Schafmattstrasse 18, 8093 Zurich, Switzerland 6Present address: Sorbonne Universite´, INSERM, Association Institut de Myologie, Centre de Recherche en Myologie, UMRS974,
Paris, France
7Present address: Adaptimmune Ltd, Abingdon, Oxfordshire, OX14 4RX, UK 8Lead Contact
*Correspondence:[email protected](T.R.P.),[email protected](H.R.S.)
https://doi.org/10.1016/j.molcel.2018.04.007
SUMMARY
Huntington’s disease is caused by an abnormally
long polyglutamine tract in the huntingtin protein.
This leads to the generation and deposition of
N-ter-minal exon1 fragments of the protein in intracellular
aggregates. We combined electron tomography
and quantitative fluorescence microscopy to analyze
the structural and material properties of huntingtin
exon1 assemblies in mammalian cells, in yeast, and
in vitro
. We found that huntingtin exon1 proteins
can form reversible liquid-like assemblies, a process
driven by huntingtin’s polyQ tract and proline-rich
re-gion. In cells and
in vitro
, the liquid-like assemblies
converted to solid-like assemblies with a fibrillar
structure. Intracellular phase transitions of
polyglut-amine proteins could play a role in initiating
irrevers-ible pathological aggregation.
INTRODUCTION
Huntington’s disease (HD) is an incurable neurodegenerative disease, caused by a polyglutamine (polyQ) tract expansion in the huntingtin (HTT) protein (Bates et al., 2015). In humans, polyQ repeatsR42 invariably cause HD, and longer repeats cause earlier onset (Finkbeiner, 2011). Although loss of HTT function may partly account for HD pathogenesis, it is known that small N-terminal, so called ‘‘exon1’’ fragments of HTT (HTTex1), gener-ated by aberrant splicing (Sathasivam et al., 2013) are key medi-ators of toxicity. HTTex1proteins comprise 17 N-terminal amino acids followed by the polyQ tract (varying lengths), a proline-rich region (38 residues), and 12 C-terminal residues. Expression of HTTex1proteins with expanded polyQ tracts causes HD-like symptoms in mice (Mangiarini et al., 1996) and is associated with toxicity in a range of other organisms, including yeast (Faber et al., 1999; Jackson et al., 1998; Meriin et al., 2002). In addition, HTTex1is highly aggregation prone and is a major constituent of
fibrillar aggregates found in the brains of HD patients (DiFiglia et al., 1997; Schilling et al., 2007). Such protein aggregates are a common feature of neurodegenerative diseases including Alzheimer’s disease, Parkinson’s disease, and amyotrophic lateral sclerosis (ALS) (Dugger and Dickson, 2017). Aggregation of HTTex1 is widely recapitulated in model systems and, like toxicity, is polyQ length dependent. Despite a clear link between HTTex1aggregation and toxicity, little is known about the aggre-gation mechanism in cells.
One possible aggregation mechanism is the classical nucleated growth model, whereby a critical nucleus, possibly a misfolded polyQ protein, initiates aggregation that proceeds by a ‘‘dock-lock’’ mechanism, with monomers adding to the growing fibril (Esler et al., 2000). This model can explain aggregation of simple polyQ peptides (Chen et al., 2002; Kar et al., 2011). In contrast,
in vitrostructural studies of HTTex1aggregation have identified small rounded oligomers, amorphous aggregates, and fibrils with various dimensions, suggesting a more complex mechanism (Crick et al., 2013; Legleiter et al., 2010; Poirier et al., 2002; Scher-zinger et al., 1997; Wetzel, 2012). An alternative model proposes that amyloid nuclei initially form via intermediate higher-order as-semblies such as oligomers (Lee et al., 2007; Vitalis and Pappu, 2011), an idea supported by in vitro biophysical experiments showing that oligomers appear in aggregation reactions prior to fibril formation (Crick et al., 2013; Jayaraman et al., 2012). In cells, biophysical and single-molecule experiments also provide evi-dence that HTTex1forms transient oligomers (Li et al., 2016;
Os-sato et al., 2010; Takahashi et al., 2007), though these are not seen consistently (Miller et al., 2011). Furthermore, these assem-blies are not necessarily intermediates in the aggregation pathway, and off-pathway reaction products could be artifacts ofin vitrosystems. Thus, direct structural evidence of aggregation intermediates, particularly in the cell, is lacking.
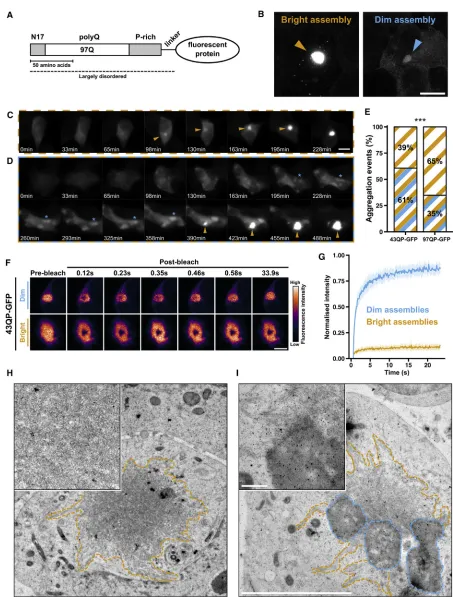
Figure 1. Aggregation of HTTex1Proteins Can Involve a Conversion between Distinct Macroscopic Assemblies (A) Domain organization of HTTex1constructs in this study.
(B) Representative confocal maximum intensity projections of bright and dim 43QP-GFP assemblies. Scale bar, 10mm.
phase-separated compartments, components are typically mo-bile and may exchange with the cytoplasm. However, liquid as-semblies formed by the LC protein FUS may aberrantly convert into a solid-like state, and this is accelerated by mutations asso-ciated with ALS (Patel et al., 2015).
Although the aggregation mechanism of HTTex1in vivois un-clear, the end products of aggregation have been well character-ized in cells. HTTex1-fluorescent protein fusions commonly assemble into micron-sized aggregates, several orders of magnitude larger than the assemblies that are often studied
in vitro. A limited number of ultrastructural studies suggest that these aggregates have fibrillar or granular substructures (DiFiglia et al., 1997; Legleiter et al., 2010; Scherzinger et al., 1997). Cryo-electron tomography experiments have recently confirmed the fibrillar structure of HTTex1aggregates (Bauerlein et al., 2017€ ). Using fluorescence microscopy, others have found that these aggregates can be morphologically and biophysically distinct (Caron et al., 2014; Dehay and Bertolotti, 2006; Duennwald et al., 2006a, 2006b). How are these different assemblies related to the aggregation mechanism?
In this study, we use a combination of correlative light and electron microscopy (CLEM) and time-lapse fluorescence mi-croscopy to study the aggregation pathway across different spatial scales. We applied these techniques to mammalian, yeast, andin vitromodels of HTTex1aggregation, to dissect the nanostructures, material properties, and aggregation pathway of HTTex1assemblies.
RESULTS
Aggregation of HTTex1Proteins Can Involve a
Conversion between Distinct Macroscopic Assemblies
To explore the aggregation pathway of polyQ-containing pro-teins, we induced expression of HTTex1proteins with different polyQ lengths (25, 43, or 97), fused to a C-terminal eGFP tag ( Fig-ure 1A) in HEK293 cells, and followed their expression by time-lapse fluorescence microscopy for 24–48 hr. We will refer to these proteins as 25, 43, or 97QP-GFP, where the number indi-cates the polyQ length (e.g., 97Q) and the P indiindi-cates the C-ter-minal proline-rich region of HTTex1(Figure 1A).
As previously observed, HTTex1aggregation was character-ized by the rapid growth of an intensely fluorescent aggregate that sequestered the entire fluorescence signal in the cell ( Fig-ure 1C). We called these aggregates ‘‘bright assemblies’’ ( Fig-ure 1B). In some cases, we observed aggregation events whereby one or more weakly fluorescent structures appeared in the cell prior to the formation of a bright assembly. These structures, which we called ‘‘dim assemblies’’ (Figure 1B), could
grow by coalescence (Figure 1D, blue asterisk) and exist for hours before a bright assembly grew from the edge of a dim assembly, sequestering all the fluorescence signal in the cell (Figure 1D, orange arrow;Video S1). We quantified these aggre-gation trajectories by computationally tracking single cells (Bove et al., 2017) and measuring their fluorescence intensity distribu-tions over time, demonstrating that progression from diffuse fluorescence to a bright assembly, with or without an intermedi-ate dim assembly, involves distinct changes in the fluorescence intensity distributions (Figures S1A and S1B).
We assigned the aggregation events in our time-lapse movies into one of two categories: formation of a bright assembly via a visible dim assembly, or formation of a bright assembly without a visible intermediate dim assembly. In 61% of 43QP-GFP ag-gregation events, we observed bright assemblies emerging via dim assemblies (Figure 1E). This reduced to 35% for 97QP-GFP. These experiments suggest that in some cases, HTTex1 ag-gregation involves intermediate dim assemblies. Lengthening the polyQ tract may either reduce the formation of dim assem-blies or accelerate their progression to bright assemassem-blies. 25QP-GFP also formed dim assemblies, which could coalesce (Figure S1C), but these did not progress to bright assemblies (Figure S1D). This suggests that HTTex1can form dim assemblies with sub-toxic polyQ lengths but that progression to bright as-semblies requires aberrant polyQ expansion. To test the effect of reduced HTTex1expression on assembly formation, we gener-ated stable cell lines expressing 25QP-GFP or 97QP-GFP (see
STAR Methods). Time course analysis confirmed that, as with transfected cells, dim assemblies formed with both polyQ lengths, whereas bright assemblies required polyQ expansion (Figure S1E).
Next we characterized the biophysical properties of dim and bright assemblies using fluorescence recovery after photo-bleaching (FRAP), which monitors the turnover of fluorescent molecules in a sub-cellular region bleached by a focused laser (Figure 1F). HTTex1 was highly mobile within dim assemblies (estimated mobile fraction = 84%, with 95% confidence interval [CI]: 83%–85%, n = 20) and highly immobile in bright assemblies (estimated mobile fraction = 10%, 95% CI: 10%–11%, n = 20) (Figure 1G). Bright assemblies were also 20–303 brighter than dim assemblies (p < 0.0015;Figure S1F) and had spiky, irregular edges, whereas dim assemblies were more spherical in shape (Video S2;Figure S1G).
To investigate the nanoscale organization of these assem-blies, we carried out correlative light and electron microscopy (CLEM) experiments on high-pressure frozen, freeze-substituted cells. Electron tomography of bright assemblies showed that they comprised a tightly interwoven meshwork of fibers with
(C and D) Time-lapse fluorescence microscopy of 43QP-GFP aggregation without (C), and with (D), a visible intermediate dim assembly. Orange arrows: bright assembly formation. Blue asterisk: coalescence of dim assemblies. Scale bar, 10mm.
(E) Quantification of aggregation events occurring without (orange) and with (orange/blue) visible intermediate dim assemblies. n > 92 aggregation events per construct from three independent experiments. p = 0.0003, chi-square.
(F) FRAP experiment showing high HTTex1mobility in dim assemblies but not in bright assemblies. Scale bar, 3mm.
(G) Averaged FRAP recovery curves. Shaded areas represent 95% confidence interval (CI). Dim assemblies estimated mobile fraction = 84%, 95% CI: 83%–85%, n = 20; bright assemblies estimated mobile fraction = 10%, 95% CI: 10%–11%, n = 20. See alsoTable S1.
diameters around 13 nm (Figure 1H;Video S3), and their irregular shapes arose from bundles of fibers. The fluorescence signal of dim assemblies was difficult to detect in cell sections, likely due to the loss of signal associated with sample thinning. However, we made use of the observation that bright assemblies formed at the edges of dim assemblies to locate likely candidates for dim assemblies (Figure S2A). Dim assemblies had an amor-phous, granular appearance (note that staining intensity does not necessarily correspond to protein concentration) and, like bright assemblies, were not enclosed by membranes (Figure 1I). Fibers from neighboring bright assemblies were seen partially in-side or at the edges of dim assemblies (Figure 1I;Figure S2B).
Dim assemblies weakly colocalized with stress granules (Pear-son coefficients: 0.20 ± 0.05 and 0.11 ± 0.05 with G3BP1 and TIA1 markers, respectively), which are also granular and inter-nally mobile (Buchan and Parker, 2009; Souquere et al., 2009) (Figure S2C), suggesting partial overlap, but sequestration of HTTex1into stress granules cannot account for the existence of the dim assemblies.
Overall, our results suggest that in aggregation events involving a dim assembly, HTTex1proteins initially form amor-phous, internally mobile assemblies and convert to fibrillar, inter-nally immobile assemblies over a timescale of minutes to hours.
Probing HTTex1Assembly States in Yeast
The budding yeastSaccharomyces cerevisiae has long been used as a model system to study HTTex1aggregation (Krobitsch
and Lindquist, 2000; Mason and Giorgini, 2011). Despite its extensive use, the assemblies we observed in mammalian cells have not, to our knowledge, been described in yeast. To test the robustness of our observations, we therefore asked whether we could recapitulate the different forms of HTTex1assembly in yeast. Additionally yeast would allow us to probe the properties and structures of the assemblies more easily than in our mammalian cell system: yeast is well suited to medium-throughput CLEM studies of aggregation due to its excellent freezing properties and rate and synchronicity of cell growth (Kukulski et al., 2011).
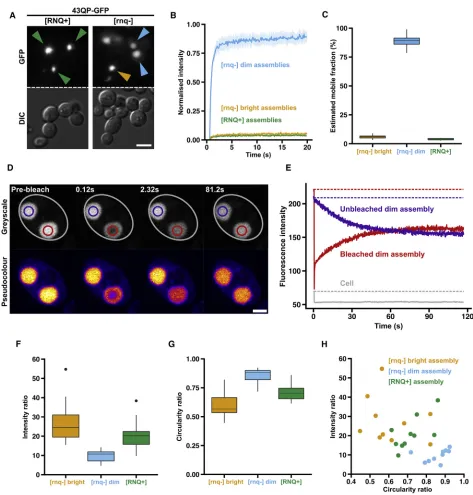
When we first expressed HTTex1 proteins in yeast, we only observed intensely fluorescent assemblies, resembling the bright assemblies we had observed in mammalian cells. We wondered whether this might be due to the presence of the prion form of Rnq1 (denoted [RNQ+]) in our strains: although Rnq1 in its prion conformation is required for polyQ length-dependent toxicity in yeast (Meriin et al., 2002), mammals do not have an Rnq1 homo-log. Given the fibrillar structures of bright assemblies in mamma-lian cells, and the observation that [RNQ+] is required for de novoformation of the prion form of the translation termination fac-tor Sup35 (Derkatch et al., 2000), which forms fibrillar assemblies in yeast (Kawai-Noma et al., 2010; Tyedmers et al., 2010), we reasoned that [RNQ+] might favor formation of bright assemblies, making dim assemblies rare or very transient. When we expressed HTTex1constructs in yeast strains lacking the Rnq1 prion (denoted [rnq]), we observed both intensely and weakly fluorescent as-semblies, as we had done in mammalian cells, suggesting that HTTex1can form dim and bright assemblies in yeast (Figure 2A).
FRAP analysis of the yeast assemblies showed that HTTex1 molecules were able to diffuse rapidly within dim assemblies
but were immobile in bright assemblies, regardless of whether the bright assemblies had formed in [rnq] or [RNQ+] cells ( Fig-ure 2B). The mobile fractions, estimated from the FRAP curves, were 89% (dim, [rnq]), 6% (bright, [rnq]) and 4% ([RNQ+]) (Figure 2C). This demonstrates that the two types of assembly have similar biophysical properties in yeast and mammalian cells. 97QP fused to the engineered monomeric fluorescent pro-tein mEOS3.1 similarly formed both types of assembly ( Fig-ure S3A), suggesting that eGFP does not affect the nucleation and properties of the two phases.
To ask whether HTTex1could move between dim assemblies and the cytosol, we took advantage of cells containing two dim assemblies of approximately equal size (Figure 2D). Upon bleaching one of the two assemblies, the bleached area under-went a rapid partial recovery (2 s) but did not immediately return to its pre-bleached intensity (Figure 2E). On a slower time-scale (2 min), the intensities of the two assemblies gradually equalized, while the average fluorescence intensity in the cell remained constant. Thus, HTTex1molecules can exchange be-tween dim assemblies and the cytosol, but this occurs approxi-mately 553slower than exchange within the assemblies them-selves (Table S2).
When bright assemblies formed in mammalian cells, they seemed to sequester all available HTTex1, whereas dim assem-blies could coexist with a pool of diffuse cytosolic HTTex1. To compare HTTex1 sequestration in the different assemblies in yeast, we measured the intensity ratios (IRs) of GFP fluorescence in the assemblies versus the cytosol, where IR = Intensityassembly/ Intensitycytosol(seeSTAR Methods). Bright assemblies were en-riched in HTTex1(median IR of 24 and 20 for [rnq] and [RNQ+] assemblies, respectively). In contrast, dim assemblies were less enriched (median IR = 11,Figure 2F).
As in mammalian cells, bright assemblies in yeast appeared to have less regular shapes than dim assemblies. The shapes of intracellular assemblies can often reflect underlying physical properties. For example, intracellular liquid-like assemblies tend to adopt spherical shapes due to their surface tension (Hyman et al., 2014). We therefore measured the circularity ratio (CR), where CR = 4p(Area/Perimeter2) (see STAR
Methods), of the different assemblies (Figure 2G). Dim blies were more circular (median = 0.88) than bright assem-blies (medians of 0.57 and 0.70 for [rnq] and [RNQ+], respectively).
Plotting IR against CR for individual assemblies showed that dim assemblies cluster in the low IR, high CR region of the graph. Bright assemblies from [rnq] and [RNQ+] backgrounds were found in the high IR, low CR region, but did not form separate clusters (Figure 2H). Thus, the distinct clusters were in agree-ment with our initial visual classification.
These data suggest that in the absence of the prion form of Rnq1, HTTex1 proteins are capable of forming two types of higher-order assembly in yeast cells, which have biophysical and morphological properties analogous to the assemblies that we characterized in mammalian cells.
Dim Assemblies Display Liquid-like Properties in Cells
Figure 2. Probing HTTex1Assembly States in Yeast
(A) Widefield microscopy of 43QP-GFP assemblies formed in [RNQ+] cells (green arrows), and [rnq] cells (blue and orange arrows, showing dim and bright assemblies, respectively). Scale bar, 5mm.
(B) Averaged FRAP recovery curves. Shaded areas: 95% confidence intervals. See alsoTable S1.
(C) Estimated mobile fractions of assemblies based on (B). Bright [rnq] versus dim [rnq] p = 6.3310–13; bright [rnq] versus [RNQ+] p = 0.003; dim [rnq] versus [RNQ+] p = 3.2310–12; Welch’s two-sample t test.
(D) Photo bleaching of a dim assembly (red outline) in a yeast cell (gray outline) containing a second, coexisting dim assembly (purple outline). Scale bar, 3mm. (E) Quantification of data in (D). Solid lines show mean fluorescence intensities in the corresponding colored regions in (D). Dotted lines highlight initial fluo-rescence levels in the corresponding colored regions. See alsoTable S2.
(F) Intensity ratios of assemblies. Bright [rnq] versus dim [rnq] p = 0.0009; bright [rnq] versus [RNQ+] p = 0.16; dim [rnq] versus [RNQ+] p = 0.0019; Welch’s two sample t test. Black dots represent individual data points that fell outside the whiskers of the boxplots.
(G) Circularity ratios of assemblies. Bright [rnq] versus dim [rnq] p = 0.0001; bright [rnq] versus [RNQ+] p = 0.04; dim [rnq] versus [RNQ+] p = 0.0006; Welch’s two-sample t test.
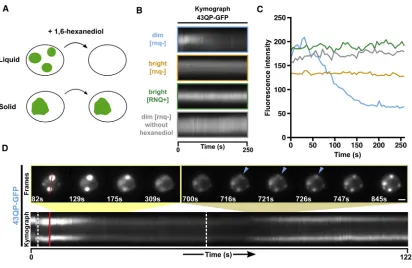
aliphatic alcohol that has previously been used to study the weak hydrophobic interactions between FG-repeat containing nucleo-porins, and to differentiate between liquid-like and solid-like membrane-less compartments (Figure 3A) (Kroschwald et al., 2015; Patel et al., 2007; Ribbeck and Go¨rlich, 2002).
When hexanediol was added to dim assemblies, they dis-solved within a few minutes, on a timescale comparable with the dissolution of liquid-like compartments under similar condi-tions (Figures 3B and 3C, blue;Figure S3B) (Kroschwald et al., 2015). In contrast, bright assemblies remained intact, irrespec-tive of Rnq1 prion status (Figures 3B and 3C, orange and green;
Figure S3B). Permeabilization of cells in the absence of hexane-diol did not affect the integrity of dim assemblies (Figures 3B and 3C, gray;Figure S3B). We next asked whether removing hexane-diol could reverse disassembly. When hexanehexane-diol was washed away, dim assemblies rapidly reformed, on timescales similar to their dissolution (Figure 3D;Video S4), and during reformation we noticed the coalescence of smaller assemblies into larger assemblies (Figure 3D, blue arrows).
This suggests that dim assemblies are highly reversible struc-tures, maintained by weak hydrophobic interactions, whereas bright assemblies are maintained by stronger, possibly amy-loid-like, interactions. In addition, the rapid reversibility,
circu-larity, coalescence, and internal mobility of dim assemblies are consistent with liquid-like properties. From this point on, we therefore refer to dim and bright assemblies as liquid-like assem-blies (LAs) and solid-like assemassem-blies (SAs), respectively.
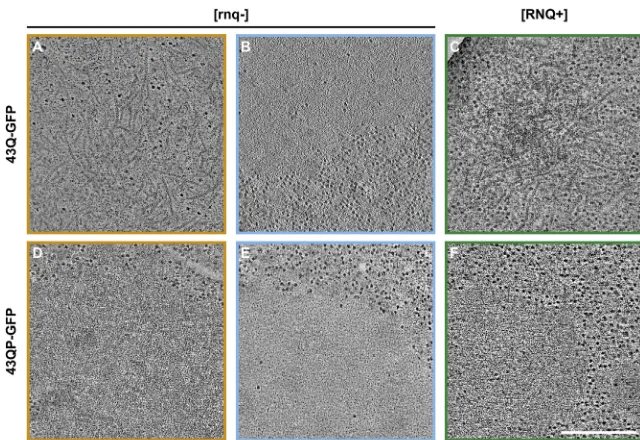
Liquid-like and Solid-like HTTex1Assemblies Have Different Nanostructures
To characterize the structures of LAs and SAs in yeast cells, we carried out CLEM experiments, focusing on two constructs: 43Q-GFP and 43QP-GFP. 43Q-GFP SAs were composed of fibers with diameters of approximately 13 nm, consistent with the fibers that we had observed in mammalian cells (Figure 4A). In contrast, 43Q-GFP LAs appeared as ‘‘smooth,’’ membrane-less masses with no obvious substructure that largely excluded ribosomes (Figure 4B). Assemblies formed in [RNQ+] cells were always composed of fibers, in agreement with our observations in [rnq] cells (Figure 4C).
[image:8.603.92.504.97.365.2]SAs of 43QP-GFP, in both [rnq] and [RNQ+] backgrounds, appeared to have a ‘‘granular’’ substructure with evidence of short fibrillar structures within the mass of the main assembly ( Fig-ures 4D and 4F). They therefore differed slightly to the obviously fibrillar assemblies of 43QP-GFP seen in mammalian cells, and of 43Q-GFP seen in yeast. However, LAs of 43QP-GFP had the Figure 3. Dim Assemblies Display Liquid-like Properties in Cells
(A) Addition of 1,6-hexanediol to digitonin-permeabilised cells can discriminate between liquid-like assemblies, which dissolve, and solid-like assemblies, which do not (Kroschwald et al., 2015).
(B) Kymographs showing the effect of hexanediol addition on fluorescence intensities of HTTex1assemblies in digitonin-permeabilized yeast cells. Hexanediol
was added at time = 0 s.
(C) Quantification of fluorescence intensities in kymographs in (B).
characteristic appearance of LAs formed by other HTTex1proteins that we characterized (Figure 4E; Figure S4). The assembly-cytosol boundaries of LAs, but not SAs, were clearly demarcated, which was consistent with our circularity measurements.
Collectively, these data suggest that SAs have complex nano-structures that are indicative of the strong intermolecular interac-tions associated with amyloid deposits, whereas LAs appear to lack such structures.
HTTex1Sequence Affects Assembly Formation
The sequences of HTTex1proteins determine their aggregation propensities and toxicity (Dehay and Bertolotti, 2006; Duenn-wald et al., 2006b). However, how these effects are related to the structural properties of HTTex1assemblies is not well under-stood. We therefore compared a series of HTTex1constructs with different polyQ lengths, with or without the proline-rich (P-rich) region, to determine the effects of HTTex1sequence on the for-mation of LAs and SAs in yeast. We quantified the fraction of cells containing (1) an LA, (2) an SA, and (3) no assembly (diffuse fluorescence), at specific time points after expression induction (Figure 5A). We did not observe coexisting LAs and SAs in the same yeast cell.
[image:9.603.58.378.98.318.2]In cells expressing 25Q-GFP, we did not observe assemblies, indicating that a 25Q tract is not sufficient to form macroscopic assemblies. However, 25QP-GFP began to form LAs at 8–12 hr, and by 24 hr, 25% of cells contained LAs, suggesting that the P-rich region can promote the formation of LAs. In our experiments, 25QP-GFP did not form SAs. 43Q-GFP was able to form both LAs and SAs, suggesting that lengthening the polyQ tract is sufficient to drive assembly formation, even in the absence of the P-rich region. In agreement with the idea that the P-rich region facilitates LA formation, 43QP-GFP formed LAs more readily than 43Q-GFP. As polyQ length was increased further (97Q-GFP and 97QP-GFP), SAs formed earlier and were more abundant than LAs. In cells expressing 43Q-GFP and 43QP-GFP, LAs formed earlier than SAs. With 97Q-GFP and
Figure 4. Liquid-like and Solid-like HTTex1
Assemblies Have Different Nanostructures
Electron tomography of yeast cells expressing 43Q-GFP and 43QP-GFP. Panels show slices through tomograms of the HTTex1 assemblies.
Colors indicate the type of assembly and prion status of the cells: orange, [rnq] SAs; blue, [rnq] LAs; green, [RNQ+] SAs.
(A) 43Q-GFP SA in a [rnq] cell, showing a fibrillar nanostructure.
(B) 43Q-GFP LA in a [rnq] cell, with a character-istic ‘‘smooth’’ appearance.
(C) 43Q-GFP SA in a [RNQ+] cell. (D) 43QP-GFP SA in a [rnq] cell. (E) 43QP-GFP LA in a [rnq] cell.
(F) 43QP-GFP SA in a [RNQ+] cell. Scale bar, 200 nm.
97QP-GFP, LAs were seen early on, but by 24 hr all assemblies were SAs, sug-gesting that LAs could convert to SAs, as seen in mammalian cells.
Expression levels were similar between different constructs and dropped slightly for longer constructs (Figure S5A), as ex-pected for long polyQ tracts (Duennwald, 2011). To explore the concentration dependence of the assemblies we used quantita-tive dot blotting (see STAR Methods) to estimate intracellular HTTex1concentrations at 4 and 24 hr time points (Figures 5B and 5C). At 4 hr, when polyQ-expanded proteins began to form assemblies, HTTex1concentrations were in an1–10mM range, increasing to 3–46mM at 24 hr, when 25QP-GFP (mean conc. 25mM) had formed LAs in >25% of cells.
These data support the notion that both the polyQ tract and the P-rich region play important roles in driving the formation of higher-order assemblies of HTTex1, as suggested previously (Crick et al., 2013; Dehay and Bertolotti, 2006; Duennwald et al., 2006b). In addition, the data demonstrate how the polyQ tract and P-rich region can affect the propensity of HTTex1 to form assemblies with strikingly different biophysical properties. The observation that LAs appeared in cell populations before SAs, coupled to the fact that we did not observe coexisting LAs and SAs, suggests that LAs are on pathway to SAs. More-over, increasing polyQ length to disease-associated lengths appears to accelerate this pathway.
HTTex1Forms Liquid-like Assemblies by Liquid-Liquid Phase Separation
25QP-GFP fused to form larger droplets, relaxing back into spherical shapes (Figure 6B;Video S5). We next asked whether 25QP-GFP molecules could diffuse within the droplets, using FRAP (Brangwynne et al., 2009). After bleaching, the fluores-cence intensity in the unbleached region gradually decreased, while the intensity in the bleached region gradually increased, indicating mixing of 25QP-GFP within the droplets (Figure 6C).
[image:10.603.97.509.104.575.2]Our experiments demonstrate that 25QP-GFP forms liquid-like assembliesin vitro. We attempted to purify 43QP-GFP but it was highly aggregation-prone in vitro. Nevertheless, 43QP-GFP also showed signs of assembling into droplets at lower con-centrations than 25QP-GFP and in the absence of crowding agent (Figure S6D), consistent with the idea that polyQ expan-sion promotes HTTex1assembly/aggregation.
Figure 5. HTTex1Sequence Affects Assembly Formation
(A) Yeast cells in the [rnq] background expressing HTTex1constructs with different polyQ lengths, with or without the P-rich region, were imaged by widefield
fluorescence microscopy at specific time points after induction of HTTex1expression. The percentage of cells containing an SA (orange), an LA (blue), or diffuse
fluorescence (gray) was determined at each time point by manual counting. n = 207–259 cells per construct.
(B) Quantitative dot blots calibrated with purified 25QP-GFP were used to determine HTTex1concentration in cellular lysates (red).
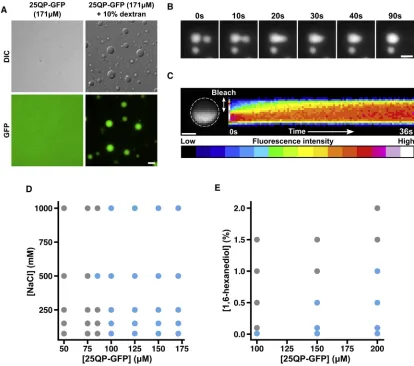
Phase separation often involves electrostatic interactions to promote droplet formation (Elbaum-Garfinkle et al., 2015; Nott et al., 2015). We asked whether this was true for 25QP-GFP by assessing phase separation at different protein and salt concen-trations (Figure 6D). Salt concentration had little effect on droplet formation, even at very high concentrations (up to 1 M), suggest-ing that electrostatic effects do not play a significant role in the formation and stability of 25QP-GFP droplets. Next, we tested the effect of increasing 1,6-hexanediol concentrations on droplet formation (Figure 6E). Hexanediol had a major destabilizing ef-fect on droplets and prevented their formation even at very low concentrations (0.1%). Our data suggest that HTTex1can form macroscopic reversible assemblies by a liquid-liquid phase sep-aration mechanism, likely due to weak hydrophobic interactions mediated by the polyQ and P-rich regions.
Liquid-like HTTex1Assemblies Convert into Solid-like Assemblies
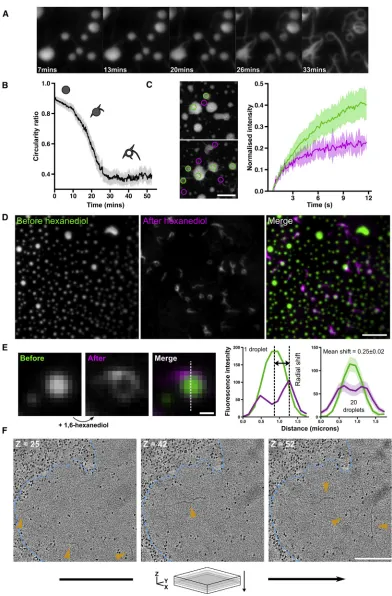
[image:11.603.99.513.100.466.2]When imaging droplets of 25QP-GFP, we noticed that the drop-lets gradually developed irregularly shaped edges. To examine this phenomenon in more detail, we performed time-lapse total internal reflection fluorescence (TIRF) microscopy of 25QP-GFP droplets. Over a period of 30–60 min, macroscopic, spike-like projections began to grow from the edges of droplets, depleting the protein in the droplet centers so that they appeared hollow, and leading to a reduction in the average circularity of objects in the field of view (Figures 7A and 7B;Video S6). This suggests that phase-separated 25QP-GFP liquid-like droplets progressively convert into solid-like aggregates. After photo-bleaching, fluorescence recovery in the spike features at the edges of droplets was slower than recovery at the centers of Figure 6. HTTex1Forms Liquid-like Assemblies by Liquid-Liquid Phase Separation
(A) Liquid-liquid phase separation of 25QP-GFP induced by molecular crowding. Scale bar, 5mm. (B) Fusion of 25QP-GFP droplets. Scale bar, 2mm. See alsoVideo S5.
(C) Half-bleach (Brangwynne et al., 2009) of a 25QP-GFP droplet (white dashed outline). Kymograph shows redistribution of 25QP-GFP after the bleach. Scale bar, 1mm.
Figure 7. Liquid-like HTTex1Assemblies Convert into Solid-like Assemblies (A) Liquid-like droplets gradually convert into solid-like structures. Scale bar, 2mm. (B) Quantification of the mean circularity of droplets during the conversion shown in (A).
the droplets, indicating reduced mobility of 25QP-GFP in the spikes (Figure 7C). This implies that the growth of spikes repre-sents conversion of the reversible liquid-like state to an irrevers-ible solid-like state, analogous to the phase transition of G156E FUS-GFPin vitro(Patel et al., 2015).
To distinguish the liquid-like from the solid-like components of the reaction and study their localization in droplets, we incubated droplets for 20 min to allow conversion to begin, then added hex-anediol to dissolve the liquid-like components, leaving the solid-like components intact (Video S7). By imaging a fixed field of view before and after hexanediol addition, we could see that early solid-like structures localized to the edges of droplets, often as rings that were not visible before hexanediol addition, due to masking by the fluorescence of the droplets (Figure 7D). We quantified the position of these structures in droplets early during the conversion by measuring the radial shift in droplet maximum fluorescence intensity upon hexanediol addition ( Fig-ure 7E). Droplets with an1mm diameter had a mean radial shift of 0.25 ± 0.02mm, suggesting that conversion begins in droplets, near droplet edges. We therefore looked for evidence of conver-sion from a liquid- to a solid-like state in yeast assemblies using FRAP. Occasionally we observed cells containing LAs that ap-peared to be undergoing a conversion similar to the one we had observedin vitro, with irregular features visible at the edge of the LA (Figure S7). FRAP revealed decreased mobility of HTTex1in these regions, suggesting a liquid- to solid-like conver-sion. To further explore the possibility of conversion in cells, we used electron tomography. We found isolated fibers buried within the featureless masses of some LAs, suggesting that irre-versible solid-like structures can originate from reirre-versible liquid-like assemblies in the cell as well asin vitro(Figure 7F). Such snapshots may represent the earliest stages in conversion, with fibers moving out toward the edges later on.
DISCUSSION
By applying CLEM and fluorescence microscopy to different HTTex1aggregation models, we found that HTTex1proteins can assemble into macroscopic liquid-like structures. In contrast to amyloid-like aggregates, these assemblies are maintained by weak hydrophobic interactions that are easily reversed by hexane-diol. Our CLEM experiments show that liquid-like assemblies lack a visible substructure at the nanoscale, consistent with their high internal mobility assessed using FRAP. Over time, in cells and
in vitro, the liquid-like assemblies gradually convert into assem-blies that behave like solids. These solid-like assemassem-blies are highly structured at the nanoscale and resemble aggregates that have been found in the brain tissue of HD patients (DiFiglia et al., 1997). We propose an aggregation model whereby diffusely distrib-uted HTTex1initially forms liquid-like assemblies by a liquid-liquid
phase separation mechanism that is promoted by increasing HTTex1concentration and mediated by weak hydrophobic inter-actions between the polyQ and P-rich regions. Disease-associ-ated polyQ expansions increase the propensity to form liquid-like assemblies, liquid-likely by lowering the critical concentration for phase separation. Formation of macroscopic liquid-like assem-blies promotes a liquid to solid phase transition of HTTex1that is concomitant with the formation of an ordered, fibrillar nano-structure. Our aggregation model is consistent with the kinetics of multi-step aggregation models that propose metastable inter-mediates like micelles or oligomers (Ossato et al., 2010; Thakur et al., 2009) and may explain previous observations of HTTex1 as-semblies with different biophysical properties (Caron et al., 2014). As proposed previously for FUS, liquid-like assemblies could facilitate the assembly of more stable structures, by lowering the free-energy barrier of nucleation (Patel et al., 2015; ten Wolde and Frenkel, 1997).
In cells, HTTex1with sub-toxic polyQ lengths can form liquid-like assemblies but these do not convert to irreversible solid-like assemblies. The conversion occurs only when polyQ length extends beyond the threshold for HD. Yet,in vitro, 25QP-GFP droplets do convert to irreversible solid-like structures. Other proteins such as chaperones may influence the conversion pro-cessin vivo. Whether full-length HTT forms liquid-like assemblies in cells is also yet to be tested. Sequence analysis shows that the polyQ tract may play a role in HTT function (Tartari et al., 2008) but that role is unclear (Bates et al., 2015). HTT is associated with dynamic cytosolic compartments (Maiuri et al., 2017; Nath et al., 2015; Savas et al., 2008), and bioinformatic analyses sug-gest that polyQ tracts stabilize protein-protein interactions ( Sa-vas et al., 2008; Schaefer et al., 2012). It is tempting to speculate that HTT makes use of its ‘‘sticky’’ exon1 region to promote liquid-liquid phase separation.
The nature of the toxic species in HD is an area of intense research. Several studies point toward the protective effect of aggregates (Kuemmerle et al., 1999; Arrasate et al., 2004; Slow et al., 2005), yet others suggest that aggregates themselves potentiate toxicity (Li et al., 2016; Michalik and Van Broeck-hoven, 2003; Woerner et al., 2016). Evidence from yeast indi-cates that toxicity depends on the proteins they sequester (Gong et al., 2012). As liquid-like aggregation intermediates are more amenable to chemical intervention than their solid counter-parts, they might provide a means to promote or hinder aggrega-tion, to ameliorate toxicity. HTTex1toxicity could also be probed by modulating aggregation via the liquid-like phase.
Recent studies show that phase-separated low complexity proteins can mature into more stable structuresin vitro(Molliex et al., 2015; Patel et al., 2015; Zhang et al., 2015), and it has been hypothesized that similar changes in cellular assemblies, such as P-bodies and stress granules could contribute to
(C) FRAP of partially converted droplets comparing recovery of spike features (magenta) and droplet centers (green). Shaded region of graph represents 95% confidence interval. Scale bar, 2mm. See alsoTable S1.
(D) Droplets before (green) and after (magenta) hexanediol addition. Scale bar, 5mm.
(E) Quantification of early stages of droplet conversion (related toFigure 7D). Radial shift is the distance between intensity maxima in droplet linescans before (green) and after (magenta) hexanediol. n = 20 similarly sized droplets. Shaded regions: 95% confidence intervals. Scale bar, 0.5mm.
neurodegenerative diseases (Li et al., 2013; Ramaswami et al., 2013). Our results provide a dramatic example of how HTTex1 can aggregate via a liquid to solid conversion, and provide direct structural evidence that such conversions can take place in the cellular context.
STAR+METHODS
Detailed methods are provided in the online version of this paper and include the following:
d KEY RESOURCES TABLE
d CONTACT FOR REAGENT AND RESOURCES SHARING
d EXPERIMENTAL MODEL AND SUBJECT DETAILS
B Bacterial Culture B Yeast Culture
B Mammalian Cell Culture
d METHOD DETAILS
B Yeast Methods B Prion Curing B Yeast Toxicity Assay B Yeast Expression Levels B Quantitative Dot Blots B Mammalian Cell Methods
B Arsenite-induced Stress Granule Formation and Immu-nofluorescence
B Time-lapse Experiments B Incubator Microscope B Single Cell Tracking B Hexanediol Experiments B FRAP Methods
B Intensity and Circularity Ratios B EM Sample Preparation
B Correlative Light and Electron Microscopy
B Electron Tomography Data Collection and Processing B Sequence Effects Experiment
B Protein Purification B In vitroExperiments B Phase Diagrams
B Total Internal Reflection Fluorescence (TIRF) Mi-croscopy
B Liquid to Solid Conversion Experiment B Droplet Dissolution using Hexanediol
d QUANTIFICATION AND STATISTICAL ANALYSIS
SUPPLEMENTAL INFORMATION
Supplemental Information includes seven figures, two tables, and seven videos and can be found with this article online athttps://doi.org/10.1016/j. molcel.2018.04.007.
ACKNOWLEDGMENTS
We thank Anthony Roberts and Jernej Ule for critical feedback on the manu-script; Jernej Ule for hosting FR; Natasha Lukoyanova, Shu Chen, and Luchun Wang for EM support; Dave Houldershaw, Yanni Goudetsidis, and Richard Westlake for computing support; Anne Bertolotti and Joe Grove for plasmids; Claire Bagneris for laboratory support; Anna Bove for advice on the incubator mi-croscope; members of the Saibil and Lowe groups for helpful discussions. This work was supported by a Wellcome Trust Clinician Scientist Fellowship (101149/
Z/13/A) to R.P., a Medical Research Council award (MR/K015826/1) to A.R.L., and Wellcome Trust awards 106249/Z/14/Z, 101488/Z/13/Z, and 079605/Z/ 06/Z to H.R.S. T.R.P. was supported by a Wellcome Trust studentship (102401/Z/13/Z).
AUTHOR CONTRIBUTIONS
Conceptualization, T.R.P., A.R.L., and H.R.S.; Investigation, T.R.P., F.R., and J.O.; Analysis, T.R.P. and A.R.L.; Writing & Editing, T.R.P., F.R., R.P., A.R.L., and H.R.S.; Funding Acquisition, R.P., A.R.L., and H.R.S.; Supervision, R.P., A.R.L., and H.R.S.
DECLARATION OF INTEREST
The authors declare no competing interests.
Received: October 3, 2017 Revised: March 8, 2018 Accepted: April 5, 2018 Published: May 10, 2018
REFERENCES
Abadi, M., Agarwal, A., Barham, P., Brevdo, E., Chen, Z., Citro, C., Corrado, G.S., Davis, A., Dean, J., Devin, M., et al. (2016). TensorFlow: Large-Scale Machine Learning on Heterogeneous Distributed Systems. In OSDI’16 Proceedings of the 12th USENIX Conference on Operating Systems Design and Implementation, pp. 265–283.
Arrasate, M., Mitra, S., Schweitzer, E.S., Segal, M.R., and Finkbeiner, S. (2004). Inclusion body formation reduces levels of mutant huntingtin and the risk of neuronal death. Nature431, 805–810.
Bates, G.P., Dorsey, R., Gusella, J.F., Hayden, M.R., Kay, C., Leavitt, B.R., Nance, M., Ross, C.A., Scahill, R.I., Wetzel, R., et al. (2015). Huntington dis-ease. Nat. Rev. Dis. Primers1, 15005.
Bauerlein, F.J.B., Saha, I., Mishra, A., Kalemanov, M., Martı´nez-Sa´nchez, A.,€ Klein, R., Dudanova, I., Hipp, M.S., Hartl, F.U., Baumeister, W., and Ferna´ndez-Busnadiego, R. (2017). In situ architecture and cellular interactions of PolyQ inclusions. Cell171, 179–187.e10.
Bove, A., Gradeci, D., Fujita, Y., Banerjee, S., Charras, G., and Lowe, A.R. (2017). Local cellular neighborhood controls proliferation in cell competition. Mol. Biol. Cell28, 3215–3228.
Brangwynne, C.P., Eckmann, C.R., Courson, D.S., Rybarska, A., Hoege, C., Gharakhani, J., J€ulicher, F., and Hyman, A.A. (2009). Germline P granules are liquid droplets that localize by controlled dissolution/condensation. Science324, 1729–1732.
Buchan, J.R., and Parker, R. (2009). Eukaryotic stress granules: the ins and outs of translation. Mol. Cell36, 932–941.
Caron, N.S., Hung, C.L., Atwal, R.S., and Truant, R. (2014). Live cell imaging and biophotonic methods reveal two types of mutant huntingtin inclusions. Hum. Mol. Genet.23, 2324–2338.
Chen, S., Ferrone, F.A., and Wetzel, R. (2002). Huntington’s disease age-of-onset linked to polyglutamine aggregation nucleation. Proc. Natl. Acad. Sci. USA99, 11884–11889.
Chernoff, Y.O., Lindquist, S.L., Ono, B., Inge-Vechtomov, S.G., and Liebman, S.W. (1995). Role of the chaperone protein Hsp104 in propagation of the yeast prion-like factor [psi+]. Science268, 880–884.
Cox, B.S., Tuite, M.F., and McLaughlin, C.S. (1988). Thecfactor of yeast: a problem in inheritance. Yeast4, 159–178.
Crick, S.L., Ruff, K.M., Garai, K., Frieden, C., and Pappu, R.V. (2013). Unmasking the roles of N- and C-terminal flanking sequences from exon 1 of huntingtin as modulators of polyglutamine aggregation. Proc. Natl. Acad. Sci. USA110, 20075–20080.
Derkatch, I.L., Bradley, M.E., Masse, S.V., Zadorsky, S.P., Polozkov, G.V., Inge-Vechtomov, S.G., and Liebman, S.W. (2000). Dependence and indepen-dence of [PSI(+)] and [PIN(+)]: a two-prion system in yeast? EMBO J.19, 1942–1952.
DiFiglia, M., Sapp, E., Chase, K.O., Davies, S.W., Bates, G.P., Vonsattel, J.P., and Aronin, N. (1997). Aggregation of huntingtin in neuronal intranuclear inclu-sions and dystrophic neurites in brain. Science277, 1990–1993.
Duennwald, M.L. (2011). Monitoring polyglutamine toxicity in yeast. Methods 53, 232–237.
Duennwald, M.L. (2012). Growth assays to assess polyglutamine toxicity in yeast. J. Vis. Exp. (61), e3461.
Duennwald, M.L., Jagadish, S., Giorgini, F., Muchowski, P.J., and Lindquist, S. (2006a). A network of protein interactions determines polyglutamine toxicity. Proc. Natl. Acad. Sci. USA103, 11051–11056.
Duennwald, M.L., Jagadish, S., Muchowski, P.J., and Lindquist, S. (2006b). Flanking sequences profoundly alter polyglutamine toxicity in yeast. Proc. Natl. Acad. Sci. USA103, 11045–11050.
Dugger, B.N., and Dickson, D.W. (2017). Pathology of neurodegenerative dis-eases. Cold Spring Harb. Perspect. Biol.9, a028035.
Elbaum-Garfinkle, S., Kim, Y., Szczepaniak, K., Chen, C.C.-H., Eckmann, C.R., Myong, S., and Brangwynne, C.P. (2015). The disordered P granule pro-tein LAF-1 drives phase separation into droplets with tunable viscosity and dy-namics. Proc. Natl. Acad. Sci. USA112, 7189–7194.
Esler, W.P., Stimson, E.R., Jennings, J.M., Vinters, H.V., Ghilardi, J.R., Lee, J.P., Mantyh, P.W., and Maggio, J.E. (2000). Alzheimer’s disease amyloid propagation by a template-dependent dock-lock mechanism. Biochemistry 39, 6288–6295.
Faber, P.W., Alter, J.R., MacDonald, M.E., and Hart, A.C. (1999). Polyglutamine-mediated dysfunction and apoptotic death of a Caenorhabditis elegans sensory neuron. Proc. Natl. Acad. Sci. USA96, 179–184.
Finkbeiner, S. (2011). Huntington’s disease. Cold Spring Harb. Perspect. Biol. 3, 3.
Gong, H., Romanova, N.V., Allen, K.D., Chandramowlishwaran, P., Gokhale, K., Newnam, G.P., Mieczkowski, P., Sherman, M.Y., and Chernoff, Y.O. (2012). Polyglutamine toxicity is controlled by prion composition and gene dosage in yeast. PLoS Genet.8, e1002634.
Horton, R.M., Hunt, H.D., Ho, S.N., Pullen, J.K., and Pease, L.R. (1989). Engineering hybrid genes without the use of restriction enzymes: gene splicing by overlap extension. Gene77, 61–68.
Huang, L.-K., and Wang, M.-J.J. (1995). Image thresholding by minimizing the measures of fuzziness. Pattern Recognit.28, 41–51.
Hyman, A.A., Weber, C.A., and J€ulicher, F. (2014). Liquid-liquid phase separa-tion in biology. Annu. Rev. Cell Dev. Biol.30, 39–58.
Jackson, G.R., Salecker, I., Dong, X., Yao, X., Arnheim, N., Faber, P.W., MacDonald, M.E., and Zipursky, S.L. (1998). Polyglutamine-expanded human huntingtin transgenes induce degeneration of Drosophila photoreceptor neu-rons. Neuron21, 633–642.
Janes, K.A. (2015). An analysis of critical factors for quantitative immunoblot-ting. Sci. Signal.8, rs2.
Jayaraman, M., Kodali, R., Sahoo, B., Thakur, A.K., Mayasundari, A., Mishra, R., Peterson, C.B., and Wetzel, R. (2012). Slow amyloid nucleation viaa -helix-rich oligomeric intermediates in short polyglutamine-containing huntingtin fragments. J. Mol. Biol.415, 881–899.
Kar, K., Jayaraman, M., Sahoo, B., Kodali, R., and Wetzel, R. (2011). Critical nucleus size for disease-related polyglutamine aggregation is repeat-length dependent. Nat. Struct. Mol. Biol.18, 328–336.
Kawai-Noma, S., Pack, C.-G., Kojidani, T., Asakawa, H., Hiraoka, Y., Kinjo, M., Haraguchi, T., Taguchi, H., and Hirata, A. (2010). In vivo evidence for the fibrillar structures of Sup35 prions in yeast cells. J. Cell Biol.190, 223–231.
Kremer, J.R., Mastronarde, D.N., and McIntosh, J.R. (1996). Computer visual-ization of three-dimensional image data using IMOD. J. Struct. Biol. 116, 71–76.
Krobitsch, S., and Lindquist, S. (2000). Aggregation of huntingtin in yeast varies with the length of the polyglutamine expansion and the expression of chaperone proteins. Proc. Natl. Acad. Sci. USA97, 1589–1594.
Kroschwald, S., Maharana, S., Mateju, D., Malinovska, L., N€uske, E., Poser, I., Richter, D., and Alberti, S. (2015). Promiscuous interactions and protein disag-gregases determine the material state of stress-inducible RNP granules. eLife 4, e06807.
Kuemmerle, S., Gutekunst, C.A., Klein, A.M., Li, X.J., Li, S.H., Beal, M.F., Hersch, S.M., and Ferrante, R.J. (1999). Huntington aggregates may not pre-dict neuronal death in Huntington’s disease. Ann. Neurol.46, 842–849.
Kukulski, W., Schorb, M., Welsch, S., Picco, A., Kaksonen, M., and Briggs, J.A. (2011). Correlated fluorescence and 3D electron microscopy with high sensi-tivity and spatial precision. J. Cell Biol.192, 111–119.
Lee, C.C., Walters, R.H., and Murphy, R.M. (2007). Reconsidering the mecha-nism of polyglutamine peptide aggregation. Biochemistry46, 12810–12820.
Legleiter, J., Mitchell, E., Lotz, G.P., Sapp, E., Ng, C., DiFiglia, M., Thompson, L.M., and Muchowski, P.J. (2010). Mutant huntingtin fragments form oligomers in a polyglutamine length-dependent manner in vitro and in vivo. J. Biol. Chem. 285, 14777–14790.
Li, Y.R., King, O.D., Shorter, J., and Gitler, A.D. (2013). Stress granules as cru-cibles of ALS pathogenesis. J. Cell Biol.201, 361–372.
Li, L., Liu, H., Dong, P., Li, D., Legant, W.R., Grimm, J.B., Lavis, L.D., Betzig, E., Tjian, R., and Liu, Z. (2016). Real-time imaging of Huntingtin aggregates divert-ing target search and gene transcription. eLife5, 5.
Maiuri, T., Mocle, A.J., Hung, C.L., Xia, J., van Roon-Mom, W.M.C., and Truant, R. (2017). Huntingtin is a scaffolding protein in the ATM oxidative DNA damage response complex. Hum. Mol. Genet.26, 395–406.
Mangiarini, L., Sathasivam, K., Seller, M., Cozens, B., Harper, A., Hetherington, C., Lawton, M., Trottier, Y., Lehrach, H., Davies, S.W., and Bates, G.P. (1996). Exon 1 of the HD gene with an expanded CAG repeat is suf-ficient to cause a progressive neurological phenotype in transgenic mice. Cell 87, 493–506.
Mason, R.P., and Giorgini, F. (2011). Modeling Huntington disease in yeast: perspectives and future directions. Prion5, 269–276.
Mastronarde, D.N. (2005). Automated electron microscope tomography using robust prediction of specimen movements. J. Struct. Biol.152, 36–51.
Meriin, A.B., Zhang, X., He, X., Newnam, G.P., Chernoff, Y.O., and Sherman, M.Y. (2002). Huntington toxicity in yeast model depends on polyglutamine ag-gregation mediated by a prion-like protein Rnq1. J. Cell Biol.157, 997–1004.
Michalik, A., and Van Broeckhoven, C. (2003). Pathogenesis of polyglutamine disorders: aggregation revisited. Hum. Mol. Genet.12, R173–R186.
Miller, J., Arrasate, M., Brooks, E., Libeu, C.P., Legleiter, J., Hatters, D., Curtis, J., Cheung, K., Krishnan, P., Mitra, S., et al. (2011). Identifying polyglutamine protein species in situ that best predict neurodegeneration. Nat. Chem. Biol. 7, 925–934.
Molliex, A., Temirov, J., Lee, J., Coughlin, M., Kanagaraj, A.P., Kim, H.J., Mittag, T., and Taylor, J.P. (2015). Phase separation by low complexity do-mains promotes stress granule assembly and drives pathological fibrillization. Cell163, 123–133.
Mumberg, D., M€uller, R., and Funk, M. (1995). Yeast vectors for the controlled expression of heterologous proteins in different genetic backgrounds. Gene 156, 119–122.
Nath, S., Munsie, L.N., and Truant, R. (2015). A huntingtin-mediated fast stress response halting endosomal trafficking is defective in Huntington’s disease. Hum. Mol. Genet.24, 450–462.
Nott, T.J., Petsalaki, E., Farber, P., Jervis, D., Fussner, E., Plochowietz, A., Craggs, T.D., Bazett-Jones, D.P., Pawson, T., Forman-Kay, J.D., and Baldwin, A.J. (2015). Phase transition of a disordered nuage protein generates environmentally responsive membraneless organelles. Mol. Cell57, 936–947.
Ossato, G., Digman, M.A., Aiken, C., Lukacsovich, T., Marsh, J.L., and Gratton, E. (2010). A two-step path to inclusion formation of huntingtin pep-tides revealed by number and brightness analysis. Biophys. J.98, 3078–3085.
Otsu, N. (1979). A threshold selection method from gray-level histograms. IEEE Trans. Syst. Man Cybern.9, 62–66.
Patel, S.S., Belmont, B.J., Sante, J.M., and Rexach, M.F. (2007). Natively unfolded nucleoporins gate protein diffusion across the nuclear pore complex. Cell129, 83–96.
Patel, A., Lee, H.O., Jawerth, L., Maharana, S., Jahnel, M., Hein, M.Y., Stoynov, S., Mahamid, J., Saha, S., Franzmann, T.M., et al. (2015). A liquid-to-solid phase transition of the ALS protein FUS accelerated by disease muta-tion. Cell162, 1066–1077.
Poirier, M.A., Li, H., Macosko, J., Cai, S., Amzel, M., and Ross, C.A. (2002). Huntingtin spheroids and protofibrils as precursors in polyglutamine fibriliza-tion. J. Biol. Chem.277, 41032–41037.
Ramaswami, M., Taylor, J.P., and Parker, R. (2013). Altered ribostasis: RNA-protein granules in degenerative disorders. Cell154, 727–736.
Ribbeck, K., and Go¨rlich, D. (2002). The permeability barrier of nuclear pore complexes appears to operate via hydrophobic exclusion. EMBO J. 21, 2664–2671.
Sathasivam, K., Neueder, A., Gipson, T.A., Landles, C., Benjamin, A.C., Bondulich, M.K., Smith, D.L., Faull, R.L.M., Roos, R.A.C., Howland, D., et al. (2013). Aberrant splicing of HTT generates the pathogenic exon 1 protein in Huntington disease. Proc. Natl. Acad. Sci. USA110, 2366–2370.
Savas, J.N., Makusky, A., Ottosen, S., Baillat, D., Then, F., Krainc, D., Shiekhattar, R., Markey, S.P., and Tanese, N. (2008). Huntington’s disease protein contributes to RNA-mediated gene silencing through association with Argonaute and P bodies. Proc. Natl. Acad. Sci. USA105, 10820–10825.
Schaefer, M.H., Wanker, E.E., and Andrade-Navarro, M.A. (2012). Evolution and function of CAG/polyglutamine repeats in protein-protein interaction net-works. Nucleic Acids Res.40, 4273–4287.
Scherzinger, E., Lurz, R., Turmaine, M., Mangiarini, L., Hollenbach, B., Hasenbank, R., Bates, G.P., Davies, S.W., Lehrach, H., and Wanker, E.E. (1997). Huntingtin-encoded polyglutamine expansions form amyloid-like pro-tein aggregates in vitro and in vivo. Cell90, 549–558.
Schilling, G., Klevytska, A., Tebbenkamp, A.T.N., Juenemann, K., Cooper, J., Gonzales, V., Slunt, H., Poirer, M., Ross, C.A., and Borchelt, D.R. (2007). Characterization of huntingtin pathologic fragments in human Huntington dis-ease, transgenic mice, and cell models. J. Neuropathol. Exp. Neurol.66, 313–320.
Schindelin, J., Arganda-Carreras, I., Frise, E., Kaynig, V., Longair, M., Pietzsch, T., Preibisch, S., Rueden, C., Saalfeld, S., Schmid, B., et al. (2012). Fiji: an open-source platform for biological-image analysis. Nat. Methods9, 676–682.
Sikorski, R.S., and Hieter, P. (1989). A system of shuttle vectors and yeast host strains designed for efficient manipulation of DNA in Saccharomyces cerevi-siae. Genetics122, 19–27.
Slow, E.J., Graham, R.K., Osmand, A.P., Devon, R.S., Lu, G., Deng, Y., Pearson, J., Vaid, K., Bissada, N., Wetzel, R., et al. (2005). Absence of behav-ioral abnormalities and neurodegeneration in vivo despite widespread neuronal huntingtin inclusions. Proc. Natl. Acad. Sci. USA102, 11402–11407.
Souquere, S., Mollet, S., Kress, M., Dautry, F., Pierron, G., and Weil, D. (2009). Unravelling the ultrastructure of stress granules and associated P-bodies in human cells. J. Cell Sci.122, 3619–3626.
Takahashi, Y., Okamoto, Y., Popiel, H.A., Fujikake, N., Toda, T., Kinjo, M., and Nagai, Y. (2007). Detection of polyglutamine protein oligomers in cells by fluo-rescence correlation spectroscopy. J. Biol. Chem.282, 24039–24048.
Tartari, M., Gissi, C., Lo Sardo, V., Zuccato, C., Picardi, E., Pesole, G., and Cattaneo, E. (2008). Phylogenetic comparison of huntingtin homologues re-veals the appearance of a primitive polyQ in sea urchin. Mol. Biol. Evol.25, 330–338.
ten Wolde, P.R., and Frenkel, D. (1997). Enhancement of protein crystal nucle-ation by critical density fluctunucle-ations. Science277, 1975–1978.
Thakur, A.K., Jayaraman, M., Mishra, R., Thakur, M., Chellgren, V.M., Byeon, I.-J.L., Anjum, D.H., Kodali, R., Creamer, T.P., Conway, J.F., et al. (2009). Polyglutamine disruption of the huntingtin exon 1 N terminus triggers a com-plex aggregation mechanism. Nat. Struct. Mol. Biol.16, 380–389.
The´venaz, P., Ruttimann, U.E., and Unser, M. (1998). A pyramid approach to subpixel registration based on intensity. IEEE Trans. Image Process.7, 27–41.
Tyedmers, J., Treusch, S., Dong, J., McCaffery, J.M., Bevis, B., and Lindquist, S. (2010). Prion induction involves an ancient system for the sequestration of aggregated proteins and heritable changes in prion fragmentation. Proc. Natl. Acad. Sci. USA107, 8633–8638.
Vitalis, A., and Pappu, R.V. (2011). Assessing the contribution of heteroge-neous distributions of oligomers to aggregation mechanisms of polyglutamine peptides. Biophys. Chem.159, 14–23.
Wetzel, R. (2012). Physical chemistry of polyglutamine: intriguing tales of a monotonous sequence. J. Mol. Biol.421, 466–490.
Woerner, A.C., Frottin, F., Hornburg, D., Feng, L.R., Meissner, F., Patra, M., Tatzelt, J., Mann, M., Winklhofer, K.F., Hartl, F.U., and Hipp, M.S. (2016). Cytoplasmic protein aggregates interfere with nucleocytoplasmic transport of protein and RNA. Science351, 173–176.
Zacharias, D.A., Violin, J.D., Newton, A.C., and Tsien, R.Y. (2002). Partitioning of lipid-modified monomeric GFPs into membrane microdomains of live cells. Science296, 913–916.
Zhang, M., Chang, H., Zhang, Y., Yu, J., Wu, L., Ji, W., Chen, J., Liu, B., Lu, J., Liu, Y., et al. (2012). Rational design of true monomeric and bright photoacti-vatable fluorescent proteins. Nat. Methods9, 727–729.
STAR
+
METHODS
KEY RESOURCES TABLE
REAGENT or RESOURCE SOURCE IDENTIFIER Antibodies
Anti-GFP Clontech Laboratories Cat# 632381, RRID: AB_2313808 Anti-TIA-1 Santa Cruz Biotechnology Cat# sc-1751, RRID: AB_2201433 Anti-G3BP BD Biosciences Cat# 611126, RRID: AB_398437 Goat anti-Mouse IgG (H+L) Secondary Antibody,
DyLight 488
Thermo Fisher Scientific Cat# 35502, RRID: AB_844397 Bacterial and Virus Strains
Rosetta DE3 competent cells Merck Millipore 70954 Chemicals, Peptides, and Recombinant Proteins
99% 1,6-hexanediol Sigma-Aldrich 240117 Dextran fromLeuconostoc mesenteroides(average
mol wt 64-76k)
Sigma-Aldrich D8821 25QP-GFP This study N/A 43QP-GFP This study N/A Experimental Models: Cell Lines
HEK293 ATCC CRL-1573
Flp-In 293 Thermo Fisher Scientific R75007 Flp-In 293 - 25QP-GFP This study N/A Flp-In 293 - 97QP-GFP This study N/A Experimental Models: Organisms/Strains
S. cerevisiae: Strain background: 74-D694 Chernoff et al., 1995 N/A Recombinant DNA
Plasmid: p425GAL1 (yeast) Mumberg et al., 1995 N/A Plasmid: 97QP-GFP (yeast) This study N/A Plasmid: 97Q-GFP (yeast) This study N/A Plasmid: 43QP-GFP (yeast) This study N/A Plasmid: 43Q-GFP (yeast) This study N/A Plasmid: 25QP-GFP (yeast) This study N/A Plasmid: 97QP-mEOS3.1 (yeast) This study N/A Plasmid: 25Q-GFP (yeast) This study N/A Plasmid: 97QP-GFP (mammalian) This study N/A Plasmid: 43QP-GFP (mammalian) This study N/A Plasmid: 25QP-GFP (mammalian) This study N/A
Plasmid: pET His6-MBP-Asn10 TEV LIC vector Scott Gradia Addgene 29654 Software and Algorithms
MATLAB N/A https://www.mathworks.com/products/matlab.html
Python N/A https://www.python.org/
Fiji Schindelin et al., 2012 https://fiji.sc/
R N/A https://www.r-project.org/
Bayesian tracking library Bove et al., 2017 https://github.com/quantumjot/BayesianTracker
TensorFlow Abadi et al., 2016 https://www.tensorflow.org/
IMOD Kremer et al., 1996 http://bio3d.colorado.edu/imod/
SerialEM Mastronarde, 2005 http://bio3d.colorado.edu/SerialEM/
CONTACT FOR REAGENT AND RESOURCES SHARING
Further information and requests for resources and reagents should be directed to and will be fulfilled by the Lead Contact, Helen Saibil ([email protected]).
EXPERIMENTAL MODEL AND SUBJECT DETAILS
Bacterial Culture
Recombinant HTTex1-GFP was expressed as a His6-MBP-Asn10fusion inE. coliRosetta (DE3) competent cells (Merck Millipore; Billerica, MA). Cells were grown in LB media and expression was induced at an OD600of 0.8 with 1 mM IPTG and grown overnight at 12C. Cells were pelleted by centrifugation and resuspended in 150 mM NaCl, 50 mM Na2HPO4/NaH2PO4(pH 7.4) and protease inhibitors (Roche). Cells were lysed by sonication using a VC 130 sonicator (Sonics and Materials; Newtown, CT) and the lysate was clarified by centrifugation at 4C.
Yeast Culture
Yeast cells were grown using standard culturing techniques in YPD (1% yeast extract, 2% peptone, 2% glucose), or synthetic dropout media (0.7% yeast nitrogen base without amino acids, 2% glucose) for auxotrophic selection of plasmids. Excess adenine (100 mg/L) was included in all experiments. For induction of galactose-controlled expression, cells were grown in media containing raffinose as the sole carbon source for several doublings to an OD600of 0.5-0.7 then washed and switched to media containing galac-tose as the sole carbon source to induce protein expression. Cells were grown at 30C with shaking at 220 rpm.
Mammalian Cell Culture
HEK293 cells were maintained in DMEM (Thermo Fisher Scientific), supplemented with 10% FBS and maintained at 37C, 5% CO2 atmosphere. Before live cell imaging, cells were switched to FluoroBrite DMEM (Thermo Fisher Scientific) containing doxycycline (150ng/mL).
METHOD DETAILS
Yeast Methods
Yeast strains for the analysis of HTTex1assemblies were derived from the 74-D694 background (MATa, ade1-14 ura3-52 leu2-3, 112 trp1-289 his3-D200;Chernoff et al., 1995). To generate the HTTex1-eGFP expression plasmids, an N-terminal FLAG tag was added to existing sequences (Dehay and Bertolotti, 2006) by PCR amplification, and these were cloned into the 2mexpression plasmid p425GAL1 (Sikorski and Hieter, 1989) at SpeI-SalI sites. The integrity of all clones was confirmed by sequencing. As eGFP has a pro-pensity to dimerize (Zacharias et al., 2002), we generated a 97QP construct fused to the monomeric fluorescent protein mEOS3.1 (Zhang et al., 2012), to confirm that we observed both types of assembly regardless of the fluorescent protein tag. The 97QP-mEOS3.1 construct was generated by splicing overhang extension (SOEing) PCR (Horton et al., 1989) of 97QP and mEOS3.1 fragments. To ensure that polyQ lengths were exactly matched between P-rich ± proteins, it was necessary to synthesize the sequences for 97Q-GFP and 43Q-GFP (GenScript). Transformation of cells was carried out using a standard lithium acetate method.
Prion Curing
Yeast cells were cured by passaging over 2% glucose YPD plates (see yeast methods) containing 5 mM Gd-HCl (Cox et al., 1988), 4 times, so that aggregation could be compared in isogenic [RNQ+]/[rnq-] strains. To confirm prion curing, we transformed the [RNQ+]/ [rnq-] strains with a plasmid encoding Rnq1-GFP and induced its expression for 4 hr before checking cells by fluorescence microscopy. Continued
REAGENT or RESOURCE SOURCE IDENTIFIER Other
Dot blot device Bio-Rad Laboratories 1706545 35mm Dish, No. 1.5 high tolerance coverslip, 14mm
Glass diameter
Mattek P35G-0.170-14-C Micron-slide VI 0.4 Ibidi 80601
Rnq1-GFP formed aggregates in the [RNQ+] strain but not in the [rnq-] strain (Figure S3C), confirming that the [rnq-] strain had been cured of the prion form of Rnq1. [RNQ+] and [rnq-] strains both gave rise to the expected patterns of toxicity (Figure S5B;Meriin et al., 2002).
Yeast Toxicity Assay
Strains were grown to exponential phase in selective media with 2% glucose (see yeast methods), washed in sterile water, and normalized to an OD600of 0.1. 4x 5-fold serial dilutions of cells were spotted onto selective medium agar plates containing galactose (induction) or glucose (repression). A multi-channel pipette was used to make sure that spots were aligned. Older plates were used to prevent the spots from running into one another when applying the dilutions (we used 5mL per spot but this may require optimization depending on the concentration of cells and the composition of the plates). Plates were photographed 2-3 days later ( Duenn-wald, 2012).
Yeast Expression Levels
After 4 or 24 hr induction, cell densities were normalized for all samples (OD600measurement), pelleted by centrifugation (1800 g, 10 min) and re-suspended in cold lysis buffer (50 mM Tris HCl, pH 7.4, 150 mM NaCl, 0.5 mM DTT, 50mg/ml heparin, 1:5000 antifoam A concentrate (Sigma-Aldrich; St. Louis, MO), 1 complete mini EDTA free protease inhibitor tablet per 50 mL (Roche; Basel, Switzerland)). Samples were lysed in lysis buffer by vortexing with 425-600mm acid-washed glass beads (Sigma-Aldrich), for 6x cycles of vortexing (1 min) and cooling on ice (1 min). Lysates were cleared of cellular debris by centrifugation (800 g, 2 min), then 4x 5-fold serially diluted and applied to a 0.2mm nitrocellulose membrane (Bio-Rad; Hercules, CA) using a Bio-Dot Apparatus (Bio-Rad). HTTex1-GFP proteins were detected using a Living Colors A.v. Monoclonal Antibody JL-8 (Clontech Laboratories; Mountain View, CA), Goat anti-mouse IgG (H+L) secondary antibody, DyLight 488 (Thermo Fisher Scientific; Waltham, MA) and FLA-3000 fluorescent image analyzer (Fujifilm; Tokyo, Japan).
Quantitative Dot Blots
Yeast lysates were prepared as described above, serially diluted, and blotted onto nitrocellulose membranes, along with a series of ten 2-fold serial dilutions of purified 25QP-GFP at a known concentration (from a starting concentration of 2mM). The resulting blots were probed and imaged as described above and analyzed in Fiji. First, the images were inverted and background subtracted using a rolling ball radius of 10. Equally sized circles, the sizes of dots, were centered on each dot and used to measure the raw integrated density of the fluorescence signal from each dot. The dots made by purified 25QP-GFP were used to generate calibration curves by plotting the raw integrated density against the known concentration of the protein (Figure 5B). The calibration curves were generated by fitting the data to a hyperbolic curve,
Raw integrated density=a3 ½protein b+½protein
with a and b being free parameters (Janes, 2015). The concentrations of HTTex1proteins in the lysates were determined using the calibration curve generated from the same blot. The intracellular concentrations of HTTex1proteins were then estimated based on the number of cells contributing to each dot.
Mammalian Cell Methods
DNA sequences for the HTTex1-GFP constructs were taken from the yeast expression plasmids and inserted into the pcDNA5-FRT-TO (Thermo Fisher Scientific) mammalian expression vector allowing doxycycline-inducible expression of the construct. At 80%–90% confluency, cells were transfected with expression plasmids using Lipofectamine 2000 (Thermo Fisher Scientific) accord-ing to the manufacturer’s protocol, and HTTex1-GFP expression was induced using doxycycline (150 ng/mL). The Flp-In HEK293 HTTex1-GFP (25 and 97QP) isogenic stable cell lines were generated using Flp-In System (Invitrogen) following the manufacturer’s protocol. Briefly, pcDNA5-FRT-TO expressing HTTex1-GFP constructs were co-transfected with pOG44 plasmid (Invitrogen), which constitutively expresses the Flp recombinase. Stable Flp-In expression cell lines were selected for hygromycin resistance. HTTex1 -GFP was induced using doxycycline (150ng/mL).
Arsenite-induced Stress Granule Formation and Immunofluorescence
Time-lapse Experiments
HEK293 cells were initially plated and transfected in 35 mm glass-bottomed dishes No. 1.5 (MatTek; Ashland, MA) coated with poly-D-lysine. To begin induction, the medium was switched to FluoroBrite DMEM (Thermo Fisher Scientific), supplemented with 10% FCS containing doxycycline (150 ng/mL). Cells were allowed to incubate for 2 hr then transferred to an incubator microscope (described below). Cells were maintained at 37C, 5% CO2and imaged for 24-48 hr. Typically, we imaged around 10 positions of a dish with a frame rate of3 mins.
Incubator Microscope
A custom-built automated epifluorescence microscope was built inside a standard CO2incubator (Thermo Fisher Scientific; Heraeus BL20) that maintained the temperature at 37C and in a 5% CO2atmosphere. The microscope comprised a high performance motor-ized stage (Prior Scientific, Cambridge, UK; Proscan III, H117E2IX), with a motorised focus controller (Prior; FB201 and PS3H122R) and a 9.1MP CCD camera (FLIR, Wilsonville, OR; Point Grey GS3-U3-91S6M). Brightfield illumination was provided using a green LED (Thorlabs, Newton, NJ; M520L3, 520 nm). Fluorescence illumination in two channels, GFP and mCherry/RFP, was via a blue (Thorlabs; M470L3, 470 nm) or yellow (Thorlabs; M565L3, 565 nm) LED respectively. These were combined using a dichroic beams-plitter (Semrock, Rochester, NY), and focused onto the back focal plane of a 20x air objective (Olympus 20x, 0.4NA) in an epifluor-escence configuration. The camera and the LEDs were synchronized using TTL pulses from an external D/A converter (Data Trans-lation, Marlborough, MA; DT9834). A custom built humidified chamber maintained the humidity around the sample and was fitted with a thermocouple and humidity sensor to continuously monitor the environment.
Single Cell Tracking
Computational cell tracking was performed as previously described (Bove et al., 2017), using the time-lapse movies that were collected on the incubator microscope described above. Briefly, we trained a deep convolutional neural network (CNN) to segment cells from movie frames based on a training dataset of500 manually segmented cells. The only input to the network was the bright-field transmission channel. To increase the number of training examples, we augmented the examples by introducing random trans-formations, rotations, and flips. Training was performed using a momentum optimizer with an exponentially decaying learning rate until convergence. We used dropout (50% while training) to prevent over-fitting. The CNN was implemented using Tensorflow (https://www.tensorflow.org) (Abadi et al., 2016). Next, the centroids of each segmented cell were tracked using a Bayesian tracking method (https://github.com/quantumjot/BayesianTracker). The tracking procedure resulted in trajectories of single cells over time. Well-tracked cells were then selected and a custom Python (https://www.python.org) script was used to generate the time-resolved histograms of fluorescence intensity, using the segmentation output as a mask. These were further analyzed and plotted using R (https://www.r-project.org).
Hexanediol Experiments
Yeast cells were grown in the appropriate selection media and expression of HTTex1constructs was induced with galactose (see yeast methods) until assemblies formed. Yeast cells were adhered to concanavalin A (Sigma) coated chamber slides (m-Slide VI0.4; Ibidi, Germany) and unbound cells were removed by washing. Slides were mounted on a custom-built TIRF microscope (see Total Internal Reflection Fluorescence (TIRF) Microscopy) set up in a wide-field fluorescence configuration, with the temperature maintained at 30C. Time-lapse movies with a frame rate of 5 s were acquired as solutions of either 10% 1,6-hexanediol (Sigma) + 10mg/mL digitonin (Sigma), or digitonin alone, in yeast growth medium, were injected into the chambers. Hexanediol removal was done by injecting excess fresh yeast growth medium back into the chambers. Movies were analyzed in Fiji (Schindelin et al., 2012). Bleach correction was carried out with the Bleach Correction plugin (https://imagej.net/Bleach_Correction), using the simple ratio method and making use of cells that did not contain assemblies. Kymographs were generated using the Fiji ‘‘reslice’’ command and the change in fluorescence was quantified over time and plotted using R.
FRAP Methods
FRAP was performed using a Leica TCS SP5 microscope equipped with an HCX Plan-Apochromat lambda blue 63x oil-immersion objective (NA 1.4). Intracellular assemblies were bleached in a circular 0.28m2region of interest using a 0.2 s pulse of the 488 nm laser line at full power. Recovery was monitored every 0.116 s for 400 frames. The recovery curves were analyzed using the jython script,