OPTIMIZATION OF PROCESS PARAMETERS FOR FRICTION STIR
WELDING ALUMINIUM 6061 USING RESPONSE SURFACE
METHODOLOGY
M.Sesha Srinivas1 Dr .M.V.R.D Prasad2
1 Research scholar at Department of Mechanical Engineering, VNR Vignana Jyothi Institute of
Engineering and Technology, Hyderabad, Telangana, India.
2 Professor ,Department of Mechanical Engineering, , VNR Vignana Jyothi Institute of
Engineering and Technology, Hyderabad, Telangana, India.
ABSTRACT
Friction Stir Welding (FSW) was invented by Wayne Thomas at TWI (The Welding Institute),
U.K in December 1991. Since then it has become a major joining process in the aerospace,
railway and ship building industries especially in the fabrication of aluminium alloys and many
other applications of commercial importance. The welding parameters play a major role in
deciding the joint characteristics of friction stir welded joints. When these parameters are
improperly configured or out of range for the equipment or materials, this can lead to a variety of
problems. In the present work process parameters Rotational speed, feed and tool tilt angle were
optimized that would give Maximum Ultimate tensile Strength (U.T.S) of Friction stir welding
AL-6061 T6 alloy. The experimental design was carried out using response surface
methodology-box behnken design and optimization using the synthesis 9 statistical software.
KEYWORDS: Friction Stir Welding (FSW), Response Surface Methodology, Optimization, box behnken design
Friction-stir welding (FSW) is a solid-state joining process invented by Wayne Thomas at TWI
Ltd in 1991; it uses a constantly rotated non consumable cylindrical-shouldered tool with a
profiled probe is transversely fed at a constant rate into a butt joint between two clamped pieces
of butted material. The probe is slightly shorter than the weld depth required, with the tool
shoulder riding at top of the work surface.
Frictional heat is generated between the wear-resistant welding components and the work pieces.
This heat, along with that generated by the mechanical mixing process and the adiabatic heat
within the material, cause the stirred materials to soften without melting. As the pin is moved
forward, a special profile on its leading face forces plasticized material to the rear where
clamping force assists in a forged consolidation of the weld.The process advantages result from
the fact that the FSW process takes place in the solid phase below the melting point of the
materials to be joined. The benefits include the ability to join materials that are difficult to fusion
weld, for example, 2XXX and 7XXX aluminium alloys, magnesium and copper, Low distortion
and shrinkage, even in long welds, Excellent mechanical properties in fatigue, tensile and bend
tests. Friction stir welding can be performed using purpose-designed equipment or by a modified
existing machine tool technology such as a milling machine. The process is also suitable for
automation and is adaptable for robot use. The other benefits include.
Tool design, Tool tilt, plunge depth, Welding Forces, Tool rotation and traverse speeds, are some
of the variables that affect weld penetration, bead geometry and overall weld quality:
When these parameters are improperly configured or out of range for the equipment or materials,
this can lead to a variety of problems. Knowledge and control of these variables is essential to
consistently produce welds of satisfactory quality. These variables are not completely
independent, and on changing one generally require changing the other or more to produce the
desired results.
TABLE 1
Chemical Composition of Al-6061
Si% Fe% Cu% Mn% Mg% Cr% Zn% Ti% Al%
0.51 0.37 0.19 0.106 0.955 0.223 0.001 0.017 Rem
LITERATURE REVIEW
LITERATURE REVIEW
Ramaraju Ramgopal Varma et.al [1] conducted experiments on Aluminum 5083 and aluminum 6061 sheets of 5mm thick. They designed experiments using taguchi L8 orthogonal
array The mechanical properties like the yield strength, elongation, tensile strength and micro
hardness of these joints fabricated were evaluated and found that The tensile behavior and
hardness values increase when the rotational speed and axial force is increased keeping the weld
speed constant. There is a decrease in the same when the weld speed is increased keeping the
parameters constant.
A. Pradeep et.al [2] performed FSW on Steel by designing experiments using an L9 orthogonal array with process parameters taken tool rotational speed, tool tilt angle and travel speed and
then carried out ANOVA to predict the optimal strength. The results found are The optimum
combination of parameters obtained from the main effect plot for the S/N ratio and mean is
1120rpm rotational speed, 1° tool tilt angle and 8mm/min traverse speed, and the tensile strength
has been predicted as 472 MPa.
G. Elatharasan,V.S et.al [3] performed experiments on Al-6061 alloy using experiments designed in RSM CCD design and found that UTS and YS of the FS welded joints increased
with the increase of tool rotational speed, welding speed and tool axial force up to a maximum
S. Rajakumar et.al [4] has done research on the tensile strength and hardness along with the corrosion rate of friction-stir-butt welded joints of AA6061-T6 aluminium alloy. The
relationships between the FSW parameters (rotational speed, welding speed, axial force, shoulder
diameter, pin diameter and tool hardness) and the responses (tensile strength, hardness and
corrosion rate) were evaluated . The results of the study were tool rotational speed between 1155
and 1157 rpm is an optimum input to obtain an excellent welded component produced from
AA6061-T6 aluminium alloy.
P.Prasanna et.al [5] used the gray based taguchi method which is a multiple response process is used to optimize the factors four major controllable factors each one at four levels namely
rotation speed(600, 700, 800, 900rpm), Welding speed(10, 14, 16, 19mm/min), pin tool
length(5.3, 5.5, 5.7, 5.9mm), tool pin offset distance(0.1, 0.2, 0.3, 0.4mm) are used for ANOVA
based on Taguchi’s recommendation of the larger the better, S/N ratios, S/N1, S/N2, and S/N3.
For the ultimate tensile strength and the elongation rate, respectively, were computed and The
optimal FSW process parameter combinations are rotation speed at 800rpm, welding speed at
10mm/min, tool pin length 5.7mm and offset distance 0.4mm for the best multiple performance
characteristics and cost.
Biswajit Parida et.al [6] welded 6mm thick commercial grade aluminum plates using a 6mm diameter straight cylindrical probe / pin FSW tool. Following conclusions were drawn from the
study. The hardness values of the weld zone and HAZ are lower than the base material which
indicates the improved ductility of the weld. From the micro-structural study it has been
observed that the weld zone is stirred and having more grain refinement as compared to the HAZ
zone.
Indira Rani M Et.Al [7] optimized FSW parameters in different conditions of base material and the microstructures of the FS-welded condition were compared with the post weld heat treated
microstructures welded in annealed and T6 condition and concluded that in annealed condition
tool rotation speed 800 rpm and welding speed 10 mm/min and 15 mm/min are the optimal
parameters. The tool rotation speed 1000 rpm and welding speed 10 mm/min are the optimal
M. S. Srinivasa Rao et.al [8] carried out experimental work has been with different tool shapes like taper threaded tool and half grooved tool at various weld parameters. Tensile properties of
the weldments like tensile strength, hardness and measurements of temperature at various
distances along the weld zone on the weldments were found out and drew the following
conclusions the variation in peak temperature perpendicular to the weld line at constant
rotational speed and constant welding speed. Variation of the nugget–zone temperature with
respect to time. Experimentally the maximum temperature is obtained during FSW process by
using half grooved tool is 4450°c and 4200°c by using taper threaded.
Al-Badrawy A. Abo El-Nasr [9] experimented on joining 7075-T6 Al alloy plates to obtain the best conditions for friction stir welding (FSW) of this alloy The mechanical properties were
obtained using tensile and micro hardness tests. and found that the optimum test condition is
obtained at a rotational speed of 840 rpm and a feed rate of 122 mm/min.
RajKumar.V et. al [10] dealt with the characterization of friction stir welded dissimilar Aluminium alloys AA 5052 and AA6061. The friction - stir welding was done using cylindrical
pin tool using at constant speed of 710 rpm and at two different feed rates of 28 and 20 mm/min.
The results showed that Cylindrical threaded pin has rendered excellent bondage between both
alloys (AA 5052 and AA 6061) by effective friction stir joining.
EXPERIMENTAL WORK
The experimental work was carried out in 4 phases. In the first phase the process parameters and
their levels were found out. This is done by examining various literature reviews, and then the
experiments were planned using the Response surface methodology. Before going further in our
discussion it is important to know what Response Surface Methodology (RSM) is. It is a
collection of mathematical and statistical techniques useful for the modeling and analysis of
problems in which a response of interest is influenced by several variables and the objective is to
optimize this response. The simplest such model has the quadratic form
Containing linear terms for all factors, squared terms for all factors, and products of all pairs of
factors. The variables x1 and x2 are independent variables where the response y depends on them.
The dependent variable y is a function of x1, x2, and the experimental error term, denoted as e.
The error term e represents any measurement error on the response. There are two types of RSM
Models .Central Composite Design (CCD) and Box Behnken Design
Central composite designs are response surface designs that can fit a full quadratic model. To
picture a central composite design, imagine you have several factors that can vary between low
and high values. For convenience, suppose each factor varies from -1 to +1. One central
composite design consists of cube points at the corners of a unit cube that is the product of the
intervals [-1,1], star points along the axes at or outside the cube, and center points at the origin as
shown in the figure 1 (a) Central composite designs are of three types. Circumscribed (CCC)
designs are as described above. Inscribed (CCI) designs are as described above, but scaled so the
star points take the values -1 and +1, and the cube points lie in the interior of the cube. Faced
(CCF) designs have the star points on the faces of the cube. Faced designs have three levels per
factor, in contrast with the other types that have five levels per factor.
The Box-Behnken design is an independent quadratic design in that it does not contain an
embedded factorial or fractional factorial design. In this design the treatment combinations are at
the midpoints of edges of the process space and at the center. These designs are rotatable (or near
rotatable) and require 3 levels of each factor.
FIGURE 1
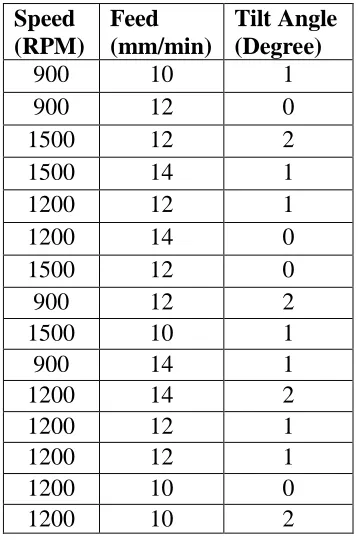
The Experiments in the Current Work are designed using Box-Behnken design as this design
would require fewer runs compared to CCD with same number of parameters. It is shown in
table 2. The levels chosen for each factor are speed 900-1500 Rpm, Feed 10-14 Mm/Min and
tool tilt angle 0-2 Degrees
[image:7.612.217.396.306.576.2]
TABLE 2
Experiments Designed Using Box-Behnken design
Speed (RPM)
Feed (mm/min)
Tilt Angle (Degree)
900 10 1
900 12 0
1500 12 2
1500 14 1
1200 12 1
1200 14 0
1500 12 0
900 12 2
1500 10 1
900 14 1
1200 14 2
1200 12 1
1200 12 1
1200 10 0
1200 10 2
In the second phase tool design and welding were carried out .A taper threaded cylindrical tool
with shoulder diameter 18 mm, pin diameter 5mm at the shoulder & 4 mm at the contact surface
with a thread pitch of 1mm for efficient stirring of the metal and for effective filling of the
designing the tool as the experiments are carried out on tilting angle. The tool material used for
making tool is H13 tool steel, finally friction stir welding was carried out on the work pieces of
dimensions 200mmX100mmX5mm on a vertical CNC Milling machine by holding the plates to
be welded securely in fixture so that plates stay in place & do not fly away due to welding forces.
[image:8.612.79.559.266.427.2]The set up is shown in the Figure 2 (a)
FIGURE 2
(a)Performing FSW Welding (b) Welded Pieces
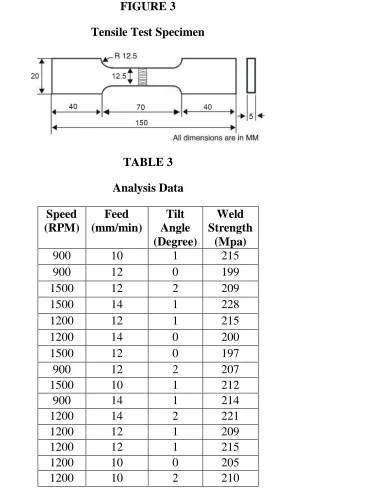
In the third phase the welded pieces are subjected to tensile tests on a universal testing machine
to evaluate the strength of welded joints and the results were noted down .The welded pieces are
FIGURE 3
Tensile Test Specimen
TABLE 3
Analysis Data
Speed (RPM)
Feed (mm/min)
Tilt Angle (Degree)
Weld Strength
(Mpa)
900 10 1 215
900 12 0 199
1500 12 2 209
1500 14 1 228
1200 12 1 215
1200 14 0 200
1500 12 0 197
900 12 2 207
1500 10 1 212
900 14 1 214
1200 14 2 221
1200 12 1 209
1200 12 1 215
1200 10 0 205
1200 10 2 210
RESULTS AND ANALYSIS
In the final phase Analysis of the data is carried out. When we analyze an experiment data we
are actually fitting a model to the data that estimates the effects of main and interaction terms on
ANOVA. The P-values in ANOVA Table is a measure of how likely the sample results are
assuming null hypothesis to be true. Hence this is used to find significant parameters. The terms
with P-value <0.05 (generally used) i.e 95% confidence interval are significant. In the present
work a confidence interval of 90% was taken. Hence the factors with P-value <0.1 are
significant. Before going further and finding out the significant terms it is necessary to know
whether our data satisfies the assumptions of ANOVA or not. The assumptions are
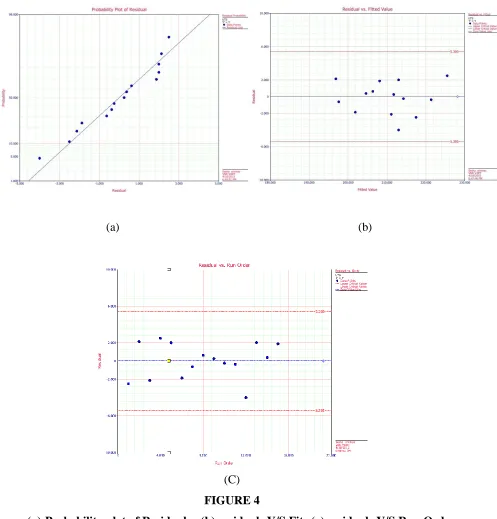
Normality – ANOVA requires the population in each treatment from which you draw your
sample be normally distributed. The population normality can be checked with a normal
probability plot of residuals Figure 4(a). If the distribution of residuals is normal, the plot will
resemble a straight line. The normal probability for the project is shown below which indicates
that data is normally distributed.
Constant Variance – The variance of the observations in each treatment should be equal. The
constant variance assumption can be checked with Residuals versus Fits plot Figure 4 (b). This
plot should show a random pattern of residuals on both sides of 0, and should not show any
recognizable patterns. A common pattern is that the residuals increase as the fitted values
increase.
Independence – ANOVA requires that the observations should be randomly selected from the
treatment population. The independence, especially of time related effects, can be checked with
the Residuals versus Order (time order of data collection) plot Figure 4 (c) . A positive
correlation or a negative correlation means the assumption is violated. If the plot does not reveal
(a) (b)
(C)
FIGURE 4
(a) Probability plot of Residuals (b) residuals V/S Fits (c) residuals V/S Run Order Plots
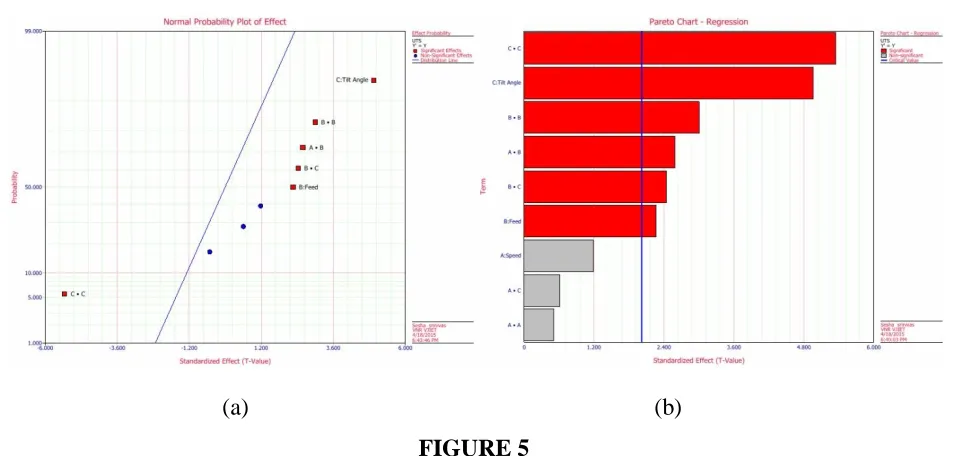
[image:11.612.74.571.83.602.2](a) (b)
FIGURE 5
(a) Normal Probability plot (b) Pareto Chart
[image:12.612.69.546.81.309.2]Now after checking the data for its truthfulness and finding out the significant terms that are affecting the response the final step is to optimize them. Hence optimization was carried using the response optimizer with a goal of maximizing the response i.e higher the better category. The results are shown in the graph below.
FIGURE 6
[image:12.612.154.460.421.703.2]CONCLUSIONS
The Following conclusions can be drawn from the present study
1. The process parameters B, C and the Interactions B*B, B*C, and A*B are found to be significant in determining the weld strength of the FS-Welded specimens.
2. The Optimization Plot showed that Speed=1500, Feed= 14 and a tilt angle = 1o would give a maximum strength of the FS- weldments.
REFERENCES
Journal Papers:
1. Ramaraju Ramgopal Varma Et.Al Mechanical Properties Of The Friction Stir Welded Dissimilar Aluminium Alloy Joints
2. A. Pradeep, S. Muthukumaran An Analysis To Optimize The Process Parameters Of Friction Stir Welded Low Alloy Steel Plates
3. G. Elatharasan,V.S. Senthil Kumar An experimental analysis and optimization of process parameter on friction stir welding of AA 6061-T6 aluminum alloy using RSM
4. S. Rajakumar Predicting tensile strength, hardness and corrosion rate of friction stir welded AA6061-T6 aluminium alloy joints
5. P.Prasanna, Dr.Ch.Penchalayya, Dr.D.Anandamohana Rao optimization and validation in friction stir welding AA 6061 using gray relational analysis
6. Biswajit Parida et.al Mechanical and Micro-structural Study of Friction Stir Welding of Al-alloy
7. Indira Rani M Et.Al A Study Of Process Parameters Of Friction Stir Welded Aa 6061 Aluminum Alloy In O And T6 Conditions
8. M. S. Srinivasa Rao Et.Al Experimental Study Of Weld Characteristics During Friction Stir Welding (Fsw) Of Aluminum Alloy (Aa6061-T6)
9. Al-Badrawy A. Abo El-Nasr Mechanical Properties and Fracture Behavior of Friction Stir Welded 7075-T6 Alloy
10. RajKumar.V et. al Studies on effect of tool design and welding parameters on the friction stir welding of dissimilar aluminium alloys AA 5052 – AA 6061
1. http://en.wikipedia.org/wiki/Friction_stir_welding
2. http://www.twi-global.com/technologies/welding-surface-engineering-and-material-processing/friction-stir-welding/benefits-and-advantages/
3. http://www.ijetae.com/files/Volume2Issue12/IJETAE_1212_50.pdf
4. http://www.twi-global.com/technologies/welding-surface-engineering-and-material-processing/friction-stir-welding/industrial-applications/
5. https://www.iusb.edu/math-compsci/_prior-thesis/NBradley_thesis.pdf 6. http://www.itl.nist.gov/div898/handbook/pri/section3/pri336.htm 7. http://in.mathworks.com/help/stats/response-surface-designs.html
8. http://www.oulu.fi/sites/default/files/content/Introduction%20to%20Experiment%20Desi gn_2013.pdf
9. http://en.wikipedia.org/wiki/Factorial_experiment
10. http://www.itl.nist.gov/div898/handbook/pri/section3/pri334.htm 11.
http://support.minitab.com/en-us/minitab/17/topic-library/modeling-statistics/doe/response-surface-designs/what-is-alpha-in-a-central-composite-design/ 12. http://www.aalco.co.uk/datasheets/Aluminium-Alloy-6061-T6-Extrusions_145.ashx 13. http://en.wikipedia.org/wiki/6061_aluminium_alloy
14. http://www.isixsigma.com/tools-templates/design-of-experiments-doe/design-experiments-%E2%90%93-primer/