Journal of Chemical and Pharmaceutical Research, 2014, 6(6):1237-1242
Research Article
CODEN(USA) : JCPRC5
ISSN : 0975-7384
Display instrument for electronic current transformer
Zhigang Di
*, Chunrong Jia and Jingxuan Zhang
College of Electrical Engineering, Hebei United University, Tangshan Hebei, China
_____________________________________________________________________________________________
ABSTRACT
In power system, electronic current transformer has been used to measure current for more than one hundred years, its performance has very important significance for the normal running of the power system. As the key part of the current transformer, the special display instrument also attracts lots of scientists. A special display instrument for electronic current transformer which applies to measuring small current was proposed in this article. The instrument utilized single chip computer and analog signal process to achieve the output voltage display of electronic current transformer. Besides, the instrument adopted a specific algorithm which did not require so much time-consuming calculation, it was simple for the hardware design, ensuring the accuracy of the display instrument on the base of low-cost. Also, the instrument had buttons and reset circuitry to enable external control. After experimental verification, the special display instrument for electronic current transformer can work reliably, the measurement result can meet the 0.2 national standard.
Key words: Electronic current transformer; current measurement; display instrument; single chip computer; signal
process
_____________________________________________________________________________________________
INTRODUCTION
In power system, electronic current transformer has been used to measure the current for more than one hundred years, it provides input signal for the measurement of power system, relay protection, control and surveillance[1]. As a result, the electronic current transformer plays a critical part in power system. With the continuous development of power system, higher requirements are putting forward on current transformer. The conventional electromagnetic current transformer exposed a series of serious shortcomings in running, cannot meet the requirement of the digital power station. Therefore, it is the inevitable trend that the new type of electronic current transformer will replace the traditional electromagnetic current transformer.
With the development of optoelectronic technology, a new type of electronic current transformer arises at the historic moment. Electronic current transformer has no oil, small size, the simple insulation structure, no security risks, output interface connected to the computer is convenient [2], so it is an ideal substitute product to replace the traditional electromagnetic current transformer.
Since the output of the mixed type optical current transformer is voltage signal, the amplitude and phase of the voltage signal directly reflects the size and phase of the current on power bus, it is different from the output of the conventional electromagnetic current transformer. To measure current of power system accurately, a lot of manpower and financial resources have been invested into the research of electronic current transformer at home and abroad[3]. As the key part of the electronic current transformer, the special display instruments are also attracting lots of scientists.
Fig.1: Diagram of fiber current transducer
In this transformer, ADC was utilized in high voltage side, DAC was utilized in low voltage side. The controlling time-series circuit must be adopted in high voltage side to keep ADC and DAC working synchronously. The main advantage of this fiber current transducer is that appropriate ADC can meet the accuracy requirement of system because ADC has high accuracy.
The display instrument is the most important part in fiber current transducer, the main function of display instrument is to sample alternating voltage signal from the low voltage side, then display the voltage effective value and wave form corresponding to measured current[4].
EXPERIMENTAL SECTION
1. The Overall Design
To measure current of power system accurately, special display instrument was proposed on the basis of analyzing the development background and the application advantages of the current transformer. The special display instrument for electronic current transformer especially applies to measure small current. The display instrument collects voltage output from low voltage side of current transformer, the analog signal input into the filtering circuit, then input into the ADC to converter into digital signal, and to be processed by the microcontroller. In the microcontroller, the digital signal corresponding to the voltage signal output by the current transformer will be calculated accurately utilizing a specific algorithm, at last, the calculation results will be shown on LCD, and display the waveform in real time. At the same time, the instrument responds the user’s orders such as data store and data view, and has no influence on data acquisition. The work flow-process was shown in figure 2.
The function modules of this instrument included data acquisition and processing, waveform display module. Data acquisition and processing module includes voltage signal acquisition, filtering, calculation, display, data store and view the results of the calculation. Waveform display module includes displaying current waveform in real-time. The function framework was shown in figure 3.
Fig.3:The function framework of display instrument
2. Hardware Design
The design of hardware includes data acquisition and processing module with the ATmega16A microcontroller as the core components, and real-time waveform display module with the STM32 microcontroller as the core components, mainly composed by the ATmega16A microcontroller, STM32 microcontroller, LCD1602, AD7894, AD780, LM7805, ILI9341, TFT color screen, keyboard and signal filter circuit, using the Altium Designer rendering circuit schematic diagram and PCB.
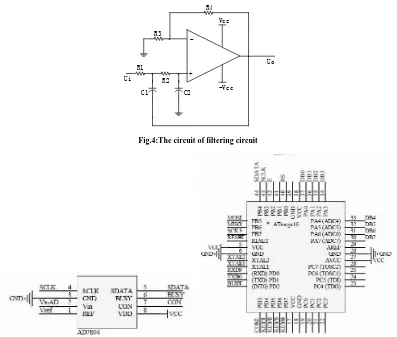
First, the voltage signal inputs active filtering circuit to filter random waves. The filtering circuit was shown in figure 4.
R2 R1
Vcc
-Vcc C2
C1 Ui
-+
Uo
.
.
.
.
R3 [image:3.595.108.505.398.735.2]R4
Fig.4:The circuit of filtering circuit
[image:3.595.233.385.404.525.2]Signal acquisition and processing module utilized AD7894 to collect the analog signal and converter into digital signal. Then digital signal go into microcontroller for core calculation, and display the calculation results on LCD. This design has peripheral button to enable the external control, user data can be stored in EEPROM by pushing button, as a result, this instrument will not lose data when power supply is breakdown, and may check and delete the data in EEPROM at any time. The circuit was shown in figure 5.
Waveform display module uses STM32 microcontroller and TFT color screen to display current waveform in real time, LCD control utilized the FSMC mode. Receiving data from data acquisition and processing module via a serial port and calculating the point need to display on the waveform according to the data, and display current waveform on bus in real-time.
3. Software Design
Software part in this design includes controller initialization, analog data acquisition and processing module, communication module and integrated information display module, etc. Mainly composed by data acquisition function, data screening function, core calculation function, information display function, waveform display function, interrupt service function and the main function and so on, using Atmel Studio 6 with C language programming and compiling.
Analog data acquisition and processing module use microcontroller to simulate the clock signal in the read sequential of AD7894, reading digital signals in serial. The digital signal just read participate in core calculation after conversion into the true value of the input voltage, the calculation results display through LCD. LCD displaying use flag driving, in other word, display function is always running in the main function, displaying different interface according to the flag. Flag changing when key handler is running, making the LCD shows different information to the user. The data acquisition and processing was shown in figure 7.
Fig.7: The flow chart of data acquisition and processing
Waveform display module can calculate the rest of the point in sinusoidal periodic according to the voltage peak value, and displays the waveform in real time according to the point calculated. Waveform displaying only fills the pixel which has changed, in other word, refreshing the pixel which has changed in this frame immediately after this frame has displayed already, then continue to display the next frame. The waveform can be mobile on the screen through the software algorithm, reflecting the current trends on the bus more vivid. As a result, the destination of displaying measured current in real time and linearly was realized, moreover, the waveform of measured current was displayed.
RESULTS AND DISCUSSION
Fig.8 The picture of designed instrument
More important, the experiment was carried on also. The whole experiment system was constitute by sensor head Rogowski coil[5], signal process system[6], display instrument and power supply system in high voltage section[7]. In the experiment of this system, WYP-4 stabilized voltage supply was adopted as current supply, DLB-1B 0.1 level high precise ampere meter, 0.1 level KEITHLEY2000 MULTIMETER digital multi-meter, and HG1841 power frequency phase meter to test according to the test points prescribed by GB1208-1997. The experiment results were shown in table 2.
Tab.2 The experiment results of instrument
Eo1(mV) 25 100 300 500 600
Eo2(mV) 24.81 99.82 299.42 499.15 601. 14
ε
% -0.76 -0.18 -0.19 -0.17 0.19Notes: Eo1 is theoretical output voltage; Eo2 is actual output voltage
Also, the waveform of measured current was shown in figure 9.
Fig.9: The waveform of measured current
From the result, this system meets the requirement of 0.2 level.
CONCLUSION
This paper elaborated the display instrument for electronic current transformer. To improve the performance, the designed display instrument adopted specific algorithm to achieve effective value of power frequency sinusoidal voltage, then utilized SCM to process the digital signal corresponding to input signal, and the effective value was displayed on LCD, besides, the waveform of measured current was displayed. From the experiment results, the error could be controlled less than 0.2%, so the designed display instrument was feasible and could meet the requirement of 0.2 level.
Acknowledgments
This research was supported in part by the Basic Research Program of Hebei province No. 12212172 and 12212201. A project supported by scientific research fund of Hebei provincial education department (ZD2013102); Doctor Scientific Research Foundation of Hebei United University.
REFERENCES
[2]Zhang Jian, Ji Hongquan, Yuan Zhenhai, et al., High Voltage Engineering, 2007, 33(5), 32-36.
[3]Wang Zhengping,Chong K,Zongjun H,et al., Optics and Laser Technology, 2005, 39(2), 368-371.
[4]Liu Tianbao, Fang Chun’en, Li Wei, et al., Low Voltage Apparatus, 2009, 51(1), 25-28. [5]Jia Chunrong, Di Zhigang, Zhang Qingling et al., High Voltage Apparatus, 2010, 46(3), 15-19. [6]Chunrong Jia, Zhigang Di, Jingxuan Zhang, Springer, 2012, 134(15), 345-351.