Modulation transfer function as a measure
of room low frequency performance
Fazenda, BM, Holland, KR, Newell, PR and Castro, SV
Title
Modulation transfer function as a measure of room low frequency
performance
Authors
Fazenda, BM, Holland, KR, Newell, PR and Castro, SV
Type
Conference or Workshop Item
URL
This version is available at: http://usir.salford.ac.uk/9447/
Published Date
2006
USIR is a digital collection of the research output of the University of Salford. Where copyright
permits, full text material held in the repository is made freely available online and can be read,
downloaded and copied for noncommercial private study or research purposes. Please check the
manuscript for any further copyright restrictions.
MODULATION TRANSFER FUNCTION AS A MEASURE OF
ROOM LOW FREQUENCY PERFORMANCE
BM Fazenda Music Technology, University of Huddersfield, UK KR Holland ISVR, University of Southampton, UK
PR Newell Consultant, Moaña, Spain SV Castro Reflexion Arts SL, Vigo,Spain
1 INTRODUCTION
In room acoustics, much debate exists over what quantities should be used to describe and acceptably prescribe accurate listening conditions. Recent research has considered the subjective correlation for measures used to define the quality of monitoring conditions at low frequencies [1,2]. The work presented here falls in the same category, where the subjective relevance of the Modulation Transfer Function (MTF) is further assessed.
When listening for the purposes of recording quality control and codec developments, for example, it is known that metrics based solely on the magnitude of the frequency response may be deceptive when describing the performance of audio reproduction systems such as loudspeakers and monitoring rooms, or indeed the complex interaction between them at low frequencies [3,4]. Hence, the frequency response, alone, cannot be a reliable measure of quality.
Previous work by the authors has concentrated on the use of the MTF as an objective measure of the reproduction quality of audio systems at low frequencies [5,6]. The MTF incorporates both time and frequency domain information and it has been suggested that it can be a useful measure of the accuracy with which details in the low frequency sounds are perceived.
This paper further presents the concept of the modulation transfer function applied to the evaluation of room low frequency response and appraises its correlation to existing results on the subjective detection/perception of low frequency modal resonance.
2
THE MODULATION TRANSFER FUNCTION
The MTF measures the ability of a system to preserve depth of modulation from an input signal at specified frequency bands [7,8,9]. This can be obtained directly from the impulse response of the system if it is considered to be linear, time invariant and free from external noise.
The depth of modulation for each frequency is obtained from the following expression:
( )
( )
( )
∑
∑
−≈
Nf N
F Fn j f
n
h
e
n
h
F
m
s
0 2 0
2
2 π
Equation 1
Where F is the modulation frequency and hf(n) is the discrete impulse response of the system,
Proceedings of the Institute of Acoustics
The results are then averaged over all modulation frequencies and a figure is obtained for each of the frequency bands. The MTF response then describes the performance of the system over the frequency range under test (Figures 2, 4, 6). Results are bound between 0 and 1, with 1 corresponding to full modulation preservation. A single figure score may be obtained by further averaging all frequency bands.
The Green Function [10] has been used as a model to generate discrete room responses at sampling
frequency Fs (512Hz). This technique is known to perform well at low levels of damping and has been used successfully for similar work [1]. At high damping levels, such as that represented in the third case of Figure 5, the results from the model start to diverge from the exact conditions found in a specific room. Nonetheless, and as the model is used here to represent generic conditions found in a room rather than a specific room response, it is considered appropriate and is not deemed to affect the overall trend of results. The reader is referred to previous work for a description of the model and its implications [1].
To obtain the filtered bands ( hf(n) in Equation 1), each modelled room impulse response has been
filtered using a 50 point FIR digital filter. The length of these digital filters has a direct consequence on the MTF results, restricting the maximum score obtained for the MTF and, in extreme cases (500+ points), dominating the results such that what is being measured is the response of the filters themselves. Care has been taken to ensure that the results obtained relate to the corresponding room responses rather than the digital filtering effects.
The maximum value of the MTF has been calibrated using the response of a delta function.
3 INVESTIGATION
OF
MTF
SUBJECTIVE CORRELATION
The modulation transfer function has been the basis for speech intelligibility systems such as the Speech Transmission Index, and therefore closely associated with assessing the subjective performance in conveying audio information to listeners.
Rating scales have been previously defined for intelligibility scores (Table 1) and these are also applied here to quantify the subjective performance of room responses.
0 0.3 0.1 0.2 0.4 0.5 0.6 0.7 0.8 0.9 1.0
Bad Poor Fair Good Excellent
Table 1
Different room characteristics have been frequently regarded as relevant factors affecting the reproduction quality at low frequencies:
• Volume – affecting the modal density at the very low frequencies
• Aspect ratios – affecting the modal distribution
• Effective absorption – affecting low frequency damping
Furthermore, these factors have a clear effect on measurements of frequency and time responses in rooms. The relative changes produced on the scores of the MTF for each of these factors is now investigated.
The influence of source/receiver location is another important factor. However, although this has not been included in the investigation, it is nevertheless an important factor and a possible subject of further investigations.
Vol. 28. Pt.8. 2006
3.1 Effects of Room Volume
The room volume has a direct consequence on the location and density of resonant modes in the auditory frequency range. The dramatic consequence of this parameter is obvious for larger spaces (eg: auditoria), where the modal density at the lowest audible frequencies is large (many modes per frequency bandwidth), compared to smaller spaces (eg:a small control/listening room) where the modal density is markedly sparse. The common belief has been that the existence of a sparse modal density is subjectively detrimental as some frequencies are enhanced with respect to others. In contrast, larger spaces, where high modal density exists at the lowest audible frequencies, are often believed to be free of the effects of single isolated modes. Yet, at the extreme, no matter how ‘flat’ the overall frequency balance, a reverberation chamber cannot be considered to be a good listening room, despite its dense and even modal distribution. There appears to be a patently obvious conflict of requirements if a high modal density is required in order to achieve a flat room response but where the modal activity, itself, is sufficient to mask the direct signals when critical listening conditions are required.
The low frequency response for 3 rooms with different volumes is shown in Figure 1. The decay conditions of the rooms have been maintained constant for each of the responses modelled, and this has been set as 0.8 seconds at the 63Hz octave band, representing a condition typically found in rooms. The corresponding volumes for each room are noted in the figure legend.
0 50 100 150 200 250
-10 0 10 20 30 40
Room Modal Response
FREQUENCY (HZ)
dB
[image:4.595.74.520.355.609.2]V=30m3 V=100m3 V=145m3
Figure 1
20 40 60 80 100 120 140 160
0 0.2 0.4 0.6 0.8 1
Modulation Transfer Function in Room at Low Frequency
FREQUENCY (HZ)
MT
F
V=30m3 V=100m3 V=145m3
Figure 2
Room Volume (m3) MTF (avg. over all frequency bands)
30 0.44 100 0.39 145 0.36
Table 2
The effects of room volume are apparent in the very low frequencies, where the modal density and location of first modes are markedly different between cases (see Figure 1). The obtained MTF score for each of the room responses is shown in Figure 2 and the averaged score for each case are displayed in Table 2 for clearer contrast. The MTF score across the represented cases does not change significantly. It is interesting to note that the score decreases from smaller to larger rooms. The maximum MTF score obtained is 0.44, which according to Table 1 is rated between poor and
fair.
Proceedings of the Institute of Acoustics
reality is that only when driven from a 3 dimensional corner will all the modes be driven; and only when heard from an opposing 3 dimensional corner will all the driven modes be heard. Practical positioning of sources and listeners will always give rise to modal irregularity, which can manifest itself in many undesirable ways. Even in large, seemingly smooth rooms, if modal activity is under-damped there is a chance that a stimulus will excite one or a group of modes giving rise to audible problems. One of the authors has direct experience, as a musician, of isolated modes slightly off tune from the key in which the band were playing causing some notes to sound out of tune irrespective of the fact that the instrument(s) was/were in tune. Furthermore, some instruments have suffered resonant overhang on certain notes due to their positioning, and the same resonant overhangs have noticeably interfered with the tempo of the music. These are all perceptual problems associated with modal ‘Q’, and not simply with modal density.
3.2 Aspect
Ratio
A room’s aspect ratio dictates the frequency of the modal series (first, second, third, etc) and the potential for modal degeneracy (where modal frequencies between two or more modes lie very close).
Earlier research has focused on ‘expected’ and ‘optimal’ modal distributions [11]. Some researchers have further concentrated on criteria to prescribe room aspect ratios that will allegedly prevent audible modal problems and achieve ‘desired’ reproduction quality [12-15]. More recent work has looked into the subjective validity of this factor [1,2]. The general notion has been that room aspect ratio criteria, albeit useful in avoiding worst-case scenarios at the design stage, are somewhat peripheral to subjective room performance.
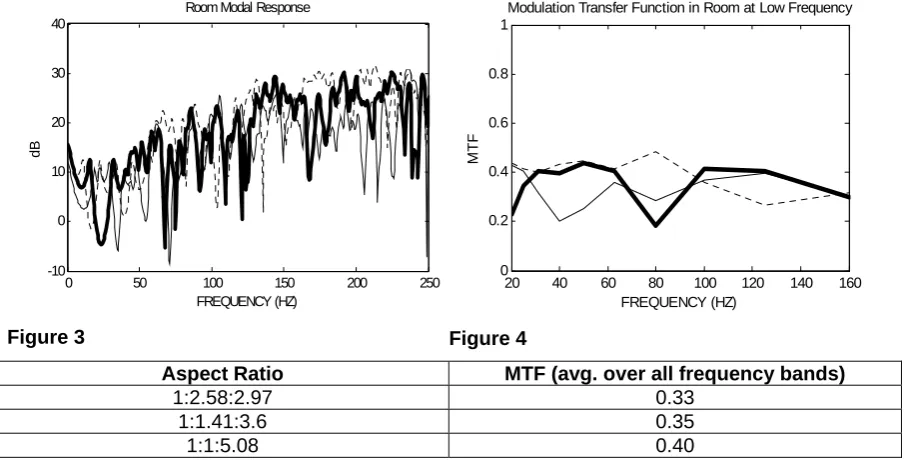
Figure 3 shows the modelled frequency response for 3 rooms with different aspect ratios, indicated in the legend of each figure. The low frequency decay of each of the modelled responses has been maintained at 0.8s, similarly to the room volume investigation in Section 3.1. Figure 4 shows the corresponding MTF responses. The average MTF results are shown in Table 3.
0 50 100 150 200 250
-10 0 10 20 30 40
Room Modal Response
FREQUENCY (HZ)
[image:5.595.73.526.471.701.2]dB
Figure 3
20 40 60 80 100 120 140 160
0 0.2 0.4 0.6 0.8 1
Modulation Transfer Function in Room at Low Frequency
FREQUENCY (HZ)
MT
F
Figure 4
Aspect Ratio MTF (avg. over all frequency bands)
1:2.58:2.97 0.33 1:1.41:3.6 0.35
1:1:5.08 0.40
The MTF scores obtained do not appear to be significantly different across the three cases. The maximum score achieved is 0.40, which rates poor in the MTF rating table (Table 1). Perhaps somewhat intriguing is the fact that the ratio which would supposedly be the worst choice for a monitoring room (a long, thin and narrow duct) is the one that scores best of the three ratios investigated. If the MTF responses are to be considered a useful indicator of room quality, this
Vol. 28. Pt.8. 2006
result presents further questions on the validity of room aspect ratios as a useful prescription tool for quality-monitoring room design.
3.3 Damping
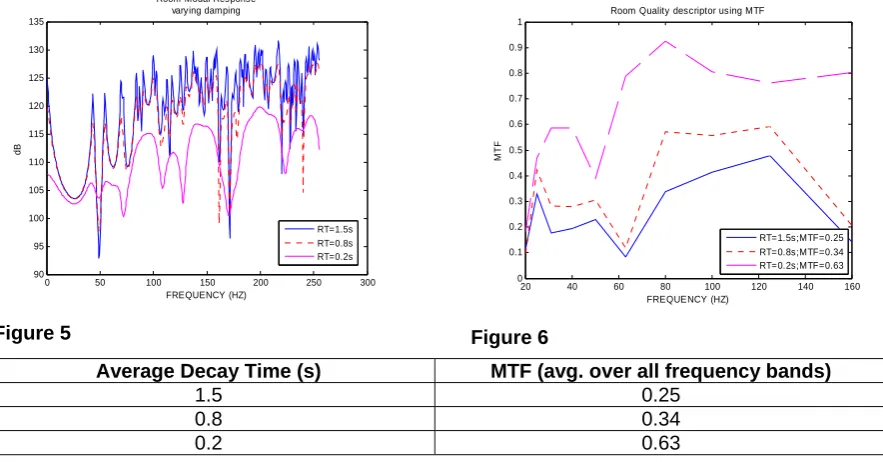
The amount of absorption in a room is related to the time taken for the energy to decay by a set amount. The effect of damping on the MTF score is now investigated. Three responses have been generated for a room with fixed volume and aspect ratio at three different levels of damping. The frequency responses for each case are shown in Figure 5. The corresponding low frequency decays at the 63Hz octave band are indicated in the legends. The MTF responses and scores for each room condition are shown in Figure 6 and Table 3.
0 50 100 150 200 250 300
90 95 100 105 110 115 120 125 130 135
Room Modal Response varying damping
FREQUENCY (HZ)
dB
[image:6.595.80.522.253.484.2]RT=1.5s RT=0.8s RT=0.2s
Figure 5
20 40 60 80 100 120 140 160
0 0.1 0.2 0.3 0.4 0.5 0.6 0.7 0.8 0.9 1
Room Quality descriptor using MTF
FREQUENCY (HZ)
MT
F
RT=1.5s;MTF=0.25 RT=0.8s;MTF=0.34 RT=0.2s;MTF=0.63
Figure 6
Average Decay Time (s) MTF (avg. over all frequency bands)
1.5 0.25 0.8 0.34 0.2 0.63
Table 3
It is clear that increased damping in the room has a notable effect on the MTF score. The maximum score is achieved for the room response corresponding to 0.2 s decay time. This score is rated as
good. The two other cases with decays of 0.8s and 1.5s rate poorly.
3.4 Contrast with other research
Previous research on the detection of modal activity in listening rooms has defined threshold levels that are now useful to further establish the subjective relevance of the MTF metric.
Fazenda et al.[16] have defined detection thresholds for the Q-factor of modes in the range 40Hz to 200Hz using music signals. The Q-factor of individual modes is associated with their decay time. The detection threshold has been defined at Q=16, with modes of lower ‘Q’ not being detected under the experimental conditions. The same model used in the work referred to above [16] was used to generate room responses at different modal Q-factor values and the MTF was computed. Results are displayed in Table 4.
Q factor of modes (40Hz-200Hz) MTF score Rating
19 0.6 fair/good
16 0.65 good
11 0.76 excellent
Proceedings of the Institute of Acoustics
The score obtained for Q=16 is 0.65, which is rated as good in Table 1. A response with Q=19 scores 0.6 which is categorized in the border between fair and good. A response with a Q=11 is necessary to obtain the MTF score of 0.76 which is considered excellent. The results presented here further suggest that Q-factors of 20 or above, typically found in many rooms, are less than satisfactory for high quality audio monitoring.
Goldberg [17] has defined detection thresholds using 20Hz-1KHz upward log sweeps, where a single artificial resonance of adjusted decay was present. Detection thresholds were measured in the range 32Hz to 200Hz and results show that a single resonance is detected for decay values above 0.2s even at the lowest frequency. This result may be compared with the third case in Figures 5 and 6 and Table 3 which indicates that a response with a decay of 0.2s achieves good in the MTF. This still implies that in order to be above Goldberg’s defined thresholds, a room must score good (0.6) or above.
Karjalainen et al. [18] have defined a threshold for detection of a single mode when presented in a sound-field containing other room resonances. The results suggest that any resonance in the range 100Hz-800Hz with decay time below 0.2s would not be detected, but below that range even decays as long as 2 seconds will not be detected. The threshold of 0.2 seconds appears to be in line with the MTF rating score and previous research. However, a threshold of 2 seconds at the very low frequencies appears to be excessive and possibly detrimental to monitoring conditions according to the MTF metric, since decays around the 0.8s mark are already rating poorly. Experience in the design of cinema dubbing theatres bears this out.
It is apparent that most recent research on the detection of modal problems has focused on the decay rates in the room (or modal ‘Q’). This trend appears to be in line with research results suggesting that decay time of resonances are an important cue for detecting modal problems and results presented here further support this idea.
4 CONCLUSION
The MTF has been shown to be a useful measure of the accuracy with which details in the low frequency sound are perceived.
The results presented further suggest that volume and aspect ratio of rooms appear to have a peripheral effect on the subjective performance of rooms used for audio monitoring, with variations of these factors not affecting significantly the MTF scores. Investigations presented here have shown that changing the room dimensions or sizes, despite having considerable effect on the modal distribution and range, do not significantly affect the MTF figure as long as the damping in the room remains typically low.
In contrast, a reduction of the decay time of room responses is mirrored by an increase in the MTF score suggesting that lower decays afford more precise monitoring conditions. This result is in accordance with previous work that shows how any resonant low frequencies can mask the details in other low frequency sounds, and hence can reduce the overall bass definition in the perception of a musical signal [9,19]. It is apparent that most recent research on the detection of modal problems has focused on the decay rates in the room (or modal ‘Q’). This trend perhaps suggests that decay time of resonances have an increased significance over other factors as a cue for detecting modal problems. Results presented here further support this idea.
At low frequencies, sufficient absorption is difficult to achieve using standard methods such as bulk porous absorbers, due to the long wavelengths and the large energy associated with room modes. A reduction of the energy decay time is commonly obtained from resonant absorbers which provide more efficient and ‘tuneable’ damping. Nonetheless, in most cases this still proves difficult. Building the inner shell of the room using lighter materials seems to be an efficient approach since these
Vol. 28. Pt.8. 2006
present more damping to the modes due to higher vibration. The isolation performance is then completed by the use of a heavy external shell. Considering the fact that such techniques exist, even for the construction of relatively large listening rooms, there seems to be no reason why larger rooms should automatically be expected to have longer decay times than their smaller counterparts. The concept of relatively large, low decay time rooms having relatively uniform overall decay times is not at all unreasonable if these are proven to be perceptually more accurate.
MTF plots of listening rooms describing their low frequency performance correlate well to the subjective perception of quality and detail at low frequencies. In order to attain high MTF scores, any excessive modal activity must be controlled and the MTF plot is therefore a useful indicator of which frequency range may be the most problematic in any given listening room. An added advantage of using the MTF to measure room performance is that, when applied to room measurements, the results will also include the performance of the loudspeakers used, so combined MTF scores can assess different loudspeaker/room combinations, including position-related effects.
Finally, the work presented here has attempted to correlate MTF scores and the rating used for intelligibility measures with previous research on detection thresholds for modal activity. Important future work would be to determine the precise MTF levels at which different rooms begin to become subjectively similar in terms of musical timbre and detail, and above which, if such a threshold exists, further improvement would be generally considered to be either unnecessary or not worth the cost or effort. The room-to-room compatibility of critical listening rooms could be much more clearly established than has previously been the case.
5 REFERENCES
1. Fazenda, B.M., Avis, M.R., Davies, W.J., ‘Perception of Modal Distribution Metrics in Critical Listening Spaces – Dependence on Room Aspect Ratios’, Journal of the Audio Engineering Society, Vol. 53, No.12, pp1128-1141, (December 2005)
2. Toole, F.E., ‘Loudspeakers and Rooms for Sound Reproduction – A Scientific Review’, Journal of the Audio Engineering Society, Vol. 54, No.6, pp451-476, (June 2006)
3. Watkinson, J., Salter, R., ‘Modelling and measuring the loudspeaker as an information channel’, presented at the ‘Reproduced Sound 15 conference’ of the Institute of Acoustics, Stratford-on-Avon, UK (November 1999)
4. Newell, P.R., Holland, K.R. Newell, J. P., “The Yamaha NS10M: twenty years a reference monitor. Why?”, Proceedings of the Institute of Acoustics, Reproduced Sound 17, Vol.23, Part 8, pp. 29-40, Stratford-U-Avon, UK, 2001
5. Fazenda, B.M., Holland, K.R., Newell, P.R., Castro, S.V., ‘the time domain performance of standard listening rooms: an assessment of current rooms and recommendations for achieving improved compatibility‘,Proceedings of the Institute of Acoustics, Reproduced Sound 21, Vol.27, Part 5, Oxford, UK, 2005
6. Holland, K.R., Newell, P.R., Castro, S.V., Fazenda, B., “Excess phase effects and modulation transfer function degradation in relation to loudspeakers and rooms intended for the quality control monitoring of music”, Proceedings of the Institute of Acoustics, Reproduced Sound 21, Vol.27, Part 8, Oxford, UK, 2005
7. Steeneken, H.J.M, Houtgast, T., ‘A physical method for measuring Speech Transmission Quality’, Journal of the Acoustical Society of America, Vol. 67, pp318-326, (1980)
8. EIC, Sound System Equipment – Part16: ‘Objective Rating of Speech Transmission Index’, IEC Standard No 602268-16, Second Edition (1998)
9. Holland, K. R., Newell, P.R., Mapp, P., “Modulation depth as a measure of loudspeaker low frequency performance”, Proceedings of the Institute of Acoustics, Reproduced Sound 20, Vol.26, Part 8, pp. 107-115, Oxford, UK, 2004
10. Morse, P.M., Vibration and Sound, 2nd edition, Acoustical Society of America, 1948
Proceedings of the Institute of Acoustics
12. Louden, M. M. “Dimension-Ratios of Rectangular Rooms with Good Distribution of Eigentones”, ACUSTICA, Vol. 24, 1971
13. Bonello, O. J. “A new criterion for the distribution of normal room modes”, J. Audio Eng. Soc.,Vol. 29, No. 9, 1979 November
14. Walker, R. “Low Frequency room responses – Part 2 – Calculation methods and experimental results”, BBC RD 1992/9
15. Cox, T.J., D'Antonio, P., Avis, M.R. “Room sizing and optimization at low frequencies” Journal of The Audio Engineering Society 52 (6): 640-651 JUN 2004
16. Fazenda, B.M., Avis, M.R, Davies, W.J. “Difference limen for the Q-factor of room modes”, Proceedings of of the 115th Audio Engineering Society Conference, preprint 5905 (2003) 17. Goldberg, A., “A listening test system for measuring the threshold of audibility of temporal
decays”, Proceedings of the Institute of Acoustics, Reproduced Sound 21, Vol.27, Part 5, Oxford, UK, 2005
18. Karjalainen, M., Antsalo, P., Makivirta, A., Valimaki, V., “Perception of temporal decays of low-frequency room modes”, Proceedings of the 116th Audio Engineering Society
Convention, Berlin, Germany, May 2004
19. Newell, P.R., Recording Studio Design, Focal Press, Oxford, UK (2003)
Vol. 28. Pt.8. 2006