International Journal of Emerging Technology and Advanced Engineering
Website: www.ijetae.com (ISSN 2250-2459, Volume 2, Issue 1, January 2012)
Abstract--Edges characterize boundaries and therefore a problem of fundamental importance in image processing. Edge detection significantly reduces the amount of data and filters out useless information, while preserving the important structural properties in an image. In this paper, we present wavelet based edge detection technique. Fourier Transform in edge detection applications has its own disadvantages. Wavelet transform plays a very important role in the image processing analysis, for its fine results when it is used in multi-resolution, multi-scale modeling. Unlike Discrete Cosine transforms or Fourier transforms, wavelet transform offers a natural decomposition of images at multiple resolutions. Wavelet analysis is a local analysis; it is especially suitable for time frequency analysis, which is essential for singularity detection, the fact motivated us to develop a technique using Haar wavelet to find an edge from an image. The proposed technique has been demonstrated for iris imagery.
Key words— Haar wavelet, Daubechies D4 wavelet, Iris imagery, Edge detection, Fourier Transform.
I. INTRODUCTION
The concept of wavelet analysis has been developed since the late 1980's. However, its idea can be traced back to the Littlewood-Paley technique and Calder'on-Zygmund theory [7] in harmonic analysis. Fourier analysis is also a good tool for frequency analysis, but it can only provide global frequency information, which is independent of time. Hence, with Fourier analysis, it is impossible to describe the local properties of functions in terms of their spectral properties, which can be viewed as an expression of the Heisenberg uncertainty principle [6]. In many applied areas like digital signal processing, time-frequency analysis is critical. That is, we want to know the frequency properties of a function in a local time interval. Engineers and mathematicians developed analytic methods that were adapted to these problems, therefore avoiding the inherent difficulties in classical Fourier analysis. For this purpose, Dennis Gabor [9] introduced a “sliding-window” technique.
He used a Gaussian function g as a “window” function, and then calculated the Fourier transform of a function in the “sliding window”. The Gabor transform is useful for time-frequency analysis. The Gabor transform was later generalized to the windowed Fourier transform in which g is replaced by a “time local “function called the “window” function. However, this analyzing function has the disadvantage that the spatial resolution is limited by the fixed size of the Gaussian envelope [4].The most preeminent books on wavelets are those of Meyer [10], [8] and Daubechies [13]. Meyer focuses on mathematical applications of wavelet theory in harmonic analysis. Daubechies gives a thorough presentation of techniques for constructing wavelet bases with desired properties; along with particular example of an orthonormal wavelet system was introduced by Alfred Haar [14]. However, the Haar wavelets are discontinuous and therefore poorly localized in frequency. St'ephane Mallat [12], [15] made a decisive step in the theory of wavelets in 1987 when he proposed a fast algorithm for the computation of wavelet coefficients. He proposed the pyramidal schemes that decompose signals into sub bands. These techniques can be traced back to the 1970s when they were developed to reduce quantization noise [3].The framework that unifies these algorithms and the theory of wavelets is the concept of a multi-resolution analysis (MRA). In 1997, Chui and Wang [5] further discussed the asymptotically optimal time frequency localization by scaling functions and wavelets. In their paper they proved the convergence of the time-frequency window sizes of cardinal polynomial B-wavelets, which are used in Mallat's algorithm and are important in many other wavelet applications. An edge in an image is a contour across which the brightness of the image changes abruptly. In image processing, an edge is often interpreted as one class of singularities. In a function, singularities can be characterized easily as discontinuities where the gradient approaches infinity.
However, image data is discrete, so edges in an image often are defined as the local maxima of the gradient. 1
Raju K.Dehankar,
2Seema C.Bhivgade,
3Athar Ravish Khan
1,2Electronics Engg.Dept,P.I.E.T., Nagpur, Maharashtra, India
3Electronics Engg.Dept,JDIET Yavatmal,Maharashtra, India 1
International Journal of Emerging Technology and Advanced Engineering
Website: www.ijetae.com (ISSN 2250-2459, Volume 2, Issue 1, January 2012)Edge is a main tool in pattern recognition, image segmentation, and scene analysis. An edge detector is basically a high pass filter that can be applied to extract the edge points in an image. This topic has attracted many researchers and many achievements have been made [11], [4], [19], [18], [20], [16], [17]. In this paper, we will explain the mechanism of edge detectors from the point of view of wavelets and develop a way to construct edge detector using wavelet transforms. The rest of the article is organized as follows: Section II and III briefly describe popular edge detector as well as some wavelet functions. In section IV describes the propose technique. Section V presents the experimental results conducted on several iris imagery. Finally, Section VI concludes the article.
II. POPULAR EDGE DETECTOR
Many classical edge detectors have been developed over time. They are based on the principle of matching local image segments with specific edge patterns. The edge detection is realized by the convolution with a set of directional derivative masks [2]. The popular edge detection operators are Roberts, Sobel, Prewitt, Frei-Chen, and Laplacian operators [18], [20], [2], [10]. They are all defined on a 3 by 3 pattern grid, so they are efficient and easy to apply. In certain situations where the edges are highly directional, some edge detector works especially well because their patterns fit the edges better.
III. WAVELET TRANSFORM
Wavelets are composed of two bases, a scaling and a wavelet basis. The scaling basis deals with how the wavelet represents a signal over a given frequency band. The wavelet basis shows how the wavelet sees the transients in a signal on a given frequency band.
A. The Haar wavelet transform
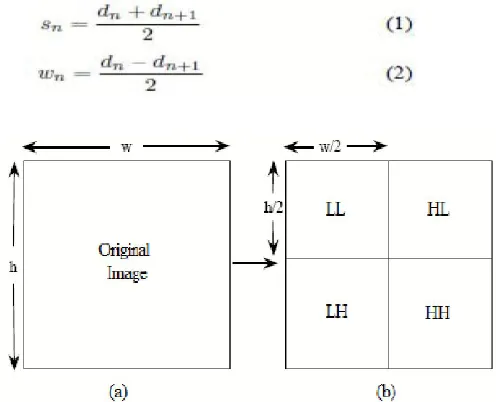
The Haar wavelet has the advantage of being simple to compute and easy to understand [14]. Each step in the Haar wavelet transform calculates a set of scaling coefficients and a set of wavelet coefficients. If data sets do, dl, dn-1contains n elements; there will be n/2 scaling coefficients and n/2 wavelet coefficient values. The scaling coefficients are stored in the lower half of the n element array and the wavelet coefficients are stored in the upper half. For two dimensional matrixes the wavelet transform has performed both horizontally and vertically. It creates four different sub bands named as LL, HL, LH and HH as shown in fig.1.the Harr wavelet to calculate scaling coefficients (Sn) and a
wavelet coefficient (wn) from an odd and even element in
the data set are shown below:
[image:2.612.327.575.135.336.2]
Figure 1. Wavelet multiresolution property of an image: (a) represents original image, (b) a one-level decomposition produces 4 sub-bands, namely LL, LH, HL and HH.
IV. PROPOSED WAVELET BASED EDGE DETECTION TECHNIQUE
The proposed technique has composed with four different blocks as shown in Fig. 2. Each of these blocks is described in detail in next.
Figure 2. Block Diagram of Propose Technique.
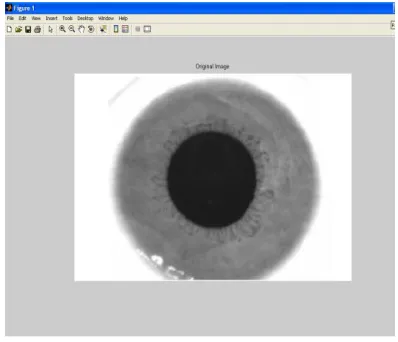
A. Input Image
The images are used in this paper in the form of grey colour model'. The size of the images is considered here are 512 x 512 pixels where each pixel contains different intensity values of grey from 0 to 255. The input image is processed and set to forward for the next block.
B. Wavelet Transform
[image:2.612.329.560.459.514.2]International Journal of Emerging Technology and Advanced Engineering
Website: www.ijetae.com (ISSN 2250-2459, Volume 2, Issue 1, January 2012)C. Edge Detector
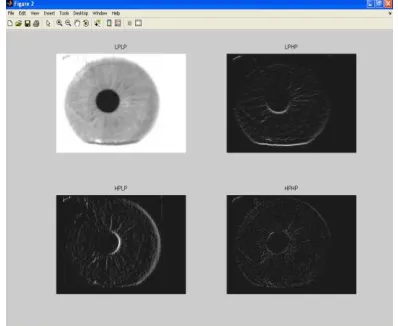
This is the main block where the detection of the edge from the image has to be performed. From a signal processing point of view, the wavelet transform is basically a convolution operation, which is equivalent to passing an image through low-pass and high-pass filters. Let the original image be I(w, h), then the LH sub-band represents the vertical edges, HL subband represents the horizontal edges and HH sub-band represents the diagonal edges of I(w, h). Using these properties of the LH, HH and HL sub-bands, we construct an edge image. If an element in the LH sub-band is Vm,n, an element in the HH sub-band is dm,n and
an element in the HL sub-band is hm,n, then the
corresponding element em,n in the edge image is given by
Eqn.
D. Output Image
The edge image of that given image has stored in the LL sub-band which is the desired output as we want get. It shown in Fig. 3.
V. EXPERIMENTAL RESULT USING MATLAB
The result is reported by Fig. 3. (a), (b), (c), (d), (e) and (f). The proposed technique has found the edges from the images which are very evident and clear by the visualization. The Haar wavelet transform produces better result as shown in Fig.3
2 January 2012 10
Figure 3. (a) Original image
2 January 2012 11
Figure 3. (b) Constructed edge image from the LH, HL and HH sub-bands using Haar wavelets.
Figure 3(c) Original image
[image:3.612.342.542.137.288.2] [image:3.612.345.543.343.504.2] [image:3.612.74.273.505.676.2]International Journal of Emerging Technology and Advanced Engineering
Website: www.ijetae.com (ISSN 2250-2459, Volume 2, Issue 1, January 2012)Figure 3. (e) Original image
Figure 3. (f) Constructed edge image from the LH, HL and HH sub-bands using Haar wavelets.
VI. CONCLUSION
In this article edge detection technique using Haar wavelet has been developed. The developed technique has performed over iris imagery and produces very promising result. Haar wavelet transform analysis is essential for singularity detection which results as an edge of the original image. Good performance of this technique for such imagery shows that it may be motivating to use this algorithm in other Imagery applications also. As a scope of further research this technique can also be extended for clustering, indexing and retrieval of image.
ACKNOWLEDGMENT
The authors would like to thank firstly, our GOD, and all friends who gave us any help related to this work. Finally, the most thank is to our families and to our country INDIA which born us.
References
[1] Avijit Sur,Nilanjan Patra,Santanu Chakraborty, Indrajit Saha“A new Wavelet based Edge detection Technique for Iris Imagery” 978-1-4244-1888-6/08/f$25.00 Q 2008 IEEE
[2] K. R. Castleman, Digital Image Processing, Englewood Cliffs, NJ: Prentice-Hall, 1996.
[3] D. Esteban and C. Galand, "Applications of quadrature mirror filters tosplit-band voice coding schemes," Int. Conf. Acoust. Speech SignalProcess., Hartford, CT, pp. 191-195, 1977.
[4] R. J. Beattie, Edge detection for semantically based early visualprocessing, dissertation, Univ. Edinburgh, Edinburgh, U.K., 1984.
[5] C. K. Chui and J. Z. Wang, "A study of asymptotically optimal timefrequency localization by scaling functions and wavelets," Annals of Numerical Mathematics, vol. 4, pp. 193-216, 1997.
[6] A. Cohen and R. D. Ryan, Wavelets and Multiscale Signal Processing, Chapman & Hall, 1995.
[7] A. Zygmund, Trigonometric Series, 2nd ed., Cambridge:Cambridge University Press, 1968.
[8] Y. Meyer, Ondelettes, fonctions splines et analyses gradu'ees, RapportCeremade, 1987.
[9] D. Gabor, "Theory of communication," JIEE (London), vol. 93, pp. 429-457, 1946.
[10] J. J. Benedetto and M.W. Frazier, Wavelets-Mathematics and Applications, CRC Press, 1994.
[11] M. Hueckel, "An operator which locates edges in digital pictures,"JACM, vol. 18,no. 1,pp. 113-125,1971.
[12] S. Mallat, "Multiresolution approximations and wavelet orthonormalbases of L2(R)," Trans. Amer. Math. Soc., vol. 315, pp. 69-87, 1989.
[13] I. Daubechies, Ten lectures on Wavelets, CBMS-NSF Series in Appl.Math., SIAM, Philadelphia.
[14] A. Haar, "Zur theorie der orthogonalen funktionen systeme," Math Ann.,vol. 69, pp. 331-371, 1910.
[image:4.612.69.269.138.305.2] [image:4.612.69.268.347.510.2]International Journal of Emerging Technology and Advanced Engineering
Website: www.ijetae.com (ISSN 2250-2459, Volume 2, Issue 1, January 2012)[16] Y. Y. Tang, L.H. Yang, and L. Feng, "Characterization and detection ofedges by lipschitz exponent and MASW wavelet transform," Proc. 14th Int. Conf. Pattern Recognit.,Brisbane, Australia, pp. 1572-1574, 1998.
[17] K. A. Stevens, "Surface perception from local analysis of texture And contour," Artificial Intell. Lab., Mass. Instr. Technol. Cambridge, Tech. Rep. AI-TR-512, pp. 1572-1574, 1980.
[18] L. Mero, "A simplified and fast version of the hueckel operator forinding optimal edges in pictures," Pric. IJCAI, pp. 650-655, 1975.
[19] B. K. P. Horn, The Binford-Horn line-finder, Artificial Intell. Lab.,Mass. Inst. Technol., Cambridge, Al Memo 285, 1971.
[20] R. Nevatia, "Evaluation of simplified hueckel edge-line detector" Comput., Graph., Image Process., vol. 6, no. 6, pp. 582-588, 1977.