Journal of Chemical and Pharmaceutical Research, 2014, 6(2):625-629
Research Article
CODEN(USA) : JCPRC5
ISSN : 0975-7384
Preparation of nano-ZnO by solid state method and photo-catalysis
degradation of acid bright yellow G
Mei Li, Hang Xu* and Tianlong Yu
School of Chemical Engineering and Pharmaceutics, Henan University of Science and
Technology, Luoyang, P.R. of China
_____________________________________________________________________________________________
ABSTRACT
Precursor (ZnC2O4) was synthesized by solid state reaction at room temperature using Na2C2O4 and ZnSO4·7H2O as raw materials. Nano-ZnO was obtained by decomposing ZnC2O4 at 450℃ for 5h. The ZnO was characterized by XRD、FT-IR、TG、SEM and TEM. The results show that ZnO crystalline has an average size distribution of 5nm and good activity at photocatalysis degradation of acid bright yellow G with the best dosage of 0.3 g/L.
Key words: nano-ZnO, solid state method, photo-catalysis
_____________________________________________________________________________________________
INTRODUCTION
Nano-ZnO has wide applications in the pressure-sensitive materials, piezoelectric materials, image recording materials, ultraviolet shielding materials and catalysts[1-3]. The synthesis methods of nano ZnO are high energy ball milling method, physical vapor deposition, chemical vapor deposition method, hydrothermal synthesis, sol-gel method and micro-emulsion [4]. These processes are complex, high cost, high solvent consumption and poor environmental protection.
Solid state reaction at room temperature is a simple operation process suitable for large scale production, which has the advantages of low energy consumption, no need of solvent, high yield and low cost [5,6]. Using zinc acetate and oxalic acid as raw materials, the nano-ZnO powder was obtained by the solid state reaction of zinc oxalate synthesis at room temperature in microwave radiation condition [7]. The spherical and cubic nano-ZnO was obtained by decomposition of precursor zinc oxalate, which was synthesized by direct precipitation reaction using zinc chloride and ammonium oxalate as raw material [8].
In this paper, the nano-ZnO prepared by solid state method using Na2C2O4 and ZnSO4·7H2O as raw materials was
applied into photocatalytic degradation of acid bright yellow G.
EXPERIMENTAL SECTION
2.1 Nano-ZnO preparation
Na2C2O4 and ZnSO4·7H2O (1:1) were respectively grinded for 5min and then mixed well. After the mixture was
grinded for 10min, the precursor (ZnC2O4) was obtained. Being calcined in the muffle furnace at 450℃ for 5h, ZnC2O4 was completely decomposed into ZnO. The calcined ZnO was first washed with deionized water to remove
2.2 Characterization
Transmission electron microscope (TEM) and scanning electron microscope (SEM) were carried out using JEM-2010 and JSM-7401F (JEOL, Japan). The FT-IR and thermo-gravimetric analysis (TGA) were performed by NEXUS-670 FT-IR spectrometer (Thermo-Nicolet, America) and TGA-2050 thermo-gravimetric analyzer (TA INSTUMENTS, America). The crystal phases of ZnO nano-particles were analyzed by X-ray diffraction (XRD) on PaNalytical X-ray diffract-meter (X’Pert Pro MPD, Dutch) . The concentration of acid bright yellow G in treated wastewater samples was analyzed by a UV-2102PC UV-Vis spectrophotometer (UNICO, China).
2.3 photocatalytic experiment
Photocatalytic reaction system consists of slurry photocatalytic reactor, air compressor and UV lamp tube. Its core was a slurry photocatalytic reactor, referring to the literature [9]. Water samples were collected regular in the reaction process and separated by centrifugation to take supernatant. Acid bright yellow G was analyzed by UV visible spectrophotometer. The maximum absorptive length was 365nm.
RESULTS AND DISCUSSION
3.1 Thermo-gravimetric analysis of ZnC2O4 precursor
0 200 400 600 800
40 60 80 100
Temperature(0C)
W
e
lg
h
t(
%
)
TG DTG 132oC
402oC
-1 0 1 2
D
e
rlv
.W
e
lg
h
t(%
/ 0
C
[image:2.595.202.411.292.459.2])
Fig 1 TG curves of ZnC2O4 powder
Fig. 1 presented the TGA and DTG thermo-diagrams for the ZnC2O4 precursor. There were two strong weight loss
processes below 450℃. The first weight loss process began at 100℃ and ended at 170℃. The thermo-gravimetric differential curve (DTG) showed an exothermic peak at approximately 132℃. In this process, the weight losses of the precursor are 18.5%. Two crystal water of ZnC2O4 powder is 19% of the total weight. This shows that the first
process is due to the removal of two crystal water. The thermo-gravimetric curve expresses the second weight loss process from 340℃ to 430℃. A weight loss peak at 402℃ is observed in the DTG curve and the weight losses of this process are 38.5%. By removing CO and CO2, the weight loss from ZnC2O4 to ZnO is 38%. Thus, the weight
loss in the second process is owed to the decomposition of ZnC2O4 to ZnO. From the thermo-gravimetric curve, it
can be seen that The calcined temperature for ZnO preparation is above 430℃. The optimal calcination temperature for preparing ZnO powder is about 450 8C in this work.
3.2 FT-IR analysis
Fig. 2 shows FT-IR analysis of ZnC2O4 powders and zinc oxide powders. From the curve of ZnC2O4, 3400 cm-1 is
the stretching vibration of H—O in crystal water. 1650 cm-1 is superposed by the stretching vibration of C=O and bending vibration of H—O—H. 1360 cm-1 and 1320 cm-1 are stretching vibration of C—O. 498 cm-1 is the feature peak of Zn—O. The pure ZnC2O4 crystal can be demonstrated by FT-IR. From the FT-IR curve of ZnO, 494 cm-1 is
4000 3200 2400 1600 800 0 20 40 60 80 100 T ra n s m it ta n c e (% )
Wavenumber(cm-1)
3400 1670 1360 1320 823 494 (a) (b) 496
Fig.2 IR spectrum of ZnC2O4 and ZnO
3.3 XRD Analysis
The XRD analyses of precursor and ZnO powder are shown in Fig. 3 and Fig. 4. The result is confirmed by Fig. 3 that the precursor is pure dehydrate ZnC2O4 without other impurity corresponding to 140740 in the JCPDS card. It is
consistent with the thermo-gravimetric and FT-IR analysis. The result of Fig. 4 shows that the synthesized ZnO is pure crystal having hexagonal system corresponding to 50664 in the JCPDS card. The zinc oxide powder material after the preparation should be stored in a desiccator because ZnO absorbs water easily to bring impurities in the XRD analysis [11].
20 40 60 80
0 10000 20000 30000 40000 50000 60000 18.70657 22.58359 30.13708 35.08361 40.4980743.3724 C P S
2theta /o
Fig.3 XRD spectrum of ZnC2O4 powder
3.4 Electron microscope analysis
[image:4.595.124.488.140.310.2]The micro morphological structure of the nano-ZnO particles was also observed with TEM and SEM, as shown in Fig. 5. The TEM images clearly exhibits the spherical microstructure of the prepared particles with a size of around 5nm. This is consistent with the XRD results. Conglomeration phenomena are detected in the TEM images. From the SEM images, it can be found that the ZnO nano-crystals were micro porous material.
Fig.5 TEM and SEM of ZnO
3.5 Photocatalytic activity of the nano-ZnO particles
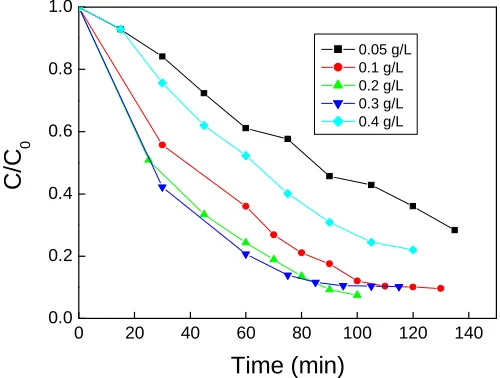
A series of experiments were carried out with varying the loading of ZnO concentrations from 0.05 to 0.4 g/L in order to determine the effect of ZnO catalyst amounts. The result is depicted at different ZnO concentrations in Fig.7. From the Fig.7, the reaction rate was fast at the beginning of the experiment, and then decreased gradually. The degradation efficiency of 0.3g/L catalyst dosage was the highest before 80min. After that, the catalyst degradation efficiency of 0.2g/L, 0.3g/L dosage crossed each other and remained basically the same. All degradation efficiencies were around 90% at 100min. When the dosage was less than 0.3g/L, the degradation efficiency increased with the amount of catalyst. The reason is that degradation rate increases by increased •OH with the dosage [12]. When the dosage of catalyst was more than 0.3g/L, the degradation rate decreased. The reason is that the amount of light passing through the solution is reduced with the rising dosages. Following the drop in light energy for ZnO absorption, the production of •OH and O2 decreases accordingly. It results in the decreased degradation rate.
Therefore, the optimal amount of catalyst is 0.3g/L in this work.
0 20 40 60 80 100 120 140
0.0 0.2 0.4 0.6 0.8 1.0
C
/C
0
Time (min)
0.05 g/L 0.1 g/L 0.2 g/L 0.3 g/L 0.4 g/L
Fig.6 The effect of TiO2 dosage
CONCLUSION
In this paper, the precursor ZnC2O4 was prepared by solid state reaction at room temperature, and then the nano-ZnO
[image:4.595.182.432.493.682.2]micro-porous with an average size of about 5nm. The nano-ZnO exhibited higher activity on photo-catalytic degradation of acid bright yellow G dye with the optimal dosage of 0.3g/L.
Acknowledgments
This work is supported by the National Nature Science Foundations of China (No: 21006057 and 21076063), China Postdoctoral Science Foundation (No: 20100470351).
REFERENCES
[1] HA Wahab; AA Salama, Results Phy., 2013, 3: 46-51. [2] JM Hong; Y He, Desalination, 2014, 332: 67-75.
[3] TJ Zhou ; YY Hu; RY Chen, Appl. Surf. Sci., 2012, 258: 4023-4027. [4] R Tayebee; F Javadi; G Argi, J. Mol. Catal., 2013, 368:16-23. [5] LM Huang; HQ Fan, Sen. Actuat., 2012, 171: 1257-1263. [6] M Pudukudy; Z Yaakob, Appl. Surf. Sci., 2014, 292: 520-530.
[7] R Velmurugan; K Selvam; B Krishnakumar, Sep. Pur. Tech., 2011, 80:119-124. [8] H Xu; M Li; J Zhang, Mat. Res. Bul., 2013, 48: 3144–3148.
[9] HQ Wang; CH Li; HG Zhao, Adv. Pow. Tech., 2013, 24: 599-604.