International Journal of Emerging Technology and Advanced Engineering
Website: www.ijetae.com (ISSN 2250-2459, ISO 9001:2008 Certified Journal, Volume 5, Issue 12, December 2015)
227
Parametric Optimization of WEDM Process on OHNS Tool
Steel Using Statistical Techniques
Goutam Kumar Bose
1, Pritam Pain
21,2Department of Mechanical Engineering, Haldia Institute of Technology, India
Abstract—Now a day the developments in the material
science lead to the development of advanced engineering materials such as super alloys, composites and ceramics. These materials are very hard and very difficult to machining, and it also often poses impediments in smooth machining with traditional machining processes such as turning, milling, drilling and grinding. Non-traditional Machining techniques are being successfully utilized to machine of these advanced materials. Wire electrical discharge machining (WEDM) is one of the important non-traditional machining processes, which is used for machining of difficult-to-machine materials and intricate profiles. WEDM is a complex machining process controlled by a large number of process parameters such as Pulse on Time (Ton), Pulse off Time (Toff), Wire Tension (W/Ten), Wire Feed Rate (W/Feed) etc. for various cutting operations. In this experimental investigation several responses such as material removal rate, surface roughness and overcut have been considered. Experimentation is planned as per Taguchi’s L27 Orthogonal array (OA). Copper Wire with 0.25mm Diameter and Oil Hardened Naturally Shrinking (OHNS) are used as tool and work materials respectively. The machining parameters are optimized with the multi response characteristics applying response surface methodology.
Keywords— ANOVA, L27 OA, Material removal rate,
OHNS, Overcut, RSM, Surface Roughness, WEDM.
I. INTRODUCTION
Wire electric discharge machining (WEDM) is an electro-discharge erosion process where material is removed from the work piece by a series of divergent sparks. The conductive work piece and the wire electrode (tool) are alienated by a watery film of dielectric fluid which is continuously supplied to the machining zone to swill out the eroded particles and heat. The spark occurs more than one hundred thousand times per second and heat of each electrical spark, estimated at around 15,000° to 21,000° Fahrenheit which melt the work piece. The movement of wire is computer numerically controlled to achieve the desired two or three-dimensional shape of the work piece. In manufacturing aspect, WEDM contribute a prime share in the manufacture of complicated profile dies, molds, and critical parts used in aerospace, nuclear, automobile, and other industrial applications.
The process is best suited for parts having complex work piece configuration, close tolerances, low machinability, the need of high repeatability and high temperature strength materials. However, the selection of optimum machining parameters in WEDM is a very important thing. Improper selected parameters may result serious problems like short circuiting of wire, work surface damage and wire breakage causing disruption of production process and reducing productivity. Oil Hardened Naturally Shrinking (OHNS) die steel is an ideal type oil-hardened steel which is economical and it can be relied for hardness and good cutting performance. It is used in blanking, thread cutting tools, punches, stamping dies, rotary shear blades, milling cutters, reamers, broaches, measuring tools, gauging tools, wood working tools, chasers etc.
International Journal of Emerging Technology and Advanced Engineering
Website: www.ijetae.com (ISSN 2250-2459, ISO 9001:2008 Certified Journal, Volume 5, Issue 12, December 2015)
228
The optimum control parameter for greater surface roughness is determined by using analysis of variance (ANOVA). Patil et.al (2013) [5] studied the optimization of MRR and Surface Roughness on the Wire-EDM machining process of AISI D2 cold work steel material using Response surface methodology (RSM), ANOVA where most important affecting parameters selected to performance measures and identified their effects variation. Nayak et.al (2013) [6] presented the optimization of material removal rate, roughness value of the worked surface, and kerf on the wire electrical discharge machining process, the process parameter like pulse duration, discharge current, pulse frequency, wire tension, wire speed and dielectric flow rate are used to enhanced, the Taguchi L27 orthogonal array is used to study the machining process. Routara et.al (2009) [7] studied the optimization of the material removal rate and surface roughness for wire electrical discharge machining (WEDM) operations using Taguchi’s method, the process parameter such as gap current (I), gap voltage (V), wire feed rate (W) and duty factor (D) was varying for machining. Shah et.al (2013) [8] studied the optimized of the control parameters during machining of Inconel-600 by WEDM using response surface methodology (RSM). The four input process parameters of WEDM like Peak Current (IP), Pulse-On time (Ton), Pulse-Off time (Toff) and Wire Feed rate (WF) were chosen as variables to optimize the process performance of Material Removal Rate (MRR). Liao et. al (2014) [9] studied on specific discharge energy (SDE) on WEDM process for higher and lover SDE materials and use neural network and genetic algorithm to optimize the process. Ghodsiyeh et.al(2012) [10] experimentally studied the behavior of WEDM process selection of three important control parameters such as Pulse ON Time, Pulse OFF Time and Peak Current on machining performance, to optimize Material Removal Rate (MRR) and Surface Roughness (SR) of titanium alloy (Ti6Al4V) using Analysis of Variance (ANOVA) and also the established as a second-order mathematical model based on the Response Surface Methodology (RSM) which subset of the process variable has the greatest impact on the process performance. Sepueroe et.al [11] Studied the optimization of WEDM process to reduce the surface roughness and increase the material removal rate the process carried out by using the steel SKD-11material and brass electrodes and significant varying the process parameters such as: on time, open voltage, servo voltage, off time and flushing pressure using the Taguchi method to obtain optimal response characteristics based on the S/N ratio of each response.
International Journal of Emerging Technology and Advanced Engineering
Website: www.ijetae.com (ISSN 2250-2459, ISO 9001:2008 Certified Journal, Volume 5, Issue 12, December 2015)
229
Patil et.al (2014) [20] studied the optimization of material removal rate on the WEDM process on AISI D2 cold work steel. The machining parameters such as wire tension, pulse on time and peak current are varied during machining using Response Surface Methodology. The effect of the parameters on MRR is determined by analysis of variance (ANOVA). Chaturvedi et.al (2013) [21] studied the optimization of machining condition for MRR and surface roughness, during WEDM of oil harden naturally shrinking (OHNS) steel. Here 0.25 mm diameter of brass wire is used as a tool and distilled water is taken as a dielectric fluid. The input parameters selected such as wire tension, wire feed rate, flushing pressure, servo feed rate are initially optimized using Taguchi methodology, next MOORA method is used for best parametric combination during machining process. Chandra and Tiwana (2015) [22] optimize the cutting parameters for MRR and surface roughness during wire electric discharge machining of Titanium alloy.
The objective of the present research work is to study the characteristic features of the WEDM process while machining Oil Hardened Naturally Shrinking (OHNS) Die Steel as reflected through Taguchi design based experimental studies with various process parametric combinations like Pulse on Time (Ton), Pulse off Time (Toff), Wire Tension (W/Ten) & Wire Feed (W/Feed) on Material Removal Rate (MRR), Surface Roughness (Ra) & Overcut (OC). The significant process parameters are identified using Analysis of Variance (ANOVA). These experimental data are further investigated using Response Surface Methodology (RSM). The present paper is intended at accomplishment of essential but contradictory objectives in tandem during WEDM i.e. higher material removal rate (MRR), lower surface roughness (Ra) and minimum Overcut (OC) by employing a single set of optimal or near optimal process variables applying RSM. Response surfaces and contour plots are studied to investigate the prominence of the control parameters and their levels in order to optimize the responses. Finally, multi-response optimization is carried out using overlaid contour plots and desirability functions.
II. PLANNING FOR EXPERIMENTATION
In the present research work, the DM-Water (specific gravity= 1at 23˚C, pH 7 and Viscosity of 1cP @ 20˚C) is used as dielectric fluid. With external lateral flushing using a Cu wire tool (0.25 mm Dia) having a pressure 0.8kgf/cm2 is used. Experiments are conducted with positive polarity of electrode.
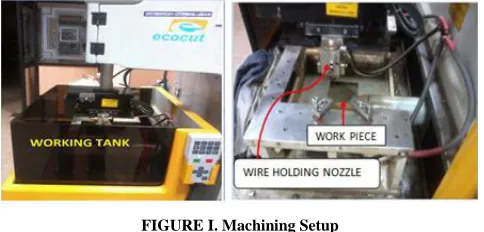
[image:3.612.324.566.209.325.2]The pulsed discharge current is applied at various steps in positive mode. The WEDM setup consists of dielectric reservoir, pump, flow system, power supply unit, control panel, working tank, X-Y table accommodating the working table, wire holding nozzle, work piece, flashing system as shown in Figure I.
FIGURE I. Machining Setup
The servo control unit is provided to maintain the fixed gap. It perceives the gap voltage and compares it with the present value. The difference in voltage is then utilized to manipulate the movement of servo motor to regulate the gap. The work material made of Oil Hardened Naturally Shrinking (OHNS) Die Steel is selected having dimension of 80x80x16 mm. The chemical composition of OHNS is C: 0.95, Mn: 1.15, Cr: 0.5, W:0.5, V:0.2. During the process, the wire diameter (0.25mm) was kept constant. Therefore, the MRR for WEDM operation is calculated using Equation 1, which is shown below:
MRR = S0 x L x T (mm3/min) (1)
Where, S0 = machining speed (mm/min),
L = (2G + φ) (mm) G = wire gap (mm)
φ = diameter of electrode wire (mm) T = thickness of the job (mm)
Surface roughness of the cavity surface is expressed as Ra expressed in μmm, is measured using stylus type profilometer. Overcut (OC) is expressed as the difference between width of cut produced by the wire and diameter of the wire which is measured by the digital venire scale.
International Journal of Emerging Technology and Advanced Engineering
Website: www.ijetae.com (ISSN 2250-2459, ISO 9001:2008 Certified Journal, Volume 5, Issue 12, December 2015)
230
Some of the other factors which may influence the objective of the experimentation like Duty cycle, Flushing pressure, Lift time etc., however, are kept unchanged
during experimentation. Table I exhibits the different levels of control parameters during machining process.
TABLEI
PARAMETRIC SETTINGS AND RESPONSES FOR EXPERIMENTAL RUN
Control Parameters Responses
Expt. No. Ton
(μSec)
Toff (μSec)
W/Feed (m/min)
W/Ten (gms)
MRR (mm³/Sec)
Overcut (mm)
Ra (μmm)
1 15 25 6 10 10.716 0.35645 2.805
2 20 30 6 10 15.486 0.3556 3.273
3 20 30 12 10 13.362 0.2806 3.195
4 15 20 9 10 10.184 0.3198 2.679
5 15 25 9 8 9.334 0.33061 2.697
6 25 20 9 10 20.784 0.3198 3.441
7 20 25 9 10 14.954 0.31895 3.147
8 20 25 6 8 15.696 0.36811 3.117
9 25 25 9 8 19.934 0.33061 3.459
10 15 25 9 12 9.974 0.30729 2.835
11 20 25 12 8 13.572 0.29311 3.039
12 20 20 6 10 16.546 0.3573 3.099
13 20 20 9 8 15.164 0.33146 2.991
14 25 25 9 12 20.574 0.30729 3.597
15 20 30 9 12 14.744 0.30644 3.303
16 25 25 12 10 19.192 0.28145 3.489
17 25 30 9 10 19.724 0.3181 3.615
18 20 25 9 10 14.954 0.31895 3.147
19 25 25 6 10 21.316 0.35645 3.567
20 15 30 9 10 9.124 0.3181 2.853
21 15 25 12 10 8.592 0.28145 2.727
22 20 20 9 12 15.804 0.30814 3.129
23 20 25 9 10 14.954 0.31895 3.147
24 20 30 9 8 14.104 0.32976 3.165
25 20 20 12 10 14.422 0.2823 3.021
26 20 25 6 12 16.336 0.34479 3.255
International Journal of Emerging Technology and Advanced Engineering
Website: www.ijetae.com (ISSN 2250-2459, ISO 9001:2008 Certified Journal, Volume 5, Issue 12, December 2015)
231
III. RESULTS ANALYSIS USING ANOVA
ANOVA is needed for estimating the error variance for the factor effects and variance of the prediction error. First, the total summation of squared deviations SST from the total mean S/N ratio nm can be calculated.
2
1
(
)
n
i m
i
SST
n
n
(2)Where, n is the number of experimental run in the orthogonal array and ηi is the mean signal-to-noise ratio for
the ith experiment. The percentage contribution P can be calculated as:
SSd P
SST
(3)
Where, SSd is the sum of the squared deviations. The experimental results are investigated to analyse the role of different control variables on various responses by using S/N ratio and ANOVA. The investigation of the results is performed by applying statistical software MINITAB, version 13.
S/N ratio measures the variation of different process. The objective is to find out an optimal combination of control factor settings that achieve robustness against noise factors.
S/N ratio analysis for MRR (mm³/min) is carried out on the basis of larger is the better and the related S/N ratio is expressed as follows:
2
1 10 1
1
10 log n 1
i
n MRR
n
(4)S/N ratio analysis for Ra is modelled on the basis of smaller is the better and consequent equation is
2
2 10 1
1
10 log
nin
Ra
n
(5)S/N ratio analysis for OC is modelled on the basis of smaller is the better and corresponding equation is
2
2 10 1
1
10 log
ni
n
OC
n
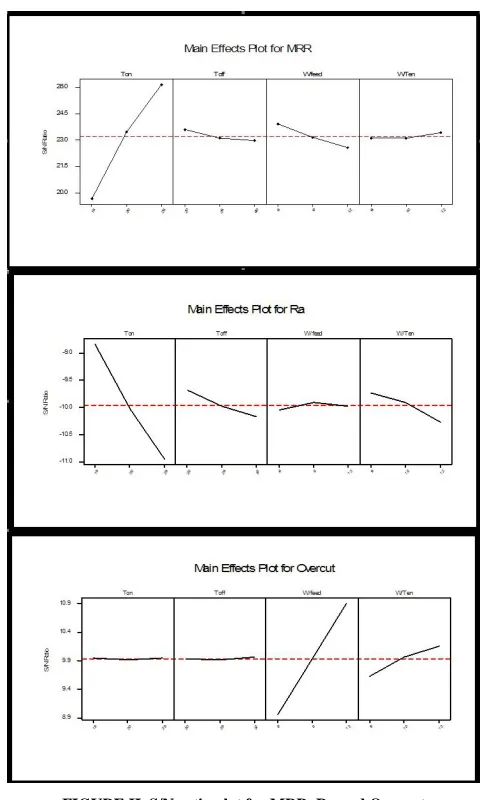
(6) [image:5.612.322.563.128.528.2]The S/N plot for MRR, Ra and Overcut are shown in figure II.
FIGURE II. S/N ratio plot for MRR, Ra and Overcut
It is observed from the S/N ratio graph that the MRR attains its peak with the parametric combination of Ton (25 µSec), Toff (20 µsec), W/Feed (6 m/min), W/Ten (8gms). For smaller is better for Ra is obtained at Ton (15 µSec), Toff (20 µsec), W/Feed (9 m/min), W/Ten (8 gms). Similarly, for smaller is better for OC is obtained at Ton (25 µSec), Toff (30 µsec), W/Feed (12m/min), W/Ten (12 gms).
IV. RESULTS ANALYSIS USING RESPONSE SURFACE
METHODOLOGY (RSM)
International Journal of Emerging Technology and Advanced Engineering
Website: www.ijetae.com (ISSN 2250-2459, ISO 9001:2008 Certified Journal, Volume 5, Issue 12, December 2015)
232
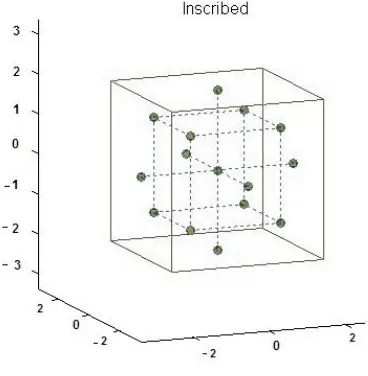
[image:6.612.75.259.228.416.2]The principal idea of RSM is to apply a sequence of designed experiments to obtain responses. The independent variables are controlled by the experimenter, in a designed experiment, while the process response is an observed output during experimentation. Figure III illustrates the inscribed type response surface design which has 5 level of factors and over all accuracy is good.
FIGURE III. Inscribed type response surface design
The response surface (output) can be related with the number of controllable variables X1,X2……Xk
As
y
f X X
(
1,
2X
k)
(7)A second order mathematical model is developed to form an input-output relationship efficiently that takes the generic form:
2 0
1 1 1
k k k
i i ii i ij i j
i i i
y
x
x
x x
(8)The calculated response for the model is
2 0
1 1 1
ˆ
ˆ
ˆ
ˆ
ˆ
k i i k ii i k ij ii i i
y
x
x
x x
(9)
In the current research work, Box-Behenken Design is employed which is based on 2k (k = 4) factorials with incomplete designs and found to be very efficient. The process variables combinations and the corresponding responses are presented in Table 1.
A. Analysis of test results for Material Removal Rate (MRR)
The regression equation for MRR is
MRR= - 1.53 + 1.06Ton – 0.106Toff – 0.375W/Feed + 0.128W/Ten (10)
The details of the regression analysis result are presented in Table II. R-square as well as R-square (adjusted) assumes a value of 99.9% and 99.9% respectively, that implies the model is poised to explain 99.9% variability with process variable Ton, Toff, W/Feed and W/Ten. From the T values of the process variables, it can be concluded that Ton is the most significant process variables followed by Toff, W/Feed and W/Ten.
TABLEII
ESTIMATED REGRESSION COEFFICIENTS FOR MRR
Term Coef SE Coef T P
Constant 14.954 0.08198 182.414 0.000 Ton 5.3 0.04099 129.303 0.000 Toff -0.53 0.04099 -12.930 0.000 W/Feed -1.125 0.04099 -27.459 0.000 W/Ten 0.257 0.04099 6.258 0.000 Ton*Ton 0.032 0.06148 0.516 0.615 Toff*Toff 0.032 0.06148 0.516 0.615
W/Feed*
W/Feed -0.064 0.06148 -1.033 0.322 W/Ten*W/Ten -0.064 0.06148 -1.033 0.322 Ton*Toff 0.000 0.07100 0.000 1.000 Ton*W/Feed 0.000 0.07100 0.000 1.000
Ton* W/Ten 0.000 0.07100 0.000 1.000 Toff*W/Feed 0.000 0.07100 0.000 1.000
Toff*W/Ten 0.000 0.07100 0.000 1.000 W/Feed*W/Ten -0.190 0.07100 -2.683 0.020 S= 0.1420 R-Sq = 99.9% R-Sq(adj) = 99.9%
[image:6.612.52.287.527.626.2]International Journal of Emerging Technology and Advanced Engineering
Website: www.ijetae.com (ISSN 2250-2459, ISO 9001:2008 Certified Journal, Volume 5, Issue 12, December 2015)
[image:7.612.53.565.108.323.2]233
FIGURE IV. Wire frame surface plot for MRR B. Analysis of test results for Surface Roughness (Ra)
The estimated regression surface equation for Ra is:
Ra = 0.740 + 0.0762Ton + 0.0174Toff - 0.00331W/Feed + 0.0490W/Ten (11)
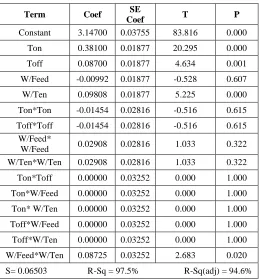
The particulars of the regression analysis outcome are presented in Table III. R-square as well as R-square (adjusted) furnishes a value of 97.5% and 94.6% respectively that implies the model is balanced to explain 97% variability with process variable Ton, Toff, W/Feed and W/Ten. From the T values of the process variables, it can be concluded that Ton is the most significant process variables followed by Toff, W/Feed and W/Ten.
TABLEIII
ESTIMATED REGRESSION COEFFICIENTS FOR RA
Term Coef SE
Coef T P
Constant 3.14700 0.03755 83.816 0.000
Ton 0.38100 0.01877 20.295 0.000
Toff 0.08700 0.01877 4.634 0.001
W/Feed -0.00992 0.01877 -0.528 0.607
W/Ten 0.09808 0.01877 5.225 0.000
Ton*Ton -0.01454 0.02816 -0.516 0.615
Toff*Toff -0.01454 0.02816 -0.516 0.615 W/Feed*
W/Feed 0.02908 0.02816 1.033 0.322 W/Ten*W/Ten 0.02908 0.02816 1.033 0.322
Ton*Toff 0.00000 0.03252 0.000 1.000
Ton*W/Feed 0.00000 0.03252 0.000 1.000
Ton* W/Ten 0.00000 0.03252 0.000 1.000
Toff*W/Feed 0.00000 0.03252 0.000 1.000
Toff*W/Ten 0.00000 0.03252 0.000 1.000
W/Feed*W/Ten 0.08725 0.03252 2.683 0.020
[image:7.612.315.574.366.646.2]International Journal of Emerging Technology and Advanced Engineering
Website: www.ijetae.com (ISSN 2250-2459, ISO 9001:2008 Certified Journal, Volume 5, Issue 12, December 2015)
234
The response surface plots of Ra with respect to Ton, Toff, W/Feed and W/Ten are shown in figure V. It is seen that high levels of the two variables out of four capitulate utmost responses.
[image:8.612.88.541.202.365.2]The Ton & Toff have the considerable effect on Ra. Since the response is proportional to the variables, there cannot have any stationary point as evident from the surface plots. Further, the effect of Ton is more pronounced than other three parameters.
FIGURE V. Wire frame surface plot for Ra C. Analysis of test results for Overcut (OC)
The estimated regression surface equation for Overcut (OC) is:
OC = 0.480 – 0.0000Ton – 0.00017Toff – 0.0119 W/Feed – 0.00493W/Ten (12)
The particulars of the regression analysis are presented in Table IV. R-square furnishes a value of 98.8% that implies the model is balanced to explain 97% variability with process variable Ton, Toff, W/Feed and W/Ten. From the T values of the process variables, it can be concluded that POF is the most significant process variables followed by GI, SG and POT.
TABLEIV
ESTIMATED REGRESSION COEFFICIENTS FOR OC
Term Coef SE Coef T P
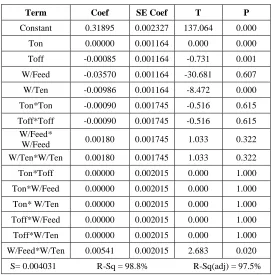
Constant 0.31895 0.002327 137.064 0.000
Ton 0.00000 0.001164 0.000 0.000
Toff -0.00085 0.001164 -0.731 0.001
W/Feed -0.03570 0.001164 -30.681 0.607
W/Ten -0.00986 0.001164 -8.472 0.000
Ton*Ton -0.00090 0.001745 -0.516 0.615
Toff*Toff -0.00090 0.001745 -0.516 0.615 W/Feed*
W/Feed 0.00180 0.001745 1.033 0.322 W/Ten*W/Ten 0.00180 0.001745 1.033 0.322
Ton*Toff 0.00000 0.002015 0.000 1.000
Ton*W/Feed 0.00000 0.002015 0.000 1.000
Ton* W/Ten 0.00000 0.002015 0.000 1.000
Toff*W/Feed 0.00000 0.002015 0.000 1.000
Toff*W/Ten 0.00000 0.002015 0.000 1.000
W/Feed*W/Ten 0.00541 0.002015 2.683 0.020
[image:8.612.308.579.408.683.2]International Journal of Emerging Technology and Advanced Engineering
Website: www.ijetae.com (ISSN 2250-2459, ISO 9001:2008 Certified Journal, Volume 5, Issue 12, December 2015)
235
The response surface plots of OC with respect to Ton, Toff, W/Feed and W/Ten are shown in figure VI. It is seen that high levels of the two variables out of four capitulate utmost responses.
Since the response is proportional to the variables, there cannot have any stationary point as evident from the surface plots. It is observed that the two variables out of four yield maximum responses. It clears that the POF & GI are the significant parameter for O/C.
Overcut 20 25 T off 20 0.28 0.29 0.30 0.31 0.32 0.33 Overcut 0.33 0.34 0.35 0.36 7 6 30 7 12 11 10 9W/feed 8
Surface Plot of Overcut
Hold values: Ton: 20.0 W/Ten: 10.0
15 0.280 0.281 20 Overcut T on 0.282 20 25 30 25T off Surface Plot of Overcut
Hold values: W/feed: 12.0 W/Ten: 12.0
Overcut 15 20 T on 15 0.28 0.29 0.30 0.31 0.32 0.33 Overcut 0.33 0.34 0.35 0.36 7 6 25 7 12 11 10 9 W/feed 8
Surface Plot of Overcut
Hold values: Toff: 25.0 W/Ten: 10.0
Overcut 15 20 T on 15 0.31 0.32 Overcut 0.33 8 25 9 12 11 10W/T en
9
Surface Plot of Overcut
Hold values: Toff: 25.0 W/feed: 9.0
Overcut 20 25 T off 20 0.31 0.32 Overcut 0.33 8 30 9 12 11 10W/T en
9
Surface Plot of Overcut
Hold values: Ton: 20.0 W/feed: 9.0
Overcut
6 7 8 9 10 11
W/feed 6 0.28 0.29 0.30 7 0.31 0.32 0.33 0.34 Overcut 8 0.34 0.35 0.36 0.37 0.38 11 8 12 9 12 11 10W/T en
9
Surface Plot of Overcut
[image:9.612.79.533.193.360.2]Hold values: Ton: 20.0 Toff: 25.0 FIGURE VI. Wire frame surface plot for OC
V. MULTI RESPONSE OPTIMIZATION
A.Overlaid contour plots
High MRR and low Ra and Overcut are the three major attributes of WEDM machining process. These three responses are conflicting in nature and hence achieving them simultaneously by a set of optimum variables combination is difficult. In this section the multi response optimization is conceded out so that three conflicting goals are fulfilled concurrently. We resort to overlay contour plots which are comparatively simple approach to review the levels of operating parameters that satisfy three constrained objectives.
It is considered that Ra in the range of 2.679μm to 3.615μm found to be reasonably good and acceptable for most of the applications. MRR has been set between a lower bound of 8.592 mm³/min and upper bound of 21.316 mm³/min. And OC has been set at a range of 0.2806mm to 0.36811mm.
Thus constrained equation become:
8.592 < MRR < 21.316 (13)
2.679 < Ra < 3.615 (14)
0.2806 < OC < 0.36811 (15)
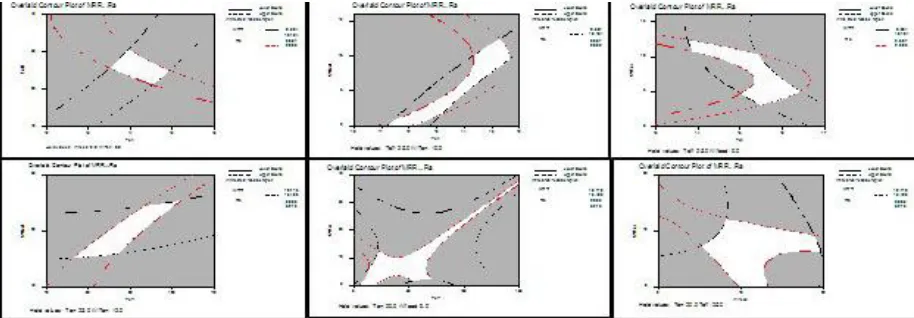
The overlaid contour plots of MRR and Ra is shown in Figure VII.
[image:9.612.63.520.543.702.2]International Journal of Emerging Technology and Advanced Engineering
Website: www.ijetae.com (ISSN 2250-2459, ISO 9001:2008 Certified Journal, Volume 5, Issue 12, December 2015)
236
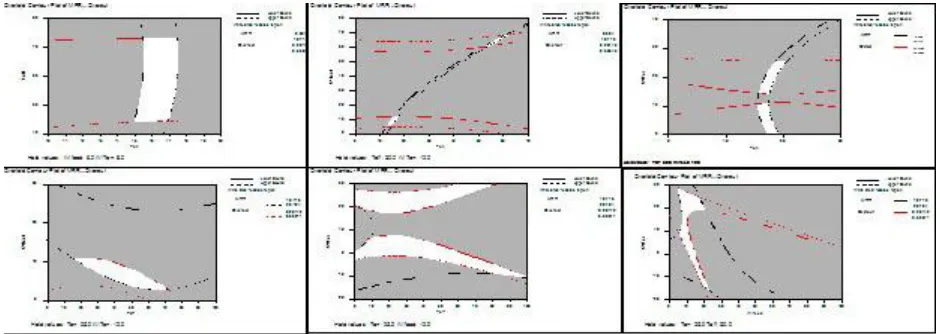
[image:10.612.71.541.167.334.2]The overlaid contour plots of MRR and Overcut is shown in Figure VIII.
FIGURE VII. Overlaid Contour plot for MRR and Overcut
The Overlaid Contour Plot of MRR, Ra and Overcut w.r.t Ton, Toff, W/Feed & W/Ten are portrayed. The bounded white areas as indicated in the figure are the region that simultaneously satisfies global objectives along with possible combinations of process variables. The plots advocate that combination of moderate Ton & Toff help achieve the targets. The white area in the figure highlights for optimum MRR, Ra and Overcut and corresponding value of Ton and Toff can be predicted from the curve with the hold value of W/Feed and W/Ten.
B.Desirability functions
Response Optimizer helps to help recognize the factor settings that optimize a single response or a set of responses. For multiple responses, the necessities for all the responses in the set must be fulfilled.
The general approach is to first convert each response into an individual desirability function that varies over the range (0 to 1). Here the goal, lower, target, upper, and weight characterize the desirability function for each individual response. The importance (Import) parameters decide how the desirability functions are combined into a single composite desirability. The response optimization is shown in Table V bellow.
Starting Point: Ton= 15.00, Toff= 20.00, W/Feed= 6.00, W/Ten= 8.00.
From the S/N ratio Plot of Taguchi Design we get highest MRR at combination of Ton (25), Toff (20), W/Feed (6), W/Ten (12) & Lowest OC at combination of Ton (25), Toff (30), W/Feed (12), W/Ten (12) and Ra at combination of Ton (15), Toff (20), W/Feed (9), W/Ten (8). Hence an optimized combination of Ton (15), Toff (20), W/Feed (6), W/Ten (8) can be taken as starting point.
TABLEV
DESIRABILITY FUNCTION RESULTS
Parameters Goal Lower Target Upper Weight Import MRR Maximum 8.5920 15 21.316 1 1
OC Minimum 0.3198 0.33 0.3681 1 1 Ra Minimum 2.679 2.9 3.615 1 1
Predicted Responses
MRR = 14.1464, desirability = 0.86679 (86.679%) OC = 0.33, desirability = 1.00000 (100%)
Ra = 2.9, desirability = 1.00000 (100%)
Composite Desirability = 0.95346 (95.346%)
Global Solution
[image:10.612.158.457.587.725.2]International Journal of Emerging Technology and Advanced Engineering
Website: www.ijetae.com (ISSN 2250-2459, ISO 9001:2008 Certified Journal, Volume 5, Issue 12, December 2015)
237
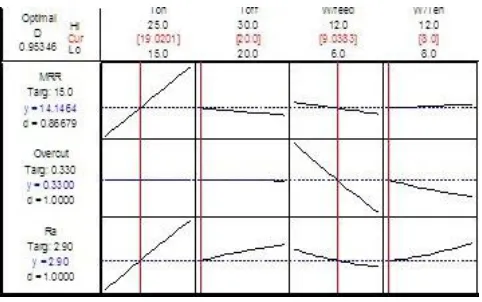
[image:11.612.49.290.182.333.2]Figure IX represents the optimization plot of the responses (MRR, OC and Ra) with the process variables. It shows how the factors affect the predicted responses and allows to modify the factor settings interactively.
FIGURE IX. Plot showing responses (MRR, OC and Ra) v/s process variables
The figure shows the objective for the response, the predicted response, y, at the current factor settings, and the individual desirability score. The composite desirability, D, is shown in the upper left corner of the graph. The label above the composite desirability refers to the current setting. When the optimization plot is created, the label is Optimal. The vertical red lines on the graph signify the current factor settings. The horizontal blue lines represent the current response values. From the earlier limit of MRR & Ra and assigning unbiased weight to the dual responses, the desirability of MRR becomes 0.86679 having predicted response of 14.1464 mm³/Min. The same for OC is dOC
=1.00000 with predicted response of 0.33mm. The same for Ra is dRa = 1.0000 with the predicted response of 2.9
micron. Finally, the dual desirability is 0.95345 having Ton= 19.0201, Toff=20.0000, W/Feed=9.0383, W/Ten=8 is the near optimal combination.
VI. DISCUSSION AND CONCLUSIONS
The experimental study indicates that while machining OHNS Die steel using WEDM process the responses are dependent on Pulse on time, Pulse off time, wire feed and wire tension. The S/N ratio analysis along with ANOVA is a simple method to ascertain implication of several input parameters that administers multiple responses of the process. The experimental based result showed that increasing the pulse on time, wire feed and wire tension values leads to an increase in the amount of Material Removal Rate.
But the most influential factors are pulse on time which contribution 50.59%, also the MRR increase gradually with the increasing Pulse on time. Ra showed that increasing the pulse on time, wire tension, wire feed values leads to a decreasing the amount of Ra. But the most influential factor is pulse on time which contributed 4.89%, also the Ra increase gradually with the increasing Wire feed, and Overcut showed that increasing the wire feed, wire tension, Toff values leads to a decreasing the amount of Overcut. But the most influential factors are wire feed which contribute 3.05%.
The present work is carried out with a view to optimize MRR (maximize), Ra (minimize) Overcut (minimize) concurrently by employing a near optimal set of process variables. This optimization is carried out by RSM that is promised to tender near optimal solution with modest effort. The regression models are established to be creditable to express input-output relationship with a very high degree of predictability. The inferences drawn from the regression analysis is accentuated with the desirability functions. Gap current is found to be the most significant in comparison to the responses. The near optimal combinations of process variables are high POT, POF and low Wire Tension, Wire Feed to satisfy both the responses (MRR, Ra and Overcut) simultaneously. The overlaid contour plot is a good visual aid to identify the feasible region in regard to a set of input variables.
Therefore, this experimental analysis for considering the optimum WEDM parametric combination during machining of OHNS materials can act as important and an operative guideline for manufacturing of products of similar material.
REFERENCES
[1] Chaudhary, A., Maan, V., Chittoriya, B. S. and Gahlot, P. 2013.
―Optimization of MRR of D-2 Steel in WEDM Process‖, Journal of Information, Knowledge and Research in Mechanical Engineering.
[2] Golshan, A., Gohari, S. and Ayob, A. 2011. ―Computational
Intelligence in Optimization of Wire Electrical Discharge Machining of Cold-Work Steel 2601‖, International Journal of Mechanical & Mechatronics Engineering.
[3] Patel, A. M., Achwal, V. 2013. ―Optimization of Parameters for
Wedm Machine for Productivity Improvement‖, IOSR Journal of Mechanical and Civil Engineering (IOSR-JMCE).
[4] Kurian, A. M., Dr. Yeldose, B. C. and Mathew, E. M. 2014. ―Effect
of Wire EDM Parameters on Surface Roughness of Stainless Steel 15-5 PH‖, International Journal of Engineering and Innovative Technology.
[5] Patela, A. J. and Patel, S. P. 2013. ―Parametric Optimization of Wire
International Journal of Emerging Technology and Advanced Engineering
Website: www.ijetae.com (ISSN 2250-2459, ISO 9001:2008 Certified Journal, Volume 5, Issue 12, December 2015)
238
[6] Nayak, B. B. and Mahapatra, S. S. 2013. ―Using The AHP and
TOPSIS Method Multi-Response Optimization of WEDM Process Parameters‖, International Journal on Theoretical and Applied Research in Mechanical Engineering.
[7] Routara, B. C., Nanda, B. K. and Patra, D. R.2009. ―Parametric
Optimization of CNC WIRE-Cut EDM Using Grey Relation Analysis‖, Proceedings of the International Conference on Mechanical Engineering.
[8] Shah, C. D., Mevada, J. R. and Khatri, B. C. 2013. ―Optimization of
Process Parameter of Wire Electrical Discharge Machining by Response Surface Methodology On Inconel-600‖, International Journal of Emerging Technology and Advanced Engineering.
[9] Liao, Y. S., Chuang, T. J. and Yu. Y. P. 2014. ―Study of machining
parameters optimization for different materials in WEDM‖, The International Journal of Advanced Manufacturing Technology.
[10] Ghodsiyeh, D., Lahiji, M. A., Ghanbari, M., Shirdar, M. R. and
Golshan, A. 2012. ―Optimizing Material Removal Rate (MRR) in WEDMing Titanium Alloy (Ti6Al4V) Using the Taguchi Method‖, Research Journal of Applied Sciences, Engineering and Technology.
[11] Sepueroe, F. ―Optimization Material Removal Rate (Mrr) And
Surface Roughness of the Wire-Electric Discharge Machining Process Material Skd-11 With Fuzzy Logic and Taguchi Method‖ 3-4.
[12] Gadakh, V. S. 2012. ―Parametric Optimization of WIRE Electrical
Discharge Machining Using TOPSIS Method‖ Journal of Advances in Production Engineering & Management.
[13] Rajyalakshmi1, G. and Dr. Ramaiah, P. V. 2012. ―Simulation,
Modeling and Optimization of Process parameters of Wire EDM using Taguchi –Grey Relational Analysis‖, International Journal Of Advanced And Innovative Research (Ijair). ISSN: 22787844, 125 -137.
[14] Selvakumar, G., Sornalatha, G., Sarkar, S., and Mitra, S. 2014.
―Experimental investigation and multi-objective optimization of wire electrical discharge machining (WEDM) of 5083 aluminum alloy using Taguchi Method‖. The Transactions of Nonferrous Metals Society of China.
[15] Singh, H. and Garg, R. 2009. ―A study on material removal rate in
wire electrical discharge machining.‖, of Achievements in Materials and Manufacturing Engineering.
[16] Pal, J. Nishant, Lohan, A. 2014. ―Parameters Optimization of wire
Edm for Cutting Speed Using Taguchi Technique‖, International Journal of Technical Research (IJTR).
[17] Huang, J. T. and Liao, Y. S. 2003. ―Optimization of machining
parameters of Wire-EDM based on Grey relational and statistical analyses‖, International Journal of Production Research.
[18] Huan, J. T., and Liao, Y. S. ―Application of Grey Relational
Analysis to Machining Parameters Determination of Wire Electrical Discharge Machining‖ 1-15.
[19] Shrama, M. 2014. ―Optimization of Materiel Removal Rate for
WEDM on Al/Al2O3/SiC Metal Matrix Composite Using Response Surface Methodology‖, International Journal of Innovations in Engineering and Technology.
[20] Patil, P. A., and Waghmare, C. A. 2014. ―Optimization of process
parameters in Wire-EDM using response surface methodology‖, Proceedings of 10th IRF International Conference, 110-115.
[21] Chaturvedi, V. and Sharma, A. K. 2013 ―Parametric Optimization of
CNC Wire Cut EDM for OHNS Steel Using Moora Methodology‖, 10th IRF International Conference.
[22] Chander, S. and Tiwana, J. S. 2015. ―Optimization of Material