Blunted feedback suppression of SREBP
processing by dietary cholesterol in transgenic
mice expressing sterol-resistant SCAP(D443N).
B S Korn, … , J L Goldstein, M S Brown
J Clin Invest.
1998;
102(12)
:2050-2060.
https://doi.org/10.1172/JCI5341
.
Feedback regulation of cholesterol biosynthesis is mediated by membrane-bound
transcription factors designated sterol regulatory elementbinding proteins (SREBP)1 and
-2. In sterol-deprived cultured cells, SREBPs are released from membranes by a proteolytic
process that is stimulated by SREBP cleavage-activating protein (SCAP), a membrane
protein containing a sterol-sensing domain. Sterols suppress SREBP cleavage by blocking
the action of SCAP, thereby decreasing cholesterol synthesis. A point mutation in
SCAP(D443N) causes resistance to sterol suppression. In this article, we produced
transgenic mice that express mutant SCAP(D443N) in liver. In these livers the nuclear
content of SREBP-1 and -2 was increased, mRNAs encoding proteins involved in uptake
and synthesis of cholesterol and fatty acids were elevated, and the livers were engorged
with cholesteryl esters and triglycerides enriched in monounsaturated fatty acids. When the
mice were challenged with a high cholesterol diet, cleavage of SREBP-1 and -2 was
reduced in wild-type livers and less so in transgenic livers. We conclude that SCAP(D443N)
stimulates proteolytic processing of native SREBPs in liver and decreases the normal
sterol-mediated feedback regulation of SREBP cleavage, suggesting a central role for
SCAP as a sterol sensor in liver.
Research Article
Find the latest version:
J. Clin. Invest.
© The American Society for Clinical Investigation, Inc. 0021-9738/98/12/2050/11 $2.00
Volume 102, Number 12, December 1998, 2050–2060 http://www.jci.org
Blunted Feedback Suppression of SREBP Processing by Dietary Cholesterol in
Transgenic Mice Expressing Sterol-Resistant SCAP(D443N)
Bobby S. Korn,* Iichiro Shimomura,* Yuriy Bashmakov,* Robert E. Hammer,ठJay D. Horton,* Joseph L. Goldstein,*
and Michael S. Brown*
*Department of Molecular Genetics, ‡Department of Biochemistry, and §Howard Hughes Medical Institute, University of Texas
Southwestern Medical Center, Dallas, Texas 75235
Abstract
Feedback regulation of cholesterol biosynthesis is mediated by membrane-bound transcription factors designated sterol regulatory element–binding proteins (SREBP)-1 and -2. In sterol-deprived cultured cells, SREBPs are released from membranes by a proteolytic process that is stimulated by SREBP cleavage–activating protein (SCAP), a membrane protein containing a sterol-sensing domain. Sterols sup-press SREBP cleavage by blocking the action of SCAP, thereby decreasing cholesterol synthesis. A point mutation in SCAP(D443N) causes resistance to sterol suppression. In this article, we produced transgenic mice that express mu-tant SCAP(D443N) in liver. In these livers the nuclear con-tent of SREBP-1 and -2 was increased, mRNAs encoding proteins involved in uptake and synthesis of cholesterol and fatty acids were elevated, and the livers were engorged with cholesteryl esters and triglycerides enriched in monounsat-urated fatty acids. When the mice were challenged with a high cholesterol diet, cleavage of SREBP-1 and -2 was re-duced in wild-type livers and less so in transgenic livers. We conclude that SCAP(D443N) stimulates proteolytic process-ing of native SREBPs in liver and decreases the normal ste-rol-mediated feedback regulation of SREBP cleavage, sug-gesting a central role for SCAP as a sterol sensor in liver. (J. Clin. Invest. 1998. 102:2050–2060.) Key words: cholesterol •
fatty acids • sterol regulatory element-binding proteins •
SCAP • transgenic mice
Introduction
Feedback regulation of cholesterol synthesis ensures that cells have adequate amounts of cholesterol for membranes and other cellular functions while preventing overproduction. Such regulation was first observed over 45 years ago when dogs were fed a high cholesterol diet, and cholesterol synthesis was found to be suppressed in liver (1). This was the first example of end-product feedback repression of a biosynthetic pathway
in animals and is attributable in large part to sterol-mediated suppression of genes encoding multiple enzymes in the choles-terol biosynthetic pathway. This regulation is mediated by transcription factors called sterol regulatory element–binding proteins (SREBPs;1 reference 2).
SREBPs are produced as membrane-bound precursors of
z 1,150 amino acids that contain three domains. The NH2
-terminal domain of z 480 amino acids is a transcription factor belonging to the basic helix-loop-helix leucine zipper (bHLH-Zip) family. The second domain of z 80 amino acids com-prises two membrane-spanning regions separated by a short hydrophilic loop of 31 amino acids. This is followed by a COOH-terminal regulatory domain of z 590 amino acids. The SREBPs are oriented in a hairpin fashion such that the NH2
-and COOH-terminal domains project into the cytosol, -and the hydrophilic loop faces the lumen of the endoplasmic reticu-lum (2).
The mechanism for the regulation of SREBP activity was elucidated through studies in cultured cells (2). When cells are deprived of sterols, SREBPs are activated by a two-step teolytic cascade. Processing begins when a protease (site 1 pro-tease) clips SREBPs in the hydrophilic luminal loop, allowing the NH2- and COOH-terminal segments to separate (3). Once
the two segments are separated, a second protease (site 2 pro-tease) cuts the NH2-terminal segment at site 2 within the first
transmembrane segment, allowing the NH2-terminal domain
to leave the membrane (4). The cleaved NH2-terminal domain,
known as nuclear SREBP (nSREBP), binds to the promoters and activates the transcription of genes encoding enzymes of cholesterol biosynthesis (3-hydroxy-3-methylglutaryl CoA [HMG CoA] reductase, HMG CoA synthase, farnesyl diphos-phate synthase, squalene synthase, and others) and the low density lipoprotein (LDL) receptor (2, 5–8). nSREBPs also ac-tivate the transcription of genes encoding enzymes of fatty acid synthesis, including acetyl CoA carboxylase, fatty acid syn-thase, and stearoyl CoA desaturase (SCD), and at least one gene involved in phospholipid and triglyceride synthesis, glyc-erol-3-phosphate acyltransferase (9–14). Feedback regulation of cholesterol synthesis occurs at the level of SREBP proteoly-sis (15). When sterols accumulate in cells, cleavage of SREBPs at site 1 is abolished, SREBPs remain membrane bound, and transcription of all target genes declines (2).
Address correspondence to Joseph L. Goldstein and Michael S. Brown, Department of Molecular Genetics, University of Texas Southwestern Medical Center, 5323 Harry Hines Blvd., Rm. L5.238, Dallas, TX 75235-9046. Phone: 214-648-2141; FAX: 214-648-8804; E-mail: [email protected], [email protected]
Received for publication 25 September 1998 and accepted in
re-vised form 22 October 1998. 1. phate dehydrogenase; GLC, gas–liquid chromatography; GPAT,Abbreviations used in this paper: GAPDH,
In cultured cells, sterols regulate the cleavage of SREBPs by controlling the activity of a polytopic membrane protein designated SREBP cleavage–activating protein (SCAP; refer-ence 16). SCAP is an intrinsic membrane protein with two do-mains. The NH2-terminal 730 amino acids contain alternating
hydrophobic and hydrophilic sequences that are believed to span the membrane eight times (17). The COOH-terminal 546 amino acids contain five iterations of a motif known as the WD-40 repeat. WD repeats, found in many different proteins, mediate protein–protein interactions (18). The WD repeats of SCAP form a complex with the COOH-terminal regulatory domain of SREBPs (19). This complex is essential for site 1 cleavage. Sterols inhibit the action of SCAP, thereby inhibiting SREBP cleavage (16, 19).
Sequence analysis of membrane-spanning segments 2–6 of SCAP reveals homology to three other proteins thought to in-teract with sterols: HMG CoA reductase, the Niemann-Pick C1 gene product, and the morphogen Patched (20). In HMG CoA reductase, the membrane attachment domain is responsi-ble for rapid degradation of the protein when cells accumulate sterols (21, 22). A deletion of membrane spanning segments 2-6 in HMG CoA reductase abolishes sterol-stimulated degra-dation (21). The resemblance of the putative sterol-sensing domain of SCAP to HMG CoA reductase suggests that this domain of SCAP may serve as a sterol sensor that regulates cleavage of SREBPs (16).
SCAP was identified by expression cloning from 25-RA cells, a mutant line of Chinese hamster ovary (CHO) cells (23) that fail to suppress cleavage of SREBPs in the presence of ste-rols (16). The mutant SCAP produced in 25-RA cells contains an asparagine substituted for aspartic acid at residue 443, which lies within the sterol-sensing domain of SCAP. The D443N mutation is dominant and enhances the ability of SCAP to stimulate cleavage of SREBPs in cultured cells. Moreover, cells expressing SCAP(D443N) show a reduced ability to repress the cleavage of SREBPs in the presence of sterols, suggesting that the sterol-sensing domain of SCAP me-diates feedback repression of SREBP processing (16). The mRNA for SCAP is expressed in the liver and other tissues, but it is not known whether SCAP regulates SREBP process-ing in these organs. The availability of a dominant, superactive mutant of SCAP provides a tool to address this question in mice.
In this study, we have introduced the dominant, superac-tive D443N mutation of SCAP into the livers of mice. The cleavage of endogenous SREBP-1 and SREBP-2 was in-creased in the transgenic livers, resulting in inin-creased amounts of nSREBP-1 and -2. The mRNAs for SREBP target genes in the cholesterol and fatty acid biosynthetic pathways were markedly elevated. This resulted in mice with enlarged livers that were engorged with cholesterol and triglycerides. Despite the elevation of hepatic cholesterol, the transgenic mice con-tinued to cleave SREBPs and transcribe the genes of lipid syn-thesis. The animals were also partially resistant to the suppres-sion effects of a high cholesterol diet. These results indicate that SCAP plays a central role in the regulation of SREBP processing in mouse liver.
Methods
Materials and general methods. We obtained restriction and DNA modifying enzymes from New England Biolabs, Inc. (Beverly, MA);
a cDNA probe for mouse glyceraldehyde-3-phosphate dehydroge-nase (GAPDH) from Ambion, Inc. (Austin, TX); AmpliTaq Gold DNA polymerase from Perkin-Elmer Corp. (Branchburg, NJ); and
Redivue [a-32P]dCTP (3,000 Ci/mmol), [a-32P]CTP (800 Ci/mmol),
and [a-32P]UTP (800 Ci/mmol) from Amersham Corp. (Arlington
Heights, IL). DNA sequencing was performed on a DNA sequencer (model 377A; Applied Biosystems, Foster City, CA) using the dide-oxy chain termination method. The hepatic and plasma content of choles-terol and triglycerides was measured as previously described (24, 25).
Plasmid constructions. An expression plasmid encoding a mutant version of hamster SCAP containing an aspartic acid to asparagine substitution at codon 443 (D443N) under the control of the rat phos-phoenolpyruvate carboxykinase (PEPCK) promoter was constructed in a trimolecular ligation reaction. The 2.4-kb BglII fragment of the rat PEPCK promoter (which contains sequence elements responsible for tissue-specific and dietary regulation; reference 26) was ligated into BglII/SpeI-digested pTK-HSV-SCAP(D443N) (which encodes herpes simplex virus (HSV) epitope-tagged hamster SCAP(D443N) (16) and BglII/XbaI-digested pRI2-intronA (which contains the rat
insulin II intron A known to enhance expression of transgenes in mice; reference 27). The structure of the resulting plasmid, desig-nated pPEPCK-HSV-SCAP(D443N), was confirmed by restriction analysis and DNA sequencing of all ligation joints.
Transgenic mice. Techniques used for generating transgenic mice were previously described (28). The AatII-AvrII fragment of pPEPCK-HSV-SCAP(D443N) was purified on a SeaKem GTG aga-rose gel (FMC Bioproducts, Rockland, ME) and isolated by perchlo-rate elution (29). A total of 373 fertilized eggs that were microinjected with the DNA fragment survived to the two-cell stage and were trans-ferred to pseudopregnant recipients. Among the 71 offspring, 21 had integrated the transgene as determined by dot blot hybridization of DNA from tail homogenates. Of the 21 founder mice subjected to partial hepatectomy, nine produced transgenic SCAP as determined by immunoblot analysis (16). Mice with high levels of transgene ex-pression in liver were bred to C57BL/6J 3 SJL F1 mice, and three lines of PEPCK-HSV-SCAP(D443N) mice were established. Each line had similar levels of hepatic expression of the transgene, and all three lines showed fatty livers of comparable size. One line, desig-nated L969-4, was used for the experiments described in this study. Mice were housed in colony cages and maintained on a 14-h light/10-h dark cycle.
Diets. Three diets were used: (a) standard chow diet consisting of a 4% (wt/wt) animal fat mouse/rat diet 7001 (Harland Teklad, Madi-son, WI), (b) standard chow diet mixed with 1% (wt/wt) cholesterol (ICN Pharmaceuticals, Inc., Costa Mesa, CA) and 0.5% (wt/wt) cholic acid (ICN Pharmaceuticals, Inc.), and (c) standard chow mixed with 0.5% cholesterol and 0.25% cholic acid.
Immunoblotting. Nuclear extracts and membrane fractions (105-g
pellet) were prepared from mouse livers immediately after exsan-guination as described previously for hamster livers (30). Aliquots of membranes (50-mg protein) and nuclear extract (30-mg protein) were subjected to 8% SDS-PAGE, transferred to Hybond C Extra mem-branes (Amersham Corp.), and incubated with 5 mg/ml rabbit anti– mouse SREBP-1 IgG or 5 mg/ml rabbit anti–mouse SREBP-2 IgG (directed against amino acids 32–250 of SREBP-1 or SREBP-2, re-spectively; reference 31). Protein content of samples was determined with the BCA Kit (Pierce Chemical Co., Rockford, IL). Protein gels were calibrated with prestained molecular weight markers (Bio Rad, Hercules, CA). Immunoblot analysis was carried out with the Enhanced Chemiluminescence (ECL) Western Blotting Detection System KitTM (Amersham Corp.) with a horseradish-peroxidase
conjugated donkey anti–rabbit secondary antibody (Jackson Immu-noresearch Laboratories, West Grove, PA).
-TGGATTGGCATCCTGG-TATACACAG-39, and 39 primer 59 -GCGACCATCCTGAGGT-TGCCGC-39 (16); and mouse SCAP 59 primer 59 -GAGAACCTG-GTCCACGTGCACTTCAA-39, and 39 primer 59 -TCTCTAACCCA-ATAACCACCAC-39 (16). HindIII and EcoRI sites were added to all 59 and 39 primers, respectively, and subcloned into pGEM-3Zf(1) vector (Promega Corp., Madison, WI) as described (32). Probes for mouse SCD1 and SCD2 were previously reported (33). After linear-ization of the plasmid DNA with HindIII, antisense RNA was syn-thesized with either [a-32P]CTP or [a-32P]UTP by using
bacterio-phage T7 RNA polymerase (Ambion, Inc.). Specific activities of the cRNAs were measured in each experiment and were in the range of 1.7–2.6 3 109 cpm/mg except for b-actin which was 5.3–8.1 3 108 cpm/
mg, as a result of dilution of the [a-32P]CTP or [a-32P]UTP.
Aliquots of total RNA (5 or 15 mg) were assayed by RNase pro-tection with a HybSpeed II RPA kit (Ambion, Inc.) as previously de-scribed (32, 33). Each assay tube contained the indicated cRNA probe for the mRNA to be tested plus cRNA complementary to the b-actin mRNA. After digestion with RNase, the protected fragments were separated on an 8 M urea/4.8% polyacrylamide gel. Dried gels were exposed to film (ReflectionTM NEF 496; New England Nuclear–
DuPont, Boston, MA) and intensifying screens for 16 h at 2808C. Quantification of protected fragments for each test mRNA was car-ried out on a Bio-Imaging Analyzer (Fuji Medical Systems, Standish, ME), and the values were normalized to the signal generated by the level of b-actin mRNA in the same RNA sample.
Blot hybridization of RNA. Total RNA was prepared from mouse liver using the RNeasyTM Total RNA kit (Qiagen Inc., Chatsworth,
CA) or RNA Stat 60 (Tel Test “B” Inc., Friendswood, TX). Equal al-iquots of total RNA from mice in each group were pooled (total, 15 mg) and subjected to Northern blot analysis with the indicated cDNA probes prepared as previously described (31–35). The indicated cDNA probes were labeled by the random primer method using the Prime-It II Kit (Stratagene, La Jolla, CA) with [a-32P]dCTP. The 32
P-labeled probe was purified on a G-50 spin column (Pharmacia Bio-tech, Piscataway, NJ), hybridized to the filters (z 2 3 106 cpm/ml)
us-ing Rapid-hyb buffer (Amersham Corp.) for 2 h at 658C, washed twice with 0.1% (wt/vol) SDS/0.13 SSC at 658C for 30 min, and ex-posed to film (either X-OMAT; Kodak, Rochester, NY; or Reflec-tionTM NEF 496; New England Nuclear–Dupont) with intensifying
screens for 3–36 h at 2808C or 0.15–3 h at room temperature. The re-sulting bands were quantified on a Bio-Imaging Analyzer (Fuji Medi-cal Systems) as described above, and the results were normalized to the signal generated from hybridization of a 32P-labeled mouse
GAPDH cDNA probe on the same filter.
Hepatic cholesterol and fatty acid synthesis in vivo. The rates of cholesterol and fatty acid synthesis were measured in littermate
12-wk-old mice during the early light cycle after a 3-h fast. Each animal was injected intraperiotoneally with 50 mCi of [3H]water in 0.1 ml
iso-tonic saline. 1 h after injection, mice were anesthetized and 300– 500 ml of blood was removed to determine the specific activity of plasma [3H]water in duplicate. The amounts of digitonin-precipitable
[3H]sterols and [3H]fatty acids were measured after saponification of
200–300 mg aliquots of liver as previously described (34). The results are expressed as mmol of [3H]water incorporated into
digitonin-pre-cipitable sterols or fatty acids per hour per gram of tissue.
SCD activity. SCD activity was measured in microsomes of mouse liver as previously described (33). Each assay contained 0.1 M potassium phosphate (pH 7.2), 2 mM NADH, 60 mM [1-14C]stearoyl
CoA (23 dpm/pmol), and 0.1 mg of microsomal protein in a final vol-ume of 0.1 ml. After incubation for 5 min at 378C, the reaction mix-ture was saponified, and the fatty acids were methylated and sepa-rated by argentation thin layer chromatography (36). The band migrating with the oleic acid standard was subjected to liquid scin-tillation counting. Enzyme activity is expressed as the pmol of [14C]stearoyl CoA converted to [14C]oleic acid per minute per
milli-gram of microsomal protein.
[image:4.612.315.557.58.203.2]Fatty acid composition of liver extracts. Total lipids were ex-tracted from 300–350 mg aliquots of mouse liver and then separated on 500-mg silica columns (catalog No. 1211-3036; Varian, Harbor City, CA) as described (37). After saponification, the fatty acids in each sample were methylated and the relative abundance of each fatty acid was quantified by gas–liquid chromatography (GLC) (38, 39).
Figure 1. Livers from 12-wk-old wild-type (left) and TgSCAP-(D443N) (right) male mice from the same litter. Animals were main-tained on the standard chow diet.
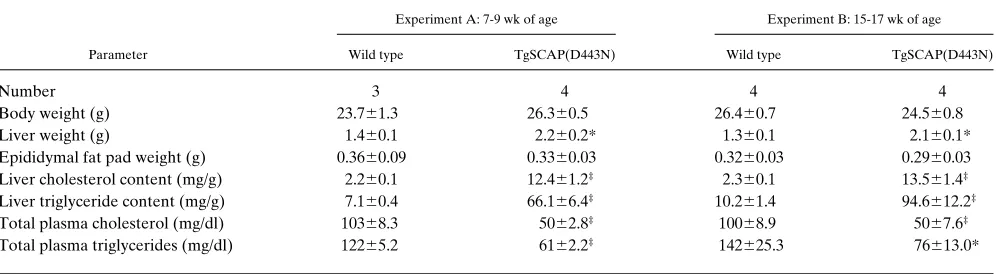
Table I. Phenotypic Comparison between Male Wild-type and TgSCAP(D443N) Transgenic Mice
Experiment A: 7-9 wk of age Experiment B: 15-17 wk of age
Parameter Wild type TgSCAP(D443N) Wild type TgSCAP(D443N)
Number 3 4 4 4
Body weight (g) 23.761.3 26.360.5 26.460.7 24.560.8
Liver weight (g) 1.460.1 2.260.2* 1.360.1 2.160.1*
Epididymal fat pad weight (g) 0.3660.09 0.3360.03 0.3260.03 0.2960.03 Liver cholesterol content (mg/g) 2.260.1 12.461.2‡ 2.360.1 13.561.4‡
Liver triglyceride content (mg/g) 7.160.4 66.166.4‡ 10.261.4 94.6612.2‡
Total plasma cholesterol (mg/dl) 10368.3 5062.8‡ 10068.9 5067.6‡
Total plasma triglycerides (mg/dl) 12265.2 6162.2‡ 142625.3 76613.0*
Each value represents the mean6SEM of the indicated number of 7–9-wk-old mice or 15–17-wk-old mice. In each experiment, the wild-type mice consisted of nontransgenic littermates of the transgenic mice. All mice were maintained on the standard chow diet and were fasted for 3 h before kill-ing. *P, 0.01: level of statistical significance (Student’s t test) between the indicated wild-type and transgenic mice. ‡P, 0.001: level of statistical
[image:4.612.58.556.556.693.2]Results
We constructed a transgene encoding SCAP(D443N) (16) un-der control of the PEPCK promoter (34). The encoded protein includes an NH2-terminal epitope tag derived from the HSV
glycoprotein followed by the full-length D443N mutant ver-sion of hamster SCAP. To maintain a relatively physiologic level of expression of SCAP(D443N), the transgenic mice
were fed a normal chow diet and not the low carbohydrate/ high protein diet that superactivates the PEPCK promoter.
Transgenic mice expressing SCAP(D443N) appeared nor-mal at birth. The aninor-mals showed a nornor-mal pattern of growth except for the abdomen which became progressively dis-tended, owing to an enlarged liver. Fig. 1 shows the livers of 12-wk-old wild-type and transgenic mice expressing SCAP-(D443N). The liver from the transgenic mouse is enlarged and pale in color, owing to massive accumulation of lipids.
Table I compares quantitative parameters between 7–9-wk-old wild-type and transgenic (Tg)SCAP(D443N) mice (experi-ment A) and between 15–17-wk-old wild-type and TgSCAP-(D443N) mice (experiment B). The body weights did not vary between wild-type and transgenic littermates, but the liver weights were increased 1.6-fold in the transgenic mice. The he-patic content of cholesterol and triglyceride was elevated by sixfold and ninefold, respectively. The plasma of the transgenic mice showed a 50% reduction in both cholesterol and triglycer-ides.
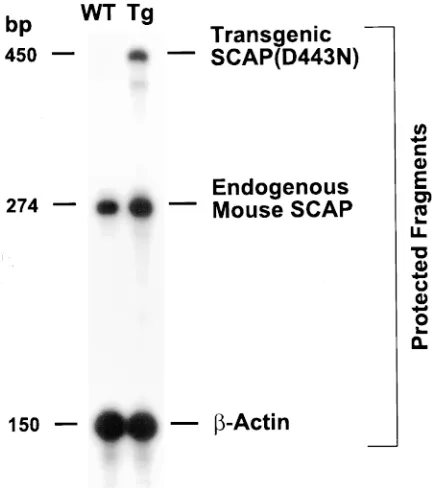
To quantify the expression level of the SCAP(D443N) transgene, an RNase protection assay was established to dis-tinguish between endogenous mouse SCAP and transgenic hamster SCAP(D443N). Total RNA from wild-type and trans-genic livers was hybridized with 32P-labeled cRNA probes for
mouse SCAP, TgSCAP(D443N), and an internal standard,
b-actin (Fig. 2). The cRNA probe for endogenous mouse SCAP yielded a protected band of 274 bp in wild-type and transgenic livers. A protected fragment of 450 bp that corre-sponds to the mRNA for hamster SCAP(D443N) was present in the transgenic animals and absent in wild-type littermates. Quantitative analysis of these data revealed that the ratio of SCAP(D443N) mRNA to endogenous mouse SCAP mRNA was 0.3 in the transgenic animals.
[image:5.612.56.273.59.303.2]To determine the effect of the SCAP(D443N) transgene on cleavage of endogenous SREBPs, nuclear SREBP (nSREBP) protein was measured by immunoblotting in extracts of livers from the wild-type and transgenic mice that were described in experiments A and B of Table I. The transgenic livers showed a substantial increase in the amount of nSREBP-1 and a con-comitant decrease in the amount of the membrane-bound pre-cursor (Fig. 3, lanes 1, 2, 5, and 6). Similar changes were ob-served for SREBP-2 (lanes 3, 4, 7, and 8).
Figure 2. RNase protection assays of endogenous mouse SCAP mRNA and transgenic hamster SCAP(D443N) mRNA in livers from wild-type and TgSCAP(D443N) mice. Aliquots of total RNA (15 mg) from the pooled livers of the mice described in Table I (experiment A) were hybridized in solution for 10 min at 688C to the 32P-labeled
cRNA probes for endogenous mouse SCAP, transgenic hamster SCAP(D443N), and b-actin as described in Methods. After RNase digestion, the protected fragments were separated by gel electro-phoresis, and exposed to film (ReflectionTM NEF 496; New England
[image:5.612.57.482.549.701.2]Nuclear–Dupont) with an intensifying screen for 16 h at 2808C.
Figure 3. Immunoblot analysis of SREBP-1 and SREBP-2 in mem-branes and nuclear extracts from liv-ers of wild-type and SCAP(D443N) transgenic mice at different ages. Livers from the two groups of mice in Table I (experiments A and B) were separately pooled, and ali-quots of the membrane pellet (50 mg protein) and nuclear extract (30 mg) were subjected to 8% SDS-PAGE. Immunoblot analysis was performed using 5 mg/ml of rabbit anti–mouse SREBP-1 IgG (lanes 1, 2, 5, and 6) or SREBP-2 IgG (lanes 3, 4, 7, and
8) as the primary antibody and 0.25 mg/ml horseradish peroxidase–coupled donkey anti–rabbit IgG as the secondary antibody. Filters were exposed to film (ReflectionTM NEF 496;
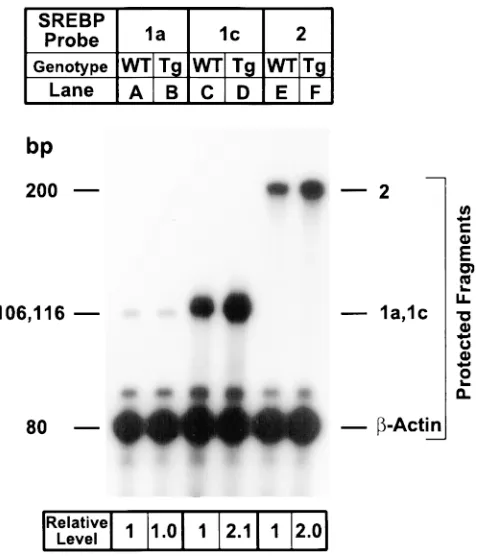
The SREBP-1 gene gives rise to two transcripts, desig-nated -1a and -1c, that differ in the length of the NH2-terminal
acidic domain that serves as a transcription activator (32, 35). SREBP-1a has a longer acidic activation domain, and
there-fore it is a much more potent transcriptional activator than SREBP-1c. The SREBP-1 antibody used for the immunoblots of Fig. 3 does not distinguish between SREBP-1a and -1c. We therefore refer to these isoforms generically as SREBP-1. To measure the amounts of the mRNAs for SREBP-1a and -1c separately, we used a sensitive RNase protection assay (32). In wild-type livers, the amount of the mRNA for SREBP-1a was low, and it was unaffected by the transgene (Fig. 4, lanes A and
B). The amounts of SREBP-1c and SREBP-2 mRNAs were relatively high, and they were both increased approximately twofold in the transgenic mice (lanes C–F).
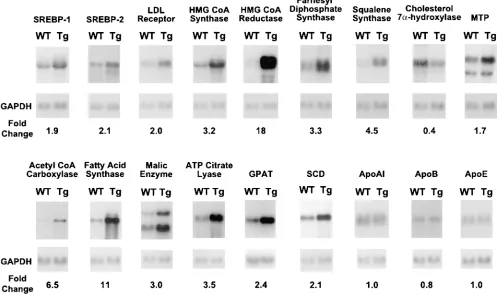
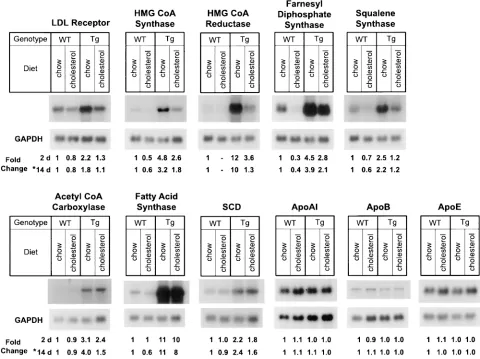
Fig. 5 shows the amounts of multiple mRNAs encoding proteins involved in lipid metabolism in wild-type and trans-genic livers as estimated by Northern blot analysis. Signifi-cant increases were measured in the mRNAs for SREBP-1, SREBP-2, and the LDL receptor as well as multiple enzymes involved in cholesterol biosynthesis. In particular, there was a pronounced 18-fold increase in the mRNA for HMG CoA re-ductase, a rate-controlling enzyme in the cholesterol biosyn-thetic pathway. The mRNAs for the fatty acid biosynbiosyn-thetic en-zymes acetyl CoA carboxylase, fatty acid synthase, and SCD were also significantly increased. Increases were also observed for the mRNAs encoding malic enzyme and ATP citrate lyase, which supply NADPH and acetyl CoA for fatty acid synthesis, respectively. The mRNA for glycerol-3-phosphate acyltrans-ferase (GPAT) was also increased. This enzyme carries out a crucial step in phospholipid and triglyceride synthesis (13). We found no changes in the mRNAs for three apoproteins of the lipoprotein transport system, namely apo AI, apo B, and apo E. The mRNA analyses in Fig. 5 were repeated in three inde-pendent experiments involving different litters of mice, and similar quantitative results were obtained.
To confirm that the elevated mRNAs for the cholesterol and fatty acid biosynthetic enzymes in the transgenic livers led to increased rates of lipid synthesis, we measured the in vivo rates of synthesis of cholesterol and fatty acids using intraperi-toneally injected [3H]water (34). Table II shows that
trans-genic livers had five- and sevenfold increases in the rates of incorporation of [3H]water into digitonin-precipitable sterols
and fatty acids, respectively, when expressed per gram of liver. Inasmuch as the transgenic livers were significantly larger than wild-type livers, the total increase in synthesis per organ was even greater.
In previous experiments, we showed that overexpression of SREBP-1a or SREBP-2 stimulates transcription of the gene encoding SCD2, an isoform of SCD whose mRNA is not
nor-Figure 4. Amounts of mRNA for SREBP-1a, -1c, and -2 in livers of wild-type mice (lanes A, C, and E) and TgSCAP(D443N) mice (lanes
B, D, and F). Total RNA from mice in Table I (experiment A) was isolated from pooled livers as described in Methods. Aliquots of total RNA (15 mg) from the indicated source were hybridized in solution for 10 min at 688C to the indicated 32P-labeled cRNA probes for
SREBP-1a, SREBP-1c, or SREBP-2, all in the presence of a 32
P-labeled cRNA probe for b-actin as described in Methods. After RNase digestion, the protected fragments were separated by gel elec-trophoresis, exposed to film (ReflectionTM NEF 496; New England
[image:6.612.59.298.58.336.2]Nuclear–Dupont) with an intensifying screen for 16 h at 2808C, and quantified by a Bio-Imaging Analyzer (Fuji Medical Systems). The sizes of the protected fragments for SREBP-1a and SREBP-1c are 106 and 116 bp, respectively. The quantitative data were corrected for the number of 32P-atoms in each protected fragment (32).
Table II. In Vivo Synthesis of Sterols and Fatty Acids in Livers from Wild-type and TgSCAP(D443N) Mice
Incorporation of [3H] water into
Genotype of mice Liver weight Digitonin-precipitable sterols Fatty acids
g mmol/h/g mmol/h/organ mmol/h/g mmol/h/organ
Wild type 1.160.1 0.9160.1 1.060.2 5.961.1 6.261.4
TgSCAP(D443N) 2.460.2* 4.761.3‡ 10.462.4‡ 43.863.8* 106.1617.3*
Each value represents the mean6SEM of four 12-wk-old littermate mice of the indicated genotype. All mice were maintained on the standard chow diet and fasted for 3 h before intraperitoneal injection of [3H] water. 1 h after injection, the liver was removed for measurement of its content of 3
H-labeled digitonin-precipitable sterols and fatty acids as described in Methods. *P, 0.01: level of statistical significance (Student’s t test) between the indicated line of wild-type and transgenic mice. ‡P, 0.05: level of statistical significance (Student’s t test) between the indicated line of wild-type and
[image:6.612.57.554.599.684.2]mally detected in liver (33). Tabor et al. (14) recently showed in promoter-reporter assays that transfected rat SREBP-1c/ ADD1 activates transcription of the SCD2 gene in cultured human HepG2 cells. In Fig. 5, the cDNA probe for SCD could potentially cross-react with both SCD1 and SCD2. To distin-guish between the two isoforms, we again used an RNase pro-tection assay (Fig. 6). As a positive control, we studied mRNA from epididymal fat pads of wild-type mice, which are known
Figure 5. Amounts of various mRNAs in livers of wild-type and TgSCAP(D443N) mice. Total RNA isolated from mice in Table I (experiment A) was pooled and aliquots (15 mg) from the indicated source were subjected to electrophoresis and blot hybridization with the indicated 32P-labeled
probe. The amount of radioactivity in each band was quantified with a Bio-Imaging Analyzer (Fuji Medical Systems) as described in Methods. The fold change in TgSCAP(D443N) mice relative to that of wild-type mice was calculated after correction for loading differences determined by GAPDH hybridization to the same filter. The probe for SCD was a mouse SCD-1 cDNA fragment that detects both SCD-1 and SCD-2 mRNAs (33, 34). Filters were exposed to film (X-OMAT; Kodak) for 3–36 h at 2808C. MTP, microsomal triglyceride transfer protein.
Figure 6. Amounts of mRNA for SCD-1 and SCD-2 in livers of wild-type and TgSCAP(D443N) mice. Total RNA from mice in Table I (experiment A) was isolated from pooled livers. Aliquots of total RNA (5 mg) from the indicated source were hybridized in solution for 10 min at 688C to the indicated 32P-labeled cRNA probes for SCD-1
or SCD-2 in the presence of a 32P-labeled cRNA probe for b-actin as
described in Methods. After RNase digestion, the protected frag-ments were separated by gel electrophoresis and exposed to film (Re-flectionTM NEF 496; New England Nuclear–Dupont) with an
[image:7.612.57.297.452.632.2]intensi-fying screen for 16 h at 2808C.
Table III. SCD Activity in Livers from Wild-type and TgSCAP(D443N) Mice
Genotype of mice Liver weight SCD activity
g pmol/min per mg
Wild type 1.460.1 3266152
TgSCAP(D443N) 2.060.1* 10326184‡
Each value represents the mean6SEM of four 16-wk-old male litter-mate mice of the indicated genotype. All mice were maintained on the standard chow diet and fasted for 3 h before killing. Microsomes were prepared from individual livers and incubated with [14C]stearoyl CoA as
described in Methods. *P , 0.01: level of statistical significance (Stu-dent’s t test) between the indicated line of wild-type and transgenic mice. ‡P, 0.005; Level of statistical significance (Student’s t test)
[image:7.612.314.557.585.654.2]to express both SCD isoforms (Fig. 6, lanes E and F) (40, 41). In the transgenic livers, the mRNA for SCD1 was increased by twofold (Fig. 6, lanes A and B). In wild-type mice, the mRNA for SCD2 was absent, but it appeared in the transgenic livers (Fig. 6, lanes C and D), reaching the same level as observed in white adipose tissue.
To confirm that the increases in SCD1 and SCD2 mRNA in the transgenic mice resulted in increased desaturase activity, we measured SCD activity in extracts from livers of wild-type and transgenic littermates. Table III shows the mean SCD ac-tivities from liver microsomes as determined by the rate of conversion of [1-14C]stearoyl CoA to [1-14C]oleate. The
mi-crosomes from the transgenic mice had threefold higher SCD enzyme activity compared to littermate controls.
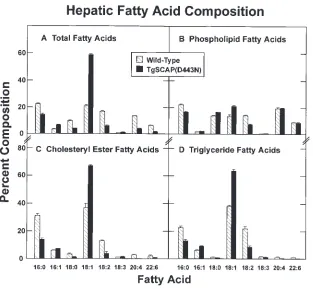
[image:8.612.59.372.56.345.2]The primary products of fatty acid synthesis are the two saturated fatty acids, palmitic acid (16 carbons/0 double bonds) and stearic acid (18:0). SCD converts these to the monounsaturated fatty acids palmitoleic acid (16:1) and oleic acid (18:1), respectively. To determine whether the increase in SCD activity led to an increase in the content of monounsat-urated fatty acids in liver, we used a GLC assay to measure the total fatty acid composition and the composition of three classes of lipids in wild-type and transgenic livers (Fig. 7). The total amounts of monounsaturated fatty acids were elevated in the transgenic livers. There was a twofold increase in the rela-tive amount of palmitoleic acid and a 2.8-fold increase in oleic acid (Fig. 7, A). There was a concomitant reduction in the rela-tive amounts of saturated and polyunsaturated fatty acids. The
Figure 7. Relative fatty acid composition of lipids from livers of wild-type and TgSCAP(D443N) mice on the standard chow diet. Four male mice (12 wk old) in each group were killed, the liver lip-ids were separated, and the fatty acid content was measured by GLC as described in Methods. Each value represents the mean6SEM of values from four male mice. Values are expressed as the per-cent of the total fatty acids in each lipid class. Er-ror bars denote SEM. The mean6SEM values for liver weights for the wild-type and transgenic mice were 1.460.1 and 2.060.2 g, respectively.
Table IV. Content of Cholesterol in Plasma and Livers of Wild-type and TgSCAP(D443N) Mice on Different Diets
Plasma cholesterol content Liver cholesterol content
Diet Duration of treatment Wild type Transgenic Wild type Transgenic
d mg/dl mg/g tissue
Experiment A
Chow – 9868 4967* 2.160.3 1361.5*
1% cholesterol 1 0.5% cholic acid 2 153611 100618 8.461.1 1362.7 1% cholesterol 1 0.5% cholic acid 4 157642 116621 1463.6 1662.2 Experiment B
Chow – 10069 5068* 2.360.1 1561.4*
0.5% cholesterol 1 0.25% cholic acid 14 130615 95621 9.462.0 2863.2‡
[image:8.612.55.556.554.693.2]increase in monounsaturated fatty acids was similarly reflected in the composition of the phospholipid, cholesteryl ester, and triglyceride fractions (Fig. 7, B–D).
The livers of the transgenic mice had increased levels of nSREBP-1 and -2 despite a marked increase of hepatic choles-terol, which should have inhibited SREBP processing. This suggests that SCAP(D443N) may block feedback inhibition of SREBP processing in liver, as it does in cultured cells (2, 16). To test this hypothesis more directly, we fed the mice choles-terol plus a bile acid (cholic acid) in an attempt to increase the hepatic cholesterol content of wild-type mice to the levels ob-served in the SCAP(D443N) transgenics. The cholic acid was included to increase cholesterol absorption from the intes-tine and to downregulate hepatic cholesterol 7a-hydroxylase, which initiates the conversion of cholesterol to bile acids, thereby lessening the cholesterol buildup (42). Table IV shows the hepatic and plasma cholesterol content of wild-type and transgenic animals when fed a 1% cholesterol/0.5% cholic acid diet for 2 or 4 d. After 4 d on the cholesterol/cholic acid diet, the liver cholesterol content of wild-type mice had risen to the level seen in the transgenic mice on a chow diet.
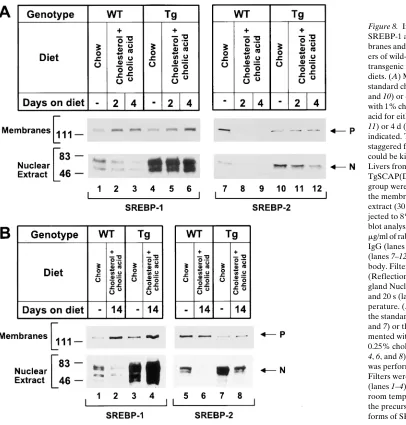
Fig. 8 A shows immunoblot analyses of SREBPs in nuclear
extracts and membrane fractions from livers of the mice de-scribed in Table IV. In wild-type mice, supplementing the chow diet with 1% cholesterol/0.5% cholic acid diet for 2 or 4 d resulted in a partial decrease of nSREBP-1 (Fig. 8 A, lanes
1–3) and a complete disappearance of nSREBP-2 (Fig. 8 A, lanes 7–9). In the transgenic mice on a chow diet, the content of nSREBP-1 and nSREBP-2 was markedly elevated (Fig. 8 A, lanes 4 and 10). In these mice the 1% cholesterol/0.5% cholic acid diet did not reduce the content of nSREBP-1 (Fig. 8 A, lanes 5 and 6), but it did cause a detectable decrease in nSREBP-2 (Fig. 8 A, lanes 11 and 12). Densitometric analysis of these blots showed that nSREBP-2 decreased by . 98% in the wild-type mice after 2 or 4 d on the cholesterol/cholic acid diet. In the transgenic mice, the level declined by 30% at 2 d and 80% at 4 d.
[image:9.612.61.467.318.743.2]To determine the effects of a more chronic ingestion of cholesterol, wild-type and transgenic animals were fed a 0.5% cholesterol/0.25% cholic acid diet for 14 d (Fig. 8 B). Again, wild-type livers showed reduced nSREBP-1 (Fig. 8 B, lane 2) and a complete absence of immunodetectable nSREBP-2 (Fig. 8 B, lane 6). In the transgenic livers, we observed no reduction in nSREBP-1 (Fig. 8 B, lane 4) and only a partial reduction in
Figure 8. Immunoblot analysis of SREBP-1 and SREBP-2 in mem-branes and nuclear extracts from liv-ers of wild-type and SCAP(D443N) transgenic male mice on different diets. (A) Mice were placed on the standard chow diet (lanes 1, 4, 7, and 10) or chow diet supplemented with 1% cholesterol and 0.5% cholic acid for either 2 d (lanes 2, 5, 8, and
11) or 4 d (lanes 3, 6, 9, and 12) as indicated. The diets were begun in a staggered fashion so that all mice could be killed at the same time. Livers from four wild-type and four TgSCAP(D443N) mice/treatment group were pooled, and aliquots of the membrane (50 mg) and nuclear extract (30 mg) fractions were sub-jected to 8% SDS-PAGE. Immuno-blot analysis was performed using 5 mg/ml of rabbit anti–mouse SREBP-1 IgG (lanes 1–6) or SREBP-2 IgG (lanes 7–12) as the primary anti-body. Filters were exposed to film (ReflectionTM NEF 496; New
En-gland Nuclear) for 15 s (lanes 1–6) and 20 s (lanes 7–12) at room tem-perature. (B) Mice were placed on the standard chow diet (lanes 1, 3, 5, and 7) or the chow diet supple-mented with 0.5% cholesterol and 0.25% cholic acid for 14 d (lanes 2,
nSREBP-2 (Fig. 8 B, lane 8) (50% as determined by densito-metric scanning).
To examine the regulation of the SREBP target genes in the cholesterol-fed animals, total RNA was isolated from liv-ers of wild-type and transgenic mice that had been fed 1% cho-lesterol/0.5% cholic acid for 2 d (2-d animals from Fig. 8 A). In wild-type mice, this diet produced 30–60% reductions in the mRNAs for HMG CoA synthase, farnesyl diphosphate syn-thase, and squalene synthase (Fig. 9). The amount of HMG CoA reductase mRNA was too low for accurate measurement. The LDL receptor mRNA decreased by only 20%. The mRNA levels for the fatty acid synthetic enzymes acetyl CoA carboxylase, fatty acid synthase, and SCD were either un-changed or slightly reduced with the cholesterol diet. In the SCAP(D443N) transgenic mice, the mRNAs for the choles-terol synthetic enzymes were also decreased, but they re-mained much higher than was seen in the chow-fed wild-type mice. Fig. 9 also gives the values obtained from quantitative analysis of the Northern blots of total RNA isolated from liv-ers of wild-type and transgenic mice that had been fed the 0.5% cholesterol/0.25% cholic acid diet for 14 d (*). The re-sults were similar to those seen at 2 d.
Discussion
The data presented in this paper implicate SCAP as the gate-keeper that enforces feedback regulation of cholesterol syn-thesis in mouse liver. When the liver expressed a mutant ver-sion of SCAP that is resistant to feedback suppresver-sion by sterols, the amounts of nSREBP-1 and -2 rose markedly and there was a concomitant increase in the amounts of mRNAs derived from multiple genes in the pathways of cholesterol and fatty acid biosynthesis. Overproduction of cholesterol and fatty acids led to marked engorgement of the liver with choles-teryl esters and triglycerides, and yet the rates of lipid synthe-sis remained high. These results were similar to those previ-ously observed in transgenic mice that overexpress truncated dominant positive nSREBPs that enter the nucleus without proteolysis and are therefore immune from SCAP-mediated downregulation (34, 35, 43). Considered together, the results indicate that tonic suppression of SREBP cleavage, mediated by the sterol-sensing domain of SCAP, is necessary to prevent overproduction of lipids in the liver.
In these experiments, the expression of the SCAP transgene was driven by the PEPCK promoter, which produces a
[image:10.612.57.537.335.694.2]ate level of expression in the liver when the mice eat a standard chow diet. The PEPCK promoter can be induced further by feeding the animals a low carbohydrate/high protein diet (26). We deliberately avoided this diet in these studies because we wished to maintain the level of mutant SCAP(D443N) expres-sion within a relatively physiologic range. Indeed, quantitative measurements of mRNA levels revealed that the amount of SCAP(D443N) mRNA derived from the transgene was only 30% of the amount derived from the wild-type gene in the transgenic mouse liver (Fig. 2). Despite this low level of expres-sion, the mutant SCAP was able to stimulate cleavage of both SREBP-1 and SREBP-2 and to render this cleavage partially resistant to feedback regulation by dietary cholesterol.
In the transgenic mice, cholesterol feeding dissociated the regulation of SREBP-1 and SREBP-2, and the experiments therefore provide some information about the individual roles of these two transcription factors in the liver. When wild-type mice were fed a cholesterol/cholic acid diet, the amount of nSREBP-2 declined to unmeasurable levels within 2 d (Fig. 8). The amount of nSREBP-1 was also reduced, but less com-pletely. In the SCAP(D443N) transgenic animals, the choles-terol/cholic acid diet did not eliminate nSREBP-2, but it did reduce it partially. nSREBP-1 was not decreased, and it even appeared to be slightly increased. The amounts of the mRNAs for the cholesterol and fatty acid biosynthetic enzymes tended to parallel the amounts of nSREBP-2, rather than nSREBP-1. In the transgenic mice, the levels of these mRNAs, as well as that for the LDL receptor, declined partially after cholesterol feeding, suggesting that their transcription was being driven primarily by nSREBP-2, and not by nSREBP-1, which re-mained elevated. This finding is consistent with the observa-tion that SREBP-1c is the predominant form of SREBP-1 in both the wild-type and transgenic livers (Fig. 4). Transgenic animals overexpressing truncated dominant positive SREBP-1c have much less elevation in target gene mRNAs than do the animals expressing truncated SREBP-2, indicating that SREBP-2 is a more potent activator of transcription than is SREBP-1c in liver (35, 43) as it is in cultured cells (44).
This data also lend support to the notion that the SREBPs play different roles in regulating cholesterol synthesis than they do in regulating fatty acid synthesis. When wild-type mice were fed cholesterol, there was a marked decline in nSREBPs, and this was accompanied by a clear decline in the mRNAs for at least four enzymes in the cholesterol biosynthetic pathway (Fig. 9). On the other hand, there was much less decline in the mRNAs for acetyl CoA carboxylase and fatty acid synthase. These data support the concept that basal transcription of the fatty acid–synthesizing enzymes is driven primarily by factors other than SREBPs, whereas the cholesterologenic enzymes are more dependent upon SREBPs, even in the basal state (2, 44). Both of these pathways can be activated further by ele-vated levels of nSREBPs. These findings are similar to those in cultured cells. Cultured cells with defects in SREBP processing have a complete absence of cholesterol synthesis, but only a partial reduction of fatty acid synthesis (44).
In the TgSCAP(D443N) mice, the levels of mRNA for SREBP-1 and SREBP-2 were elevated (Fig. 5). This suggests that there may be a feed-forward system by which elevated levels of nSREBPs induce transcription of their own genes. In-deed, Sato et al. (45) showed that transfected nSREBP-2 acti-vates a reporter construct driven by the native promoter re-gion of the human SREBP-2 gene (2140 to 1172 bp).
Despite the massive elevation in hepatic lipids in the SCAP(D443N) transgenic mice, the levels of cholesterol and triglycerides in plasma were below normal (Table I). This is similar to previous observations in transgenic mice expressing truncated dominant positive SREBP-1a (34) and SREBP-2 (43). It is possible that these mice do synthesize increased amounts of lipid-enriched lipoproteins, but that the plasma level is kept low because of rapid clearance mediated by the el-evated LDL receptors. Alternatively, the transgenic livers may secrete less lipoproteins. Answers to these questions should emerge from cross-breeding experiments between the various SREBP transgenics and homozygous LDL receptor–deficient mice (46).
Acknowledgments
We thank our colleague Hitoshi Shimano for helpful discussions, Scott Clark and Debra Morgan for excellent technical assistance, Shan Maika and Beth Hinnant for superb genotyping of mice, Rich-ard Gibson for invaluable help with the animals, and Maz Hasan for kindly providing the pRI2-intronA plasmid.
This work was supported by research grants from the National In-stitutes of Health (HL20948), the Moss Heart Foundation, and the Perot Family Foundation. B.S. Korn is supported by Medical Scien-tist Training grant GM08014. I. Shimomura is the recipient of a re-search fellowship from the Manpei Suzuki Diabetes Foundation of Tokyo, Japan. J.D. Horton was the recipient of a postdoctoral fellow-ship for physicians from the Howard Hughes Medical Institute.
References
1. Gould, R.G., C.B. Taylor, J.S. Hagerman, I. Warner, and D.J. Campbell. 1953. Cholesterol metabolism: effect of dietary cholesterol on the synthesis of cholesterol in dog tissue in vitro. J. Biol. Chem. 201:519–523.
2. Brown, M.S., and J.L. Goldstein. 1997. The SREBP pathway: regulation of cholesterol metabolism by proteolysis of a membrane-bound transcription factor. Cell. 89:331–340.
3. Duncan, E.A., M.S. Brown, J.L. Goldstein, and J. Sakai. 1997. Cleavage site for sterol-regulated protease localized to a Leu-Ser bond in luminal loop of sterol regulatory element binding protein-2. J. Biol. Chem. 272:12778–12785.
4. Duncan, E.A., U.P. Davé, J. Sakai, J.L. Goldstein, and M.S. Brown. 1998. Second-site cleavage in sterol regulatory element–binding protein occurs at transmembrane junction as determined by cysteine panning. J. Biol. Chem. 273: 17801–17809.
5. Yokoyama, C., X. Wang, M.R. Briggs, A. Admon, J. Wu, X. Hua, J.L. Goldstein, and M.S. Brown. 1993. SREBP-1, a basic helix-loop-helix leucine zipper protein that controls transcription of the LDL receptor gene. Cell. 75: 187–197.
6. Hua, X., C. Yokoyama, J. Wu, M.R. Briggs, M.S. Brown, J.L. Goldstein, and X. Wang. 1993. SREBP-2, a second basic-helix-loop-helix-leucine zipper protein that stimulates transcription by binding to a sterol regulatory element.
Proc. Natl. Acad. Sci. USA. 90:11603–11607.
7. Ericsson, J., S.M. Jackson, and P.A. Edwards. 1996. Synergistic binding of sterol regulatory element–binding protein and NF-Y to the farnesyl diphos-phate synthase promoter is critical for sterol-regulated expression of the gene.
J. Biol. Chem. 271:24359–24364.
8. Guan, G., P. Dai, and I. Shechter. 1998. Differential transcriptional regu-lation of the human squalene synthase gene by sterol regulatory element–bind-ing proteins (SREBP) 1a and 2 and involvement of 59 DNA sequence elements in the regulation. J. Biol. Chem. 273:12526–12535.
9. Kim, J.B., G.D. Spotts, Y.-D. Halvorsen, H.-M. Shih, T. Ellenberger, H.C. Towle, and B.M. Spiegelman. 1995. Dual DNA binding specificity of ADD1/SREBP1 controlled by a single amino acid in the basic helix-loop-helix domain. Mol. Cell Biol. 15:2582–2588.
10. Bennett, M.K., J.M. Lopez, H.B. Sanchez, and T.F. Osborne. 1995. Ste-rol regulation of fatty acid synthase promoter: coordinate feedback regulation of two major lipid pathways. J. Biol. Chem. 270:25578–25583.
11. Kim, J.B., and B.M. Spiegelman. 1996. ADD1/SREBP1 promotes adi-pocyte differentiation and gene expression linked to fatty acid metabolism.
Genes Dev. 10:1096–1107.
13. Ericsson, J., S.M. Jackson, J.B. Kim, B.M. Spiegelman, and P.A. Ed-wards. 1997. Identification of glycerol-3-phosphate acyltransferase as an adipo-cyte determination and differentiation factor 1– and sterol regulatory element– binding protein-responsive gene. J. Biol. Chem. 272:7298–7305.
14. Tabor, D.E., J.B. Kim, B.M. Spiegelman, and P.A. Edwards. 1998. Tran-scriptional activation of the stearoyl-CoA desaturase 2 gene by sterol regula-tory element–binding protein/adipocyte determination and differentiation fac-tor 1. J. Biol. Chem. 273:22052–22058.
15. Wang, X., R. Sato, M.S. Brown, X. Hua, and J.L. Goldstein. 1994. SREBP-1, a membrane-bound transcription factor released by sterol-regulated proteolysis. Cell. 77:53–62.
16. Hua, X., A. Nohturfft, J.L. Goldstein, and M.S. Brown. 1996. Sterol re-sistance in CHO cells traced to point mutation in SREBP cleavage activating protein (SCAP). Cell. 87:415–426.
17. Nohturfft, A., M.S. Brown, and J.L. Goldstein. 1998. Topology of SREBP cleavage–activating protein, a polytopic membrane protein with a ste-rol-sensing domain. J. Biol. Chem. 273:17243–17250.
18. Neer, E.J., C.J. Schmidt, R. Nambudripad, and T.F. Smith. 1994. The ancient regulatory-protein family of WD-repeat proteins. Nature. 371:297–300.
19. Sakai, J., A. Nohturfft, J.L. Goldstein, and M.S. Brown. 1998. Cleavage of sterol regulatory element binding proteins (SREBPs) at site-1 requires inter-action with SREBP cleavage–activating protein. Evidence from in vivo compe-tition studies. J. Biol. Chem. 273:5785–5793.
20. Nohturfft, A., M.S. Brown, and J.L. Goldstein. 1998. Sterols regulate processing of carbohydrate chains of wild-type SREBP cleavage-activating pro-tein (SCAP), but not sterol-resistant mutants Y298C or D443N. Proc. Natl. Acad. Sci. USA. 95:12848–12853.
21. Gil, G., J.R. Faust, D.J. Chin, J.L. Goldstein, and M.S. Brown. 1985. Membrane-bound domain of HMG CoA reductase is required for sterol-enhanced degradation of the enzyme. Cell. 41:249–258.
22. Olender, E.H., and R.D. Simoni. 1992. The intracellular targeting and membrane topology of 3-hydroxy-3-methylglutaryl-CoA reductase. J. Biol.
Chem. 267:4223–4235.
23. Chang, T.-Y., and J.S. Limanek. 1980. Regulation of cytosolic ace-toacetyl coenzyme A thiolase, 3-hydroxy-3-methylglutaryl coenzyme A syn-thase, 3-hydroxy-3-methylglutaryl coenzyme A reductase, and mevalonate ki-nase by low density lipoprotein and by 25-hydroxycholesterol in Chinese hamster ovary cells. J. Biol. Chem. 255:7787–7795.
24. Yokode, M., R.E. Hammer, S. Ishibashi, M.S. Brown, and J.L. Gold-stein. 1990. Diet-induced hypercholesterolemia in mice: prevention by overex-pression of LDL receptors. Science. 250:1273–1275.
25. Bucolo, G., and H. David. 1973. Quantitative determination of serum triglycerides by the use of enzymes. Clin. Chem. 19:476–482.
26. Short, M.K., D.E. Clouthier, I.M. Schaefer, R.E. Hammer, M.A. Mag-nuson, and E.G. Beale. 1992. Tissue-specific, developmental, hormonal, and di-etary regulation of rat phosphoenolpyruvate carboxykinase–human growth hormone fusion genes in transgenic mice. Mol. Cell Biol. 12:1007–1020.
27. Palmiter, R.D., E.P. Sandgren, M.R. Avarbock, D.D. Allen, and R.L. Brinster. 1991. Heterologous introns can enhance expression of transgenes in mice. Proc. Natl. Acad. Sci. USA. 88:478–482.
28. Hofmann, S.L., D.W. Russell, M.S. Brown, J.L. Goldstein, and R.E. Hammer. 1988. Overexpression of low density lipoprotein (LDL) receptor eliminates LDL from plasma in transgenic mice. Science. 239:1277–1281.
29. Chen, C.W., and C.A. Thomas, Jr. 1980. Recovery of DNA segments from agarose gels. Anal. Biochem. 101:339–341.
30. Sheng, Z., H. Otani, M.S. Brown, and J.L. Goldstein. 1995. Independent
regulation of sterol regulatory element binding proteins 1 and 2 in hamster liver. Proc. Natl. Acad. Sci. USA. 92:935–938.
31. Shimano, H., I. Shimomura, R.E. Hammer, J. Herz, J.L. Goldstein, M.S. Brown, and J.D. Horton. 1997. Elevated levels of SREBP-2 and cholesterol synthesis in livers of mice homozygous for a targeted disruption of the SREBP-1 gene. J. Clin. Invest. 100:2115–2124.
32. Shimomura, I., H. Shimano, J.D. Horton, J.L. Goldstein, and M.S. Brown. 1997. Differential expression of exons 1a and 1c in mRNAs for sterol regulatory element binding protein–1 in human and mouse organs and cultured cells. J. Clin. Invest. 99:838–845.
33. Shimomura, I., H. Shimano, B.S. Korn, Y. Bashmakov, and J.D. Hor-ton. 1999. Nuclear sterol regulatory element-binding proteins activate genes re-sponsible for the entire program of unsaturated fatty acid biosynthesis in trans-genic mouse liver. J. Biol. Chem. In press.
34. Shimano, H., J.D. Horton, R.E. Hammer, I. Shimomura, M.S. Brown, and J.L. Goldstein. 1996. Overproduction of cholesterol and fatty acids causes massive liver enlargement in transgenic mice expressing truncated SREBP-1a.
J. Clin. Invest. 98:1575–1584.
35. Shimano, H., J.D. Horton, I. Shimomura, R.E. Hammer, M.S. Brown, and J.L. Goldstein. 1997. Isoform 1c of sterol regulatory element binding pro-tein is less active than isoform 1a in livers of transgenic mice and in cultured cells. J. Clin. Invest. 99:846–854.
36. Goldstein, J.L., S.E. Dana, J.R. Faust, A.L. Beaudet, and M.S. Brown. 1975. Role of lysosomal acid lipase in the metabolism of plasma low density li-poprotein: observations in cultured fibroblasts from a patient with cholesteryl ester storage disease. J. Biol. Chem. 250:8487–8495.
37. Hamilton, J.G., and K. Comai. 1988. Rapid separation of neutral lipids, free fatty acids and polar lipids using prepacked silica Sep-pak columns. Lipids.
23:1146–1149.
38. Lepage, G., and C.C. Roy. 1986. Direct transesterification of all classes of lipids in a one-step reaction. J. Lipid Res. 27:114–120.
39. Woollett, L.A., D.K. Spady, and J.M. Dietschy. 1992. Regulatory effects of the saturated fatty acids 6:0 through 18:0 on hepatic low density lipoprotein receptor activity in the hamster. J. Clin. Invest. 89:1133–1141.
40. Kaestner, K.H., J.M. Ntambi, T.J. Kelly, Jr., and M.D. Lane. 1989. Dif-ferentiation-induced gene expression in 3T3-L1 preadipocytes. A second differ-entially expressed gene encoding stearoyl-CoA desaturase. J. Biol. Chem. 264: 14755–14761.
41. Ntambi, J.M. 1995. The regulation of stearoyl-CoA desaturase (SCD).
Prog. Lipid Res. 34:139–150.
42. Russell, D.W., and K.D.R. Setchell. 1992. Bile acid biosynthesis. Bio-chemistry. 31:4737–4749.
43. Horton, J.D., I. Shimomura, M.S. Brown, R.E. Hammer, J.L. Goldstein, and H. Shimano. 1998. Activation of cholesterol synthesis in preference to fatty acid synthesis in liver and adipose tissue of transgenic mice overproducing SREBP-2. J. Clin. Invest. 101:2331–2339.
44. Pai, J.-T., O. Guryev, M.S. Brown, and J.L. Goldstein. 1998. Differential stimulation of cholesterol and unsaturated fatty acid biosynthesis in cells ex-pressing individual nuclear sterol regulatory element binding proteins. J. Biol.
Chem. 273:26138–26148.
45. Sato, R., J. Inoue, Y. Kawabe, T. Kodama, T. Takano, and M. Maeda. 1996. Sterol-dependent transcriptional regulation of sterol regulatory element– binding protein–2. J. Biol. Chem. 271:26461–26464.