0095-1137/10/$12.00 doi:10.1128/JCM.00208-10
Copyright © 2010, American Society for Microbiology. All Rights Reserved.
Does Bleach Processing Increase the Accuracy of Sputum Smear
Microscopy for Diagnosing Pulmonary Tuberculosis?
䌤
A. Cattamanchi,
1,2* J. L. Davis,
1,2M. Pai,
3L. Huang,
1,4P. C. Hopewell,
1,2and K. R. Steingart
2 Division of Pulmonary and Critical Care Medicine, San Francisco General Hospital, University of California, San Francisco,California1; Curry International Tuberculosis Center, University of California, San Francisco, California2;
Department of Epidemiology, Biostatistics & Occupational Health, McGill University, Montreal, Quebec, Canada3; and HIV/AIDS Division, San Francisco General Hospital,
University of California, San Francisco, California4
Received 2 February 2010/Returned for modification 5 April 2010/Accepted 17 April 2010
Bleach digestion of sputum prior to smear preparation has been reported to increase the yield of microscopy for diagnosing pulmonary tuberculosis, even in high-HIV-prevalence settings. To determine the diagnostic accuracy of bleach microscopy, we updated a systematic review published in 2006 and applied the Grading of Recommendations Assessment, Development, and Evaluation framework to rate the overall quality of the evidence. We searched multiple databases (as of January 2009) for primary studies in all languages comparing bleach and direct microscopy. We assessed study quality using a validated tool and heterogeneity by standard methods. We used hierarchical summary receiver operating characteristic (HSROC) analysis to calculate summary estimates of diagnostic accuracy and random-effects meta-analysis to pool sensitivity and specificity differences. Of 14 studies (11 papers) included, 9 evaluated bleach centrifugation and 5 evaluated bleach sedimentation. Overall, examination of bleach-processed versus direct smears led to small increases in
sensitivity (for bleach centrifugation, 6% [95% confidence interval {CI}ⴝ3 to 10%, Pⴝ0.001]; for bleach
sedimentation, 9% [95% CIⴝ4 to 14%,Pⴝ0.001]) and small decreases in specificity (for bleach
centrifu-gation,ⴚ3% [95% CIⴝ ⴚ4% toⴚ1%,Pⴝ0.004]; for bleach sedimentation,ⴚ2% [95% CIⴝ ⴚ5% to 0%,Pⴝ
0.05]). Similarly, analysis of HSROC curves suggested little or no improvement in diagnostic accuracy. The quality of evidence was rated very low for both bleach centrifugation and bleach sedimentation. This updated systematic review suggests that the benefits of bleach processing are less than those described previously. Further research should focus on alternative approaches to optimizing smear microscopy, such as light-emitting diode fluorescence microscopy and same-day sputum collection strategies.
Sputum smear microscopy is a century-old test but remains the primary tool for diagnosing tuberculosis (TB) in low-in-come countries. Laboratories typically prepare Ziehl-Neelsen-stained smears from unconcentrated sputum (direct smears). Direct smear microscopy is inexpensive, rapid, and highly spe-cific in settings where tuberculosis is endemic. However, direct smear microscopy has poor sensitivity (range, 20 to 80%), particularly in HIV-coinfected patients (24). Processing of spu-tum by chemical and/or physical methods is commonly used in middle- and high-income countries to increase the diagnostic sensitivity. Although such processing methods usually require expensive chemicals and/or equipment, the Stop TB Partner-ship Retooling Task Force identified bleach sedimentation as one of three promising approaches to improving the sensitivity of sputum smear microscopy in high-burden countries (29).
Bleach (sodium hypochlorite) is an ideal chemical process-ing agent for use in low-income countries. It is widely available and inexpensive, and its disinfectant properties could improve infection control in laboratories lacking adequate biosafety facilities (3). Bleach has been reported to increase the sensi-tivity of smear microscopy primarily through digestion of the
mucus and debris in sputum, resulting in a clearer microscopy field (4). A 2006 systematic review found moderate evidence supporting the efficacy of bleach processing followed by cen-trifugation (the sensitivity was increased 13% [95% confidence interval {CI},⫺1 to 26%] compared to the results of direct microscopy) and limited evidence supporting the efficacy of bleach processing followed by sedimentation (24).
Since the publication of that review, the evidence base has grown and approaches to the meta-analysis of diagnostic tests have evolved. In the updated review presented here, we em-ployed state-of-the-art methods to summarize the literature comparing the diagnostic accuracy of smear microscopy per-formed after sputum was processed with bleach (followed by either sedimentation or centrifugation) with the accuracy of direct smear microscopy among patients being evaluated for pulmonary tuberculosis. We used the Grading of Recommen-dations Assessment, Development, and Evaluation (GRADE) (23) framework adopted by the World Health Organization (WHO) to determine the overall quality of the evidence and discuss the advantages and challenges of applying the GRADE approach to the evaluation of diagnostic tests.
MATERIALS AND METHODS
We followed standard guidelines and methods for systematic reviews and meta-analyses of diagnostic tests (8, 12, 16, 20).
Search methods.To update the prior systematic review which had conducted literature searches in 2005 (24), we searched the following electronic databases for primary studies in all languages: PubMed, EMBASE, Biosis, and Web of
* Corresponding author. Mailing address: San Francisco General Hospital, University of California, San Francisco, 1001 Potrero Ave-nue, Room 5K1, San Francisco, CA 94110. Phone: (415) 206-5489. Fax: (415) 695-1551. E-mail: [email protected].
䌤Published ahead of print on 26 April 2010.
2433
on May 16, 2020 by guest
http://jcm.asm.org/
Science (2005 through 7 June 2009). The search terms included “tuberculosis,” “Mycobacterium tuberculosis,” “acid-fast bacilli,” “sputum microscopy,” “bacte-riology,” “sensitivity and specificity,” “sputum concentration,” and “direct mi-croscopy.” We also searched the reference lists of the eligible papers and related reviews to identify additional studies and contacted researchers in the field to identify unpublished or ongoing studies.
Study selection and data collection.We included studies that compared smear microscopy following sputum processing by bleach to direct sputum smear mi-croscopy. We excluded the following types of studies: (i) studies using different staining and/or microscopy methods to compare bleach and direct smears, (ii) studies reporting insufficient data to determine diagnostic accuracy measures, (iii) abstracts and reviews, (iv) studies in which the microscopy stain was not reported, (v) studies with fewer than 10 participants, and (vi) studies that per-formed only bleach processing when the direct microscopy results were negative. We reviewed and extracted data from studies that did and that did not use mycobacterial culture as a reference standard for determining the accuracy of direct and bleach microscopy results. However, to minimize the risk of bias (26), we focus our analysis only on studies that used mycobacterial culture as a reference standard. The characteristics of the studies that did not use a reference standard are available from us upon request.
Two reviewers (A.C. and K.R.S.) independently screened the accumulated citations for relevance and then independently reviewed full-text articles using the prespecified eligibility criteria. The reviewers resolved disagreements about study selection by consensus. The same two reviewers then independently ex-tracted data using a standardized data extraction form. The interreviewer agree-ment on the microscopy results was 100%.
Assessment of study quality.We assessed study quality using a subset of six criteria from QUADAS, a validated tool for diagnostic studies, applicable to this review (26). Two reviewers (A.C. and K.R.S.) independently assessed the six QUADAS items for each study and resolved differences by consensus.
Data synthesis and meta-analysis.Since significant heterogeneity is expected among studies of diagnostic tests and summary estimates of diagnostic accuracy may not be meaningful when heterogeneity is present (17), we adopted the following overall approach. First, we decideda priorito separately synthesize data for bleach centrifugation and bleach sedimentation. Second, we used forest plots to visually assess heterogeneity. We also determined the amount of varia-tion attributable to heterogeneity (I-squared value) and statistically tested for heterogeneity (chi-square test). Third, we used a random-effects model to cal-culate pooled estimates of diagnostic accuracy but interpreted the pooled results cautiously when heterogeneity was present. Finally, when there were sufficient studies, we performed subgroup analyses to explore the sources of heterogeneity. We used two different approaches to calculate summary estimates of diagnos-tic accuracy. First, we derived pooled estimates of sensitivity and specificity for bleach and direct microscopy using hierarchical summary receiver operating characteristic (HSROC) analysis. (22) The HSROC approach jointly models sensitivity and specificity, weights studies according to the number of partici-pants, and accounts for unmeasured heterogeneity between studies by using random effects. Next, we performed a random-effects meta-analysis to pool the sensitivity and specificity differences between bleach and direct microscopy re-ported in each study. We decideda priorito perform subgroup analyses on the basis of the sedimentation time and centrifugation speed. We performed the HSROC and random-effects meta-analyses in the Stata IC/10.0 program (Stata Corporation, TX) with the commands “metandi” and “metan,” respectively. We obtained HSROC curves using the Review Manager (version 5.0) program.
Quality of evidence.GRADE defines the quality of evidence as the extent to which confidence in an estimate of the effect is adequate to support policy recommendations (14). In judgments about quality of evidence, the GRADE approach considers six factors: study design, study limitations, directness of evidence, inconsistency of results, precision of results, and publication bias (23). For diagnostic test evaluation, study designs considered to be high quality are randomized controlled trials, cross-sectional studies, and cohort studies that enroll patients with diagnostic uncertainty and use an appropriate reference standard. Study limitations summarize the risk of bias in diagnostic accuracy measures caused by poor-quality study design, as measured by QUADAS. Di-rectness refers to whether evidence of an impact on patient-important outcomes is assessed and to the generalizability of the results. As dictated by GRADE, we downgraded quality scores for deficiencies in the six factors by 1 point (minor deficiencies) or 2 points (major deficiencies). After scoring the six factors, we assigned an overall quality score: high (0 points subtracted), moderate (1 point subtracted), low (2 points subtracted), or very low (ⱖ3 points subtracted).
RESULTS
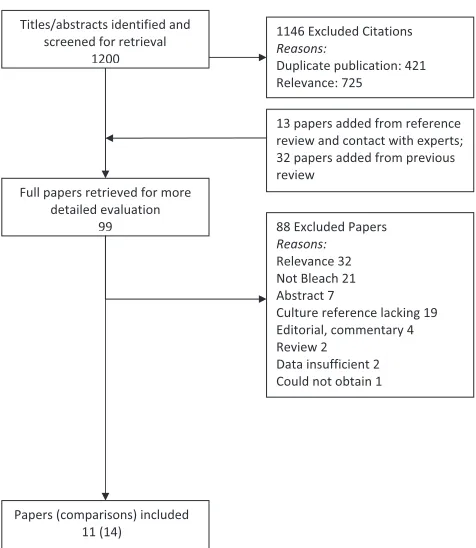
Search results. The initial search yielded 1,200 citations
(Fig. 1). After an independent, full-text review of 99 papers for study eligibility, 11 papers were included in the analysis (7 from the prior systematic review). Because some papers reported comparisons of more than one bleach processing method or of the same processing method with different staining techniques, there were 14 unique comparisons (referred to as studies) of bleach and direct microscopy.
Study characteristics. There was significant variation in
the study setting, study design, and classification of the smear results (Table 1). Nine (64%) studies were conducted in high-tuberculosis-burden countries, and three (21%) studies included patients with confirmed HIV infection. The concentration of bleach and the duration of exposure to bleach varied across the studies. In addition, the duration and speed of centrifugation and the duration of sedimenta-tion varied across the studies.
[image:2.585.302.540.65.339.2]Bleach centrifugation (nine studies) (1, 6, 7, 9, 13, 18, 19, 27).All studies had a cross-sectional design. Five (56%) studies performed bleach processing usingⱖ5% bleach, five (56%) studies performed centrifugation at high speed (ⱖ2,500 rpm or ⱖ2,000⫻g), and seven (78%) studies examined smears using light microscopy (Ziehl-Neelsen stain). Six (67%) studies re-ported that direct and bleach-processed smears were prepared FIG. 1. Flow of studies. Of 1,200 citations identified with the initial search, 1,146 were excluded after review of the titles and abstracts. Two reviewers (A.C. and K.R.S.) then independently reviewed the full text of the remaining 54 citations as well as 13 additional citations identified from references or contacting experts and 32 papers in-cluded in the prior review. The full-text review yielded 11 papers that met the eligibility criteria. Because some papers reported more than one comparison, there were 14 unique comparisons of direct and bleach microscopy included in the analysis.
on May 16, 2020 by guest
http://jcm.asm.org/
and interpreted in the same laboratory, and four (44%) studies reported that the laboratory in which microscopy was per-formed had an external quality assurance system in place. No study met all QUADAS criteria assessed (data not shown). Only three (33%) studies adequately described patient/speci-men selection. The majority of the studies satisfied all of the other QUADAS criteria.
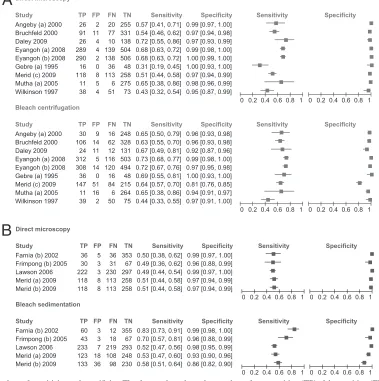
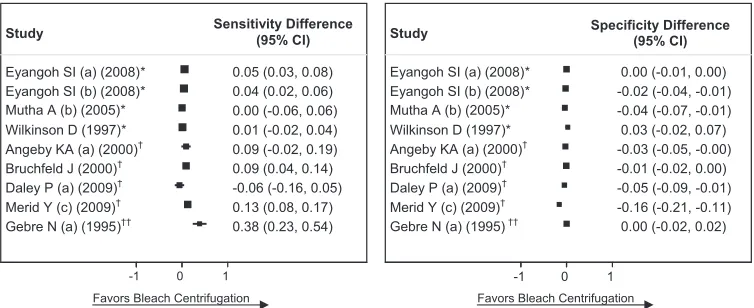
Sensitivity was inconsistent across the studies for bleach centrifugation (range, 44 to 73%; I-squared, 75%;P⬍0.001) and direct microscopy (range, 31 to 72%; I-squared, 87%;P⬍ 0.001) (Fig. 2A). Estimates of the sensitivity difference be-tween bleach centrifugation and direct microscopy were also inconsistent (range,⫺6 to⫹38%; I-squared, 82%;P⬍0.001) (Fig. 3A). The pooled sensitivity was higher for bleach centrif-ugation (65%; 95% CI, 59 to 71%) than for direct (56%; 95% CI, 49 to 63%) microscopy. The results were similar when the two studies that used fluorescence staining (study b of Eyangoh et al. [9] and the study of Daley et al. [7]) were excluded from the analysis (data not shown). When sensitivity differences were pooled across studies, bleach centrifugation microscopy was 6% (95% CI, 3 to 10%;P⫽ 0.001) more sensitive than direct microscopy.
Specificity was consistent for direct microscopy (range, 95 to 100%; I-squared, 46%; P ⫽ 0.06) but was more variable for bleach centrifugation microscopy (range, 81 to 100%; I-squared, 88%;P⬍0.001) (Fig. 2A). Estimates of the specificity difference between bleach centrifugation and direct micros-copy were inconsistent (range,⫺16 to⫹3%; I-squared, 87%; P ⬍ 0.001) (Fig. 3A). Pooled specificity was high for both bleach centrifugation microscopy (96%; 95% CI, 93 to 98%) and direct microscopy (98%; 95% CI, 97 to 99%). However,
there was a small but statistically significant decrease in spec-ificity with bleach centrifugation microscopy (⫺3%; 95% CI,
⫺4 to⫺1%;P⫽0.004). The HSROC curves for the two tests crossed and were close together, indicating that neither test was superior (Fig. 4A).
Sensitivity and specificity differences were similar when the analysis was restricted to HIV-infected patients. In data pooled from three studies, bleach centrifugation microscopy was 8% (95% CI, 5 to 11%;P⬍0.001) more sensitive and 1% (95% CI,⫺3 to⫹1%;P⫽0.24) less specific than direct microscopy. In subgroup analysis, estimates of the sensitivity difference were more consistent when the studies were stratified into low-speed (four studies; I-squared, 50%; P ⫽ 0.12) versus high-speed (four studies; I-squared, 70%;P⫽0.02) centrifu-gation groups. Compared to direct microscopy, bleach micros-copy was 3% (95% CI, 1 to 6%;P⫽0.02) more sensitive in studies using low-speed centrifugation and 7% (95% CI, 1 to 14%;P ⫽ 0.002) more sensitive in studies using high-speed centrifugation. However, specificity was significantly decreased with high-speed centrifugation (⫺6%; 95% CI,⫺11 to⫺1%; 0.02) but not with low-speed centrifugation (⫺1%; 95% CI,⫺3 to⫹1%;P⫽0.18).
Bleach sedimentation (five studies) (10, 11, 15, 18). All
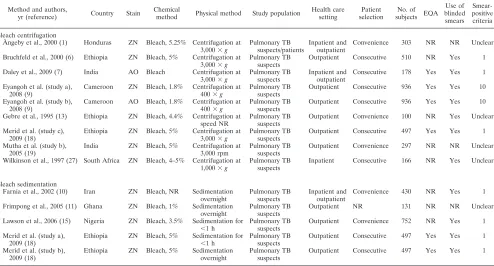
[image:3.585.47.541.82.348.2]studies had a cross-sectional design. Two (40%) studies per-formed bleach processing using ⱖ5% bleach, three (60%) studies performed overnight sedimentation, and all studies ex-amined smears using light microscopy (Ziehl-Neelsen stain). All studies reported that direct and processed smears were prepared and interpreted in the same laboratory. Two (40%) studies reported that the laboratory in which microscopy was performed had an external quality assurance system in place. TABLE 1. Characteristics of included studies with culture as the reference standard
Method and authors,
yr (reference) Country Stain
Chemical
method Physical method Study population
Health care setting Patient selection No. of subjects EQA Use of blinded smears Smear-positive criteria Bleach centrifugation
A¨ ngeby et al., 2000 (1) Honduras ZN Bleach, 5.25% Centrifugation at 3,000⫻g
Pulmonary TB suspects/patients
Inpatient and outpatient
Convenience 303 NR NR Unclear
Bruchfeld et al., 2000 (6) Ethiopia ZN Bleach, 5% Centrifugation at 3,000⫻g
Pulmonary TB suspects
Outpatient Consecutive 510 NR Yes 1
Daley et al., 2009 (7) India AO Bleach Centrifugation at 3,000⫻g
Pulmonary TB suspects
Inpatient and outpatient
Consecutive 178 Yes Yes 1
Eyangoh et al. (study a), 2008 (9)
Cameroon ZN Bleach, 1.8% Centrifugation at 400⫻g
Pulmonary TB suspects
Outpatient Consecutive 936 Yes Yes 10
Eyangoh et al. (study b), 2008 (9)
Cameroon AO Bleach, 1.8% Centrifugation at 400⫻g
Pulmonary TB suspects
Outpatient Consecutive 936 Yes Yes 10
Gebre et al., 1995 (13) Ethiopia ZN Bleach, 4.4% Centrifugation at speed NR
Pulmonary TB suspects
Outpatient Convenience 100 NR Yes Unclear
Merid et al. (study c), 2009 (18)
Ethiopia ZN Bleach, 5% Centrifugation at 3,000⫻g
Pulmonary TB suspects
Outpatient Consecutive 497 Yes Yes 1
Mutha et al. (study b), 2005 (19)
India ZN Bleach, 5% Centrifugation at 3,000 rpm
Pulmonary TB suspects
Outpatient Convenience 297 NR NR Unclear
Wilkinson et al., 1997 (27) South Africa ZN Bleach, 4–5% Centrifugation at 1,000⫻g
Pulmonary TB suspects
Inpatient Consecutive 166 NR Yes Unclear
Bleach sedimentation
Farnia et al., 2002 (10) Iran ZN Bleach, NR Sedimentation overnight
Pulmonary TB suspects
Inpatient and outpatient
Convenience 430 NR Yes 1
Frimpong et al., 2005 (11) Ghana ZN Bleach, 1% Sedimentation overnight
Pulmonary TB suspects
Outpatient NR 131 NR NR Unclear
Lawson et al., 2006 (15) Nigeria ZN Bleach, 3.5% Sedimentation for ⬍1 h
Pulmonary TB suspects
Outpatient Convenience 752 NR Yes 1
Merid et al. (study a), 2009 (18)
Ethiopia ZN Bleach, 5% Sedimentation for ⬍1 h
Pulmonary TB suspects
Outpatient Consecutive 497 Yes Yes 1
Merid et al. (study b), 2009 (18)
Ethiopia ZN Bleach, 5% Sedimentation overnight
Pulmonary TB suspects
Outpatient Consecutive 497 Yes Yes 1
Abbreviations: AO, auramine-O; EQA, external quality assessment; NR, not reported; TB, tuberculosis; ZN, Ziehl-Neelsen.
on May 16, 2020 by guest
http://jcm.asm.org/
Three (60%) studies met all QUADAS criteria (data not shown) (14, 17). Of the remaining two studies, one did not enroll ambulatory TB suspects, neither adequately described patient selection, and one did not report whether the micros-copy results were interpreted in a blinded fashion.
Sensitivity was consistent across the studies for direct mi-croscopy (range, 49 to 51%; I-squared, 0%;P⫽0.99) but not for bleach sedimentation microscopy (range, 52 to 83%; I-squared, 90%;P⬍0.001) (Fig. 2B). Estimates of the sensitivity difference between bleach sedimentation and direct micros-copy were inconsistent (range, 2 to 33%; I-squared, 89%;P⬍ 0.001) (Fig. 3B). The pooled sensitivity was higher for bleach sedimentation microscopy (63%; 95% CI, 51 to 74%) than for direct microscopy (50%; 95% CI, 47 to 53%). When sensitivity differences were pooled across studies, bleach sedimentation microscopy was 9% (95% CI, 4 to 14%; P ⫽ 0.001) more sensitive than direct microscopy.
Specificity was consistent for direct microscopy (range, 96 to 99%; I-squared, 8%; P ⫽ 0.36) but was more variable for
bleach sedimentation microscopy (range, 86 to 99%; I-squared, 90%;P⬍0.001). Estimates of the specificity differ-ence between bleach sedimentation and direct microscopy were inconsistent (range,⫺11 to⫹1%; I-squared, 88%;P⬍ 0.001) (Fig. 3B). Pooled specificity was high for both bleach sedimentation microscopy (96%; 95% CI, 91 to 99%) and direct microscopy (98%; 95% CI, 97 to 99%). However, there was a small decrease in specificity with bleach sedimentation microscopy (⫺2%; 95% CI,⫺5 to 0%;P⫽0.05), though this difference was not statistically significant. The HSROC curve for bleach sedimentation microscopy was closer to the upper left corner of the plot and entirely above the curve for direct microscopy, suggesting that bleach sedimentation microscopy has superior diagnostic accuracy (Fig. 4B).
[image:4.585.104.483.77.458.2]In subgroup analysis, estimates of the sensitivity difference were consistent among studies using short-term sedimentation (two studies; I-squared, 0%;P⫽0.85) but not overnight sed-imentation (three studies; I-squared, 90%;P⬍ 0.001). Com-pared to direct microscopy, bleach microscopy was 2% (95% FIG. 2. Forest plots of sensitivity and specificity. The forest plots show the number of true-positive (TP), false-positive (FP), false-negative (FN), and true-negative (TN) microscopy results for all studies comparing direct microscopy and bleach centrifugation (A) or direct microscopy and bleach sedimentation (B). For each study, sensitivity and specificity were calculated using mycobacterial culture as a reference standard. The values in brackets in the sensitivity and specificity columns are 95% CIs.
on May 16, 2020 by guest
http://jcm.asm.org/
CI, 1 to 4%;P⬍0.001) more sensitive in studies using short-term sedimentation and 20% (95% CI, 3 to 37%;P ⬍0.02) more sensitive in studies using overnight sedimentation. There was no significant difference in specificity with either short-term sedimentation (⫺2%; 95% CI,⫺5 to 0%; P⫽0.05) or overnight sedimentation (⫺3%; 95% CI,⫺6 to⫹ 1%; P ⫽ 0.17).
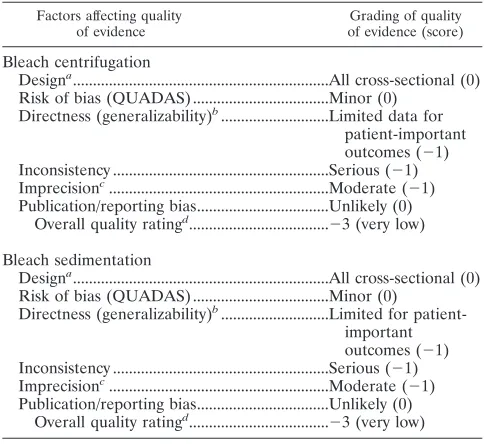
GRADE quality of evidence.For both bleach centrifugation
and bleach sedimentation, the quality of the evidence was downgraded for directness (data were lacking on patient-im-portant outcomes), inconsistency of the results across studies, and a lack of precision in summary estimates of diagnostic accuracy (Table 2). This resulted in an overall GRADE quality rating of “very low” for both bleach processing methods.
DISCUSSION
Enhanced smear microscopy is likely the only diagnostic test or strategy that can be widely implemented in the short term to improve tuberculosis case finding. Several approaches have
been proposed to optimize smear microscopy, including fluo-rescence microscopy, same-day sputum collection strategies, and sputum processing methods, such as bleach processing (29). In this systematic review, we found that examination of bleach-processed smears led to small (6 to 9%) increases in the sensitivity of microscopy compared to that by examination of direct smears. However, we also found that bleach processing resulted in small decreases (1 to 3%) in specificity, though this finding was statistically significant only for bleach centrifuga-tion. Analysis of HSROC curves and pooled likelihood ratios (data not shown) also suggested no or little improvement in diagnostic accuracy with either bleach centrifugation or bleach sedimentation. Taking into account these and other factors, the quality of the evidence supporting bleach microscopy was rated very low. Overall, this systematic review suggests that bleach processing is unlikely to have a large impact on tuber-culosis case detection in high-burden countries.
[image:5.585.108.485.86.240.2]Bleach processing has been reported to facilitate identifica-tion of bacilli by providing a clearer microscopy field through digestion of mucus and debris and concentrating bacilli FIG. 3. Forest plots of sensitivity and specificity differences. The forest plots show the difference (bleach microscopy minus direct microscopy) in sensitivity and specificity calculated for each study comparing direct microscopy and bleach centrifugation (A) or direct microscopy and bleach sedimentation (B).
on May 16, 2020 by guest
http://jcm.asm.org/
through centrifugation or sedimentation. However, digestion and concentration of debris may also increase the number of false-positive results (7). Consistent with these observations, we found that bleach centrifugation microscopy was more sen-sitive than direct microscopy. However, in comparison to the findings in the previous review, the magnitude of the increase in sensitivity was smaller (6%; 95% CI, 3 to 10%). The 95% CI
for the sensitivity difference excludes a more than 10% in-crease in sensitivity with bleach centrifugation over direct mi-croscopy. Possible explanations for the smaller sensitivity dif-ference in our review include (i) the inclusion of four additional studies published since the prior review, (ii) the use of random-effects rather than fixed-effects modeling, and (iii) the pooling of sensitivity differences using meta-analytic meth-ods rather than simple weighted averages.
The results were more positive for bleach sedimentation, particularly when overnight sedimentation was performed. Bleach processing followed by overnight sedimentation was associated with the largest increase in sensitivity (20%) over that of direct microscopy, but the 95% CIs were wide (3 to 37%). Similarly, a recent study of a standardized bleach method reported a 15% increase in the smear-positive propor-tion obtained with overnight bleach sedimentapropor-tion compared to that obtained with direct microscopy (4). However, speci-ficity was not measured since the study design did not include mycobacterial culture as a reference standard. A multicenter demonstration project of this standardized bleach sedimenta-tion method is ongoing.
The major limitation of this review was the considerable heterogeneity in diagnostic accuracy estimates for both direct and bleach microscopy. However, the similar findings obtained across multiple different analyses lend support to our overall conclusions. In addition to inconsistent results across studies, we identified serious limitations in study design. To improve the quality of future studies, investigators should follow the general principles outlined by the Special Programme for the Research and Training in Tropical Diseases (TDR) Diagnos-tics Evaluation Expert Panel (2) when designing studies and the Standards for the Reporting of Diagnostic accuracy studies (STARD) checklist (5) when reporting studies. However, guidelines specific to TB diagnostic evaluations are also needed. Lastly, we did not evaluate for publication bias. To our knowledge, techniques to evaluate publication bias have not been adequately evaluated for diagnostic studies (25).
[image:6.585.135.451.68.240.2]In September 2009, the WHO applied the GRADE ap-FIG. 4. HSROC curves. Pooled sensitivity (black dots) and specificity (gray dots) estimates were calculated using HSROC analysis for all studies comparing direct microscopy and bleach centrifugation (A) or direct microscopy and bleach sedimentation (B). (A) The HSROC curves for the two tests were nearly overlapping, indicating that neither test was superior. (B) The HSROC curve for bleach sedimentation microscopy was entirely above the curve for direct microscopy, suggesting that it has superior diagnostic accuracy. Of note, any comparison of tests between the two graphs is not valid.
TABLE 2. GRADE evidence profiles
Factors affecting quality of evidence
Grading of quality of evidence (score)
Bleach centrifugation
Designa...All cross-sectional (0)
Risk of bias (QUADAS) ...Minor (0) Directness (generalizability)b...Limited data for
patient-important outcomes (⫺1) Inconsistency ...Serious (⫺1) Imprecisionc...Moderate (⫺1)
Publication/reporting bias...Unlikely (0) Overall quality ratingd...⫺3 (very low)
Bleach sedimentation
Designa...All cross-sectional (0)
Risk of bias (QUADAS) ...Minor (0)
Directness (generalizability)b...Limited for
patient-important outcomes (⫺1) Inconsistency ...Serious (⫺1) Imprecisionc...Moderate (⫺1)
Publication/reporting bias...Unlikely (0) Overall quality ratingd...⫺3 (very low)
a
Only studies that used culture as a reference standard were included. b
Quality of evidence was downgraded for insufficient evidence on patient-important outcomes. Only three studies included patients with confirmed HIV infection. Several studies were carried out in high-HIV-prevalence settings, al-though limited data on the HIV status of individual patients were available.
c
Wide confidence intervals, especially for sensitivity estimates, were observed for both bleach-processed and direct microscopy.
d
The overall quality rating was assessed by summing the number of points subtracted (shown in parentheses) for each of the six factors affecting the quality of evidence: 0 points, high quality; 1 point, moderate quality; 2 points, low quality;ⱖ3 points, very low quality.
on May 16, 2020 by guest
http://jcm.asm.org/
[image:6.585.42.284.416.638.2]proach to TB diagnostics for the first time to develop guide-lines for improving sputum smear microscopy, and the results of this systematic review were considered by an expert group (28). Our experience from this meeting prompts several obser-vations. First, GRADE offers a systematic, objective, and transparent process and requires the explicit use of systematic reviews and evidence summaries. This framework makes it less likely for discussions to be dominated by expert opinions. Sec-ond, GRADE forces policy makers to give attention to patient-important outcomes. In the GRADE framework, well-de-signed studies of diagnostic accuracy can provide high-quality evidence on test accuracy. However, these studies may provide only low-quality evidence for guideline development because of uncertainty about the link between test accuracy and patient impact. It follows that studies providing estimates of accuracy alone, as seen in this review, can never achieve a rating of “high-quality” evidence in the GRADE system, a particular challenge for diagnostic evaluations. Lastly, the lack of famil-iarity of systematic reviewers, policy makers, and TB experts with the GRADE process is a major challenge to its imple-mentation (21).
Conclusions and recommendations. In summary, our
up-dated systematic review suggests that the benefits of bleach processing are less than those previously described. A WHO expert group that considered these findings concluded that bleach microscopy should not be recommended at this point. Further efforts should focus on alternative approaches to op-timizing smear microscopy, such as light-emitting diode fluo-rescence microscopy and same-day sputum collection strate-gies. The GRADE approach is relatively new in its application to diagnostic testing, and increased familiarity with the ap-proach is needed to facilitate effective policy development.
ACKNOWLEDGMENTS
We thank Mariska Leeflang, Eric Vittinghoff, and Charles Mc-Culloch for their assistance with statistical analysis and Karin Weyer for convening the WHO expert group meeting on approaches to im-prove sputum smear microscopy for tuberculosis diagnosis.
We have no conflicts of interest to declare.
This work was supported by funding from the World Health Orga-nization and the National Institutes of Health.
REFERENCES
1.Angeby, K. A., C. Alvarado-Galvez, L. Pineda-Garcia, and S. E. Hoffner.
2000. Improved sputum microscopy for a more sensitive diagnosis of pul-monary tuberculosis. Int. J. Tuber. Lung Dis.4:684–687.
2.Banoo, S., D. Bell, P. Bossuyt, A. Herring, D. Mabey, F. Poole, P. G. Smith, N. Sriram, C. Wongsrichanalai, R. Linke, R. O’Brien, M. Perkins, J. Cun-ningham, P. Matsoso, C. M. Nathanson, P. Olliaro, R. W. Peeling, and A. Ramsay.2006. Evaluation of diagnostic tests for infectious diseases: general principles. Nat. Rev. Microbiol.4:S20–S32.
3.Best, M., S. A. Sattar, V. S. Springthorpe, and M. E. Kennedy.1990. Effi-cacies of selected disinfectants against Mycobacterium tuberculosis. J. Clin. Microbiol.28:2234–2239.
4.Bonnet, M., A. Ramsay, W. Githui, L. Gagnidze, F. Varaine, and P. J. Guerin.2008. Bleach sedimentation: an opportunity to optimize smear mi-croscopy for tuberculosis diagnosis in settings of high prevalence of HIV. Clin. Infect. Dis.46:1710–1716.
5.Bossuyt, P. M., J. B. Reitsma, D. E. Bruns, C. A. Gatsonis, P. P. Glasziou, L. M. Irwig, J. G. Lijmer, D. Moher, D. Rennie, and H. C. de Vet.2003. Towards complete and accurate reporting of studies of diagnostic accuracy: the STARD initiative. Ann. Intern. Med.138:40–44.
6.Bruchfeld, J., G. Aderaye, I. B. Palme, B. Bjorvatn, G. Kallenius, and L.
Lindquist.2000. Sputum concentration improves diagnosis of tuberculosis in a setting with a high prevalence of HIV. Trans. R. Soc. Trop. Med. Hyg.
94:677–680.
7.Daley, P., J. S. Michael, S. Kalaiselvan, A. Latha, D. Mathai, K. R. John, and M. Pai.2009. A pilot study of short-duration sputum pretreatment proce-dures for optimizing smear microscopy for tuberculosis. PLoS One4:e5626. 8.Deville, W. L., F. Buntinx, L. M. Bouter, V. M. Montori, H. C. de Vet., D. A. van der Windt, and P. D. Bezemer.2002. Conducting systematic reviews of diagnostic studies: didactic guidelines. BMC Med. Res. Methodol.2:9. 9.Eyangoh, S. I., G. Torrea, M. C. Tejiokem, Y. Kamdem, F. F. Piam, J.
Noeske, and A. Van Deun.2008. HIV-related incremental yield of bleach sputum concentration and fluorescence technique for the microscopic de-tection of tuberculosis. Eur. J. Clin. Microbiol. Infect. Dis.27:849–855. 10.Farnia, P., F. Mohammadi, Z. Zarifi, D. J. Tabatabee, J. Ganavi, K.
Ghazi-saeedi, P. K. Farnia, M. Gheydi, M. Bahadori, M. R. Masjedi, and A. A. Velayati.2002. Improving sensitivity of direct microscopy for detection of acid-fast bacilli in sputum: use of chitin in mucus digestion. J. Clin. Micro-biol.40:508–511.
11.Frimpong, E. H., R. Adukpo, and K. Owusu-Darko.2005. Evaluation of two novel Ziehl-Neelsen methods for tuberculosis diagnosis. West Afr. J. Med.
24:316–320.
12.Gatsonis, C., and P. Paliwal.2006. Meta-analysis of diagnostic and screening test accuracy evaluations: methodologic primer. AJR Am. J. Roentgenol.
187:271–281.
13.Gebre, N., U. Karlsson, G. Jonsson, R. Macaden, A. Wolde, A. Assefa, and H. Miorner.1995. Improved microscopical diagnosis of pulmonary tubercu-losis in developing countries. Trans. R. Soc. Trop. Med. Hyg.89:191–193. 14.Guyatt, G. H., A. D. Oxman, R. Kunz, G. E. Vist, Y. Falck-Ytter, and H. J.
Schunemann.2008. What is “quality of evidence” and why is it important to clinicians? BMJ336:995–998.
15.Lawson, L., M. A. Yassin, A. Ramsay, I. Olajide, T. D. Thacher, P. D. Davies, S. B. Squire, and L. E. Cuevas.2006. Microbiological validation of smear microscopy after sputum digestion with bleach; a step closer to a one-stop diagnosis of pulmonary tuberculosis. Tuberculosis (Edinb.)86:34–40. 16.Leeflang, M. M., J. J. Deeks, C. Gatsonis, and P. M. Bossuyt.2008.
System-atic reviews of diagnostic test accuracy. Ann. Intern. Med.149:889–897. 17.Lijmer, J. G., P. M. Bossuyt, and S. H. Heisterkamp.2002. Exploring sources
of heterogeneity in systematic reviews of diagnostic tests. Stat. Med.21:
1525–1537.
18.Merid, Y., M. A. Yassin, L. Yamuah, R. Kumar, H. Engers, and A. Aseffa.
2009. Validation of bleach-treated smears for the diagnosis of pulmonary tuberculosis. Int. J. Tuber. Lung Dis.13:136–141.
19.Mutha, A., S. Tiwari, H. Khubnani, and S. Mall.2005. Application of bleach method to improve sputum smear microscopy for the diagnosis of pulmonary tuberculosis. Indian J. Pathol. Microbiol.48:513–517.
20.Pai, M., M. McCulloch, W. Enanoria, and J. M. Colford, Jr.2004. Systematic reviews of diagnostic test evaluations: what’s behind the scenes? ACP J. Club
141:A11–A13.
21.Pai, M., J. Minion, K. Steingart, and A. Ramsay.2010. New and improved tuberculosis diagnostics: evidence, policy, practice, and impact. Curr. Opin. Pulm. Med.16:271–284.
22.Rutter, C. M., and C. A. Gatsonis.2001. A hierarchical regression approach to meta-analysis of diagnostic test accuracy evaluations. Stat. Med.20:2865– 2884.
23.Schunemann, H. J., A. D. Oxman, J. Brozek, P. Glasziou, P. Bossuyt, S. Chang, P. Muti, R. Jaeschke, and G. H. Guyatt.2008. GRADE: assessing the quality of evidence for diagnostic recommendations. Evid. Based Med.13:
162–163.
24.Steingart, K. R., V. Ng, M. Henry, P. C. Hopewell, A. Ramsay, J. Cunning-ham, R. Urbanczik, M. D. Perkins, M. A. Aziz, and M. Pai.2006. Sputum processing methods to improve the sensitivity of smear microscopy for tu-berculosis: a systematic review. Lancet Infect. Dis.6:664–674.
25.Tatsioni, A., D. A. Zarin, N. Aronson, D. J. Samson, C. R. Flamm, C. Schmid, and J. Lau.2005. Challenges in systematic reviews of diagnostic technologies. Ann. Intern. Med.142:1048–1055.
26.Whiting, P., A. W. Rutjes, J. B. Reitsma, P. M. Bossuyt, and J. Kleijnen.
2003. The development of QUADAS: a tool for the quality assessment of studies of diagnostic accuracy included in systematic reviews. BMC Med. Res. Methodol.3:25.
27.Wilkinson, D., and A. W. Sturm.1997. Diagnosing tuberculosis in a resource-poor setting: the value of sputum concentration. Trans. R. Soc. Trop. Med. Hyg.91:420–421.
28.World Health Organization.2009. Expert group meeting—approaches to improve sputum smear microscopy for tuberculosis diagnosis. World Health Organization, Geneva, Switzerland.
29.World Health Organization.2008. New laboratory diagnostic tools for tu-berculosis control. Stop TB Partnership Retooling Task Force. WHO Press, Geneva, Switzerland.