Comparison of Commercial Extraction Systems and PCR Assays for
Quantification of Epstein-Barr Virus DNA Load in Whole Blood
Raphaële Germi,a,bJulien Lupo,a,bTouyana Semenova,aSylvie Larrat,a,bNelly Magnat,aLaurence Grossi,bJean-Marie Seigneurin,a,b and Patrice Moranda,b
Unit of Virus Host Cell Interactions UMI 3265 UJF-EMBL-CNRS, Grenoble, France,a
and Laboratoire de Virologie, Département des Agents Infectieux, Pôle de Biologie, Centre Hospitalier Universitaire de Grenoble, Grenoble, Franceb
The automation of DNA extraction and the use of commercial quantitative real-time PCR assays could help obtain more reliable results for the quantification of Epstein-Barr virus DNA loads (EBV VL). This study compared two automated extraction plat-forms and two commercial PCRs for measurement of EBV VL in 10 EBV specimens from Quality Control for Molecular Diag-nostics (QCMD) and in 200 whole-blood (WB) specimens from transplant (nⴝ137) and nontransplant (nⴝ63) patients. The WB specimens were extracted using the QIAcube or MagNA Pure instrument; VL were quantified with the EBV R-gene quantifi-cation kit (Argene) or the artus EBV RG PCR kit (Qiagen) on the Rotor-Gene 6000 real-time analyzer; and the results were com-pared with those of a laboratory-developed PCR. DNA was extracted from the QCMD specimens by use of the QIAamp DNA minikit and was quantified by the three PCR assays. The extraction platforms and the PCR assays showed good correlation (R,>0.9;P,<0.0001), but as many as 10% discordant results were observed, mostly for low viral loads (<3 log10copies/ml), and standard deviations reached as high as 0.49 log10copy/ml. In WB but not in QCMD samples, Argene PCR tended to give higher VL values than artus PCR or the laboratory-developed PCR (mean difference for the 200 WB VL,ⴚ0.42 orⴚ0.36, respectively). In conclusion, the two automated extraction platforms and the two PCRs provided reliable and comparable VL results, but dif-ferences greater than 0.5 log10copy/ml remained between the two commercial PCRs after common DNA extraction.
P
rimary Epstein-Barr virus (EBV) infection is the cause of thevast majority of cases of infectious mononucleosis, and the subsequent lifelong persistence of EBV in the infected host, al-though mostly asymptomatic, can lead to the development of sev-eral lymphoid and epithelial cancers in immunosuppressed and immunocompetent individuals (13, 18).
With the outstanding development of real-time quantitative PCR, measurement of EBV DNA loads during these EBV-associ-ated diseases has been largely implemented in clinical practice (6, 11). The monitoring of EBV DNA loads in blood is required for transplant recipients at risk of posttransplantation lymphoprolif-erative disorders, and EBV DNA loads could also be a surrogate marker for the adjustment of the immunosuppressive regimen in these patients (7, 9). EBV DNA loads measured in plasma also appear to be a useful biomarker for the management of EBV-associated undifferentiated nasopharyngeal carcinoma (4). Al-though less clearly demonstrated, measurement of EBV DNA loads could also be helpful in other clinical situations, such as severe or atypical infectious mononucleosis and other EBV-asso-ciated malignancies in immunosuppressed or immunocompetent patients (6). Besides the debates on the clinical utility and the clinically relevant EBV DNA levels in various EBV-associated dis-eases, technical standardization of EBV loads has not yet been achieved (6, 7). There is still great variability among the different PCR methods at all steps of the analysis, resulting in great variabil-ity in interlaboratory results (1, 8, 16). This heterogenevariabil-ity is a barrier to the optimal use of quantitative PCR assays. The auto-mation of nucleic acid extraction procedures and the use of com-mercialized PCR assays could decrease this heterogeneity and im-prove the agreement and the clinical utility of EBV load measurements in routine settings (5, 15, 17).
The aims of this study were (i) to compare two automated platforms for the extraction of EBV DNA from whole-blood
sam-ples, the MagNA Pure LC system (Roche Applied Science, Meylan, France) (referred to below as MagNA) and the QIAcube instru-ment (Qiagen, Hilden, Germany) (referred to below as QIAcube), and (ii) to compare the results for EBV DNA loads in whole-blood samples, after DNA extraction with the QIAcube, obtained with two commercially available real-time PCR assays: the EBV R-gene quantification kit (provided free by Argene, Verniolle, France) (referred to below as the Argene PCR) and the artus EBV RG PCR kit (provided free by Qiagen, Hilden, Germany) (referred to below as the Artus PCR). The results obtained with the two commer-cially available PCR assays were also compared with those from a laboratory-developed EBV real-time quantitative PCR assay (Lab PCR). Additionally, the three PCR assays were tested with the 2009 proficiency panel from Quality Control for Molecular Diag-nostics (QCMD).
MATERIALS AND METHODS
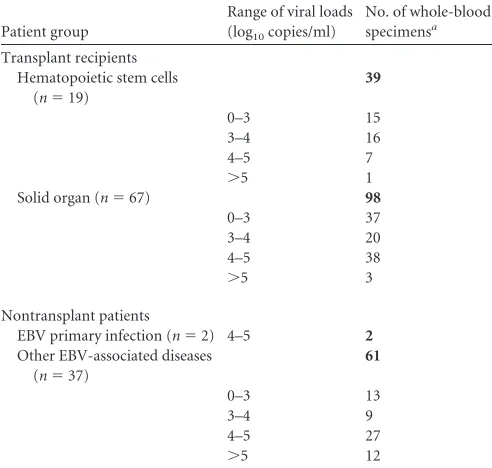
Clinical samples.One hundred twenty-five patients sent to our institu-tion for routine EBV load testing (86 transplant recipients with routine monitoring of EBV loads and 39 nontransplant patients with suspicion of an EBV-associated disease) were included in the study and gave 200 spec-imens of whole blood collected in EDTA tubes (Table 1). Eighty of these 200 samples were collected sequentially from eight patients (five trans-plant recipients, one patient with HIV infection, one patient with hypo-gammaglobulinemia, and one patient with EBV-associated encephalitis).
Received7 September 2011Returned for modification9 October 2011 Accepted28 December 2011
Published ahead of print11 January 2012
Address correspondence to Raphaële Germi, [email protected].
Copyright © 2012, American Society for Microbiology. All Rights Reserved.
doi:10.1128/JCM.05593-11
on May 16, 2020 by guest
http://jcm.asm.org/
The range of EBV loads assessed by the laboratory-developed PCR (see below) is presented in Table 1. All samples were collected between Sep-tember and November 2008 and were stored at⫺80°C until use.
Study design.First, all whole-blood specimens were extracted with the MagNA system or the QIAcube instrument and were amplified using the laboratory-developed PCR assay on the LightCycler platform, version 2.0, in order to compare the performances of the two extraction robots. DNA was isolated according to the manufacturer’s instructions from 200l of whole blood with the DNA Isolation kit (Roche Applied Science, Meylan, France) for the MagNA instrument and with the QIAamp DNA Blood minikit (Qiagen, Hilden, Germany) for the QIAcube robot. The extracted DNA was eluted with 100l of elution buffer, aliquoted, and frozen at ⫺80°C before use.
Second, the performances of the three EBV PCR assays were com-pared using aliquoted DNA extracts obtained with the QIAcube. The laboratory-developed PCR and the Argene PCR assays, described else-where (3, 5), targeted theBXLF1thymidine kinase gene and were run on a LightCycler platform (version 2.0) and the Rotor-Gene 6000 plat-form, respectively. The Artus PCR targeted theEBNA1gene and was run on the Rotor-Gene 6000 platform. All three PCR assays were mul-tiplex PCRs for the simultaneous amplification of an internal control used to verify the efficacy of the extraction and the absence of PCR inhibitors in the amplification process. The characteristics of each PCR are summarized in Table 2.
In addition to the whole-blood samples, 10 lyophilized samples from the QCMD 2009 EBV proficiency panel were extracted manually (without the QIAcube robot) using the QIAamp DNA Blood minikit (Qiagen) and were quantified by the three PCR assays, as described above. The QCMD samples contain a lyophilized EBV strain quantified using electron mi-croscopy. All QCMD samples were reconstituted using sterile water (nu-cleic acid amplification testing [NAT] quality).
Statistical analysis.The EBV load measurements were expressed as log10 copies per milliliter. The correlation coefficients were calculated using a Spearman test, and the homogeneity of the variances was analyzed by the Fisher-Snedecor test (StatView, version 5.0; SAS Institute Inc., Cary, NC). The comparison of the viral loads obtained by the different technologies was represented on a Bland-Altman graph. Only viral loads positive by both assays compared were represented on the Bland-Altman graphs. Results could be defined as discordant either because the results of the Bland-Altman analysis fell outside the interval of the average⫾1.96 standard deviations (SD) (quantitatively discordant results) or because one EBV load measurement was positive by one method and negative by another (qualitatively discordant results).
RESULTS
Comparison of automated extractions. The analysis of EBV loads obtained after the two extraction procedures showed a linear
correlation between the log10EBV load and a Spearman
correla-tion coefficient of 0.958 (P,⬍0.0001). Among the 200 samples,
159 were positive by both automated extraction technologies, 21 were negative by both, and 20 were qualitatively discordant. Five
samples with low EBV loads (⬍3 log10copies/ml) by QIAcube–
Lab PCR were negative by MagNA–Lab PCR, and 15 samples pos-itive by MagNA–Lab PCR (all but one with viral DNA loads [VL]
of ⬍3 log10 copies/ml) were negative by QIAcube–Lab PCR.
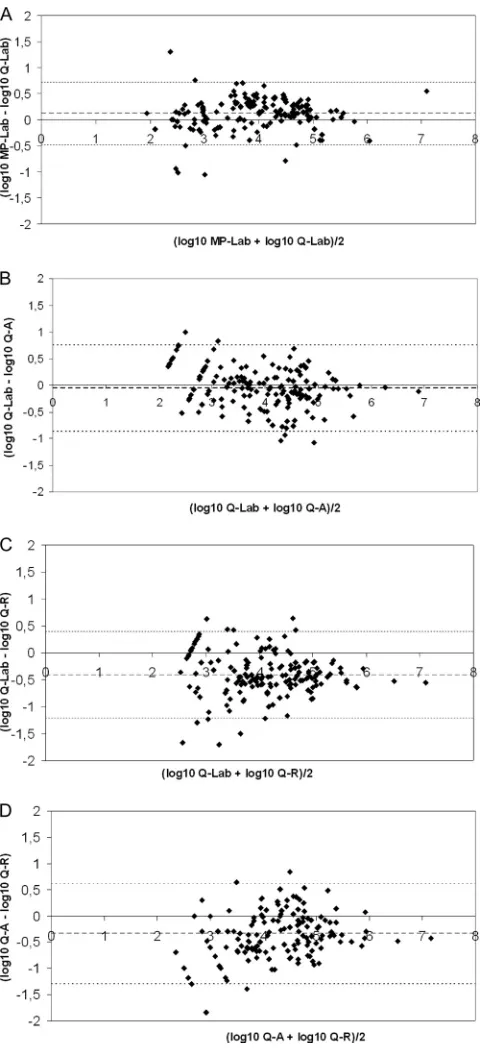
Bland-Altman analysis of the 159 samples positive by both tech-nologies showed that more than 95% of the samples were within
the “mean⫾1.96 SD” (Fig. 1A). The mean difference between the
EBV loads (log10copies/ml) obtained by the two methods was
0.11, and the standard deviation was 0.31 (Table 3). The
differ-ences between viral loads were above 0.5 log10for 7.6% of the
samples and above 1 log10for 1.9% of the samples.
No PCR inhibition occurred during these experiments.
Comparison of real-time PCRs after QIAcube extraction.
The Spearman correlation coefficients between the log10 EBV
loads obtained by the three different PCRs ranged from 0.908 to
0.942 (P⬍0.0001).
[image:2.585.40.286.79.313.2]Eleven qualitatively discordant results were obtained between the laboratory-developed PCR and the Artus PCR. One sample was positive by the Artus PCR and negative by the laboratory-developed PCR, and 10 samples were negative by the Artus PCR and positive by the laboratory-developed PCR. Bland-Altman analysis of the 154 samples positive by both assays showed that
TABLE 1Whole-blood sample distribution
Patient group
Range of viral loads (log10copies/ml)
No. of whole-blood specimensa
Transplant recipients Hematopoietic stem cells
(n⫽19)
39
0–3 15
3–4 16
4–5 7
⬎5 1
Solid organ (n⫽67) 98
0–3 37
3–4 20
4–5 38
⬎5 3
Nontransplant patients
EBV primary infection (n⫽2) 4–5 2
Other EBV-associated diseases (n⫽37)
61
0–3 13
3–4 9
4–5 27
⬎5 12
a
The total for each patient group is given in boldface.
TABLE 2Characteristics of real-time PCRs
Characteristic Argene PCR Artus PCR Laboratory-developed PCR
Target BXLF1 EBNA1 BXLF1
Probe technology Hydrolysis Hydrolysis Hybridization
PCR cycle steps 2 (95°C, 60°C) 3 (95°C, 55°C, 72°C) 3 (95°C, 58°C, 72°C)
Final vol (l) in assay 25 50 20
Vol (l) of extracted DNA 10 20 10
No., type of quantification standards 4, plasmid 4, plasmid 5, Namalwa cells (2 EBV copies/cell)
Range of standard curve (copies/ml of whole blood) 5,000–5,000,000 25,000–25,000,000 500–5,000,000
Simultaneous amplification internal control Yes Yes Yes
on May 16, 2020 by guest
http://jcm.asm.org/
[image:2.585.43.537.624.724.2]3.9% of the results were outside the “mean⫾1.96 SD” interval
(Fig. 1B,). The most discordant results were measured at 5.69 log10
copies/ml and 3.42 log10copies/ml by the Artus PCR and the
lab-oratory-developed PCR, respectively. These results obtained from patient H are discussed below. The mean difference between EBV
loads (log10copies/ml) measured by Lab PCR and Artus PCR was
⫺0.06, and the standard deviation was 0.42 (Table 3). The
differ-ences were above 0.5 log10for 18.9% and above 1 log10for 1.95%
of the 154 samples positive by the two methods.
Among the 17 qualitatively discordant results between the lab-oratory-developed PCR and the Argene PCR, eight were negative by the Argene PCR and positive by the laboratory-developed PCR
(all were below 3 log10copies/ml). Nine samples were negative by
the laboratory-developed PCR and positive by the Argene PCR
(two were below 3 log10copies/ml, and seven were between 3 and
4 log10copies/ml). Bland-Altman analysis showed that 7.1% of the
156 results positive by the two methods were outside the “mean⫾
1.96 SD” interval (Fig. 1C). The VL obtained for patient H, by the laboratory-developed PCR and the Argene PCR, were not discor-dant. The mean difference observed between the Lab PCR and the
Argene PCR was⫺0.4, and the standard deviation was 0.41 (Table 3).
There were 18 qualitatively discordant results between the Ar-tus and Argene PCRs. Four were negative by the Argene PCR and
positive by the Artus PCR (all were below 3 log10copies/ml), and
14 were negative by the Artus PCR and positive by the Argene PCR
(five were below 3 log10copies/ml, and eight were quantified
be-tween 3 and 5 log10copies/ml). On the Bland-Altman graph, 6 of
the 151 samples positive by both assays (4%) were discordant (Fig. 1D). One of them corresponded to patient H. The mean difference
between the two methods was⫺0.34, and the standard deviation
was 0.49 (Table 3).
The viral load differences measured between the Argene PCR and the laboratory-developed PCR or the Artus PCR were above
0.5 log10for more than 40% of the samples positive by the two
methods (66/156 and 62/151, respectively). Fewer than 6% of the
samples showed a difference above 1 log10. In more than 92% of
the samples with a difference above 0.5 log10, Argene PCR gave a
higher viral load.
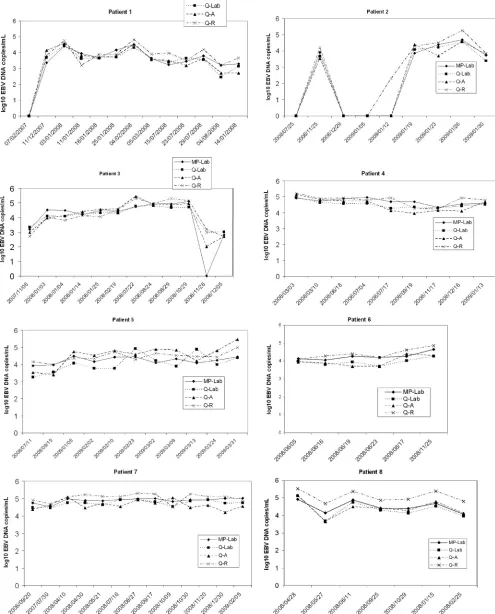
Follow-up of EBV VL in patients with various EBV-associ-ated pathologies.Figure 2 shows the longitudinal monitoring of EBV loads from eight patients (80 measurements, ranging from 6 to 13 samples/patient) by four methods: MagNA–laboratory-de-veloped PCR, QIAcube–laboratory-deMagNA–laboratory-de-veloped PCR, QIAcube–Ar-tus PCR, and QIAcube–Argene PCR. When the two extraction platforms were compared, the differences between viral loads
[image:3.585.43.286.65.591.2]FIG 1Bland-Altman analysis of EBV DNA loads positive by both technolo-gies. (A) Comparison of extraction robots. MagNA the plus the laboratory-developed PCR on a LightCycler instrument (MP-Lab) was compared with QIAcube plus the laboratory-developed PCR on a LightCycler instrument (Q-Lab). A total of 159 samples were used. (B) Comparison of Q-Lab with Q-A (QIAcube plus the artus EBV RG PCR kit on a Rotor-Gene instrument). A total of 154 samples were used. (C) Comparison of Q-Lab with Q-R (QIAcube plus the Argene EBV R-gene quantification kit on a Rotor-Gene instrument). A total of 156 samples were used. (D) Comparison of Q-A and Q-R. A total of 151 samples were used. The bold line represents the mean differences; the thin lines represent the mean⫾1.96 standard deviation.
TABLE 3Mean differences (SD) between EBV DNA loads measured by the different methods
Comparison of methodsa
Mean (SD) difference between EBV DNA loads (log10copies/ml)b
MP-Lab PCR vs Q-Lab PCR 0.11 (0.31) Q-Lab PCR vs Q-Artus PCR ⫺0.06 (0.42)* Q-Lab PCR vs Q-Argene PCR ⫺0.4 (0.41)* Q-Artus PCR vs Q-Argene PCR ⫺0.34 (0.49)* a
MP, MagNA Pure extraction; Q, QIAcube extraction; Lab, laboratory-developed real-time PCR (on a LightCycler amplification platform); Artus PCR, Qiagen artus EBV RG PCR kit (on a Rotor-Gene amplification platform); Argene PCR, Argene EBV R-gene kit (on a Rotor-Gene amplification platform).
b
Asterisks indicate SD statistically different from those for MP-Lab PCR versus Q-Lab PCR (P⬍0.001 by the Fisher-Snedecor test).
Germi et al.
on May 16, 2020 by guest
http://jcm.asm.org/
[image:3.585.298.546.89.155.2]FIG 2Follow-up, using four different EBV DNA load technologies, for eight patients with various pathologies. Patient 1 was a hematopoietic stem cell transplantation recipient with non-Hodgkin lymphoma; patient 2, a hematopoietic stem cell transplantation recipient (donor EBV serological status, positive; recipient serological status, negative [D⫹R⫺]); patients 3, 4, and 5, kidney transplant recipients (D⫹R⫺). Patient 6 had HIV; patient 7, hypogammaglobulinemia with primary EBV infection; patient 8, EBV encephalitis. MP, MagNA Pure extraction; Q, QIAcube extraction; Lab, laboratory-developed real-time PCR (on a LightCycler amplification platform); A, Qiagen artus EBV RG PCR kit (on a Rotor-Gene amplification platform); R, Argene EBV R-gene kit (on a Rotor-Gene amplification platform).
on May 16, 2020 by guest
[image:4.585.43.538.44.658.2]were below 0.5 log for 86.3% of the samples and below 1 log for 96.3% of the samples. The differences between viral loads mea-sured by the laboratory-developed and Artus PCRs were below 0.5 log for 90% of the samples and below 1 log for 98.8% of the samples. The viral load differences measured between the Argene PCR and the laboratory-developed or Artus PCR were below 0.5 log for 61.3% and 63.8% of the samples, respectively; 96.3% of samples showed a difference below 1 log when the Argene and laboratory-developed PCRs or the Argene and Artus PCRs were compared. Overall, EBV DNA load measurements were higher by the Argene PCR than by the laboratory-developed or Artus PCR.
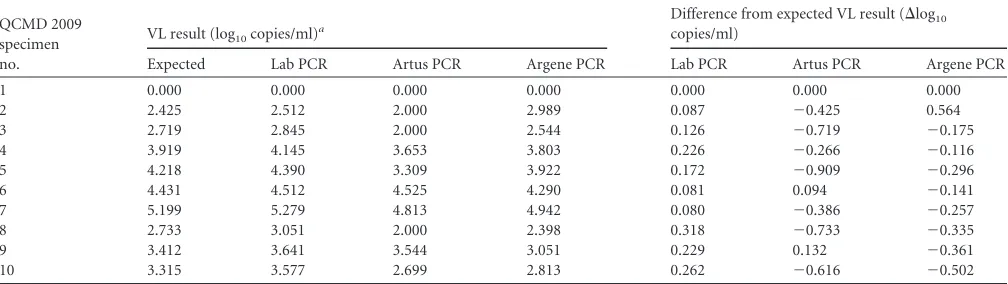
Results of the QCMD 2009 EBV proficiency panel.Table 4 depicts the EBV load results for the 10 samples from the QCMD 2009 EBV proficiency panel after manual extraction (without the QIAcube or MagNA robot) and amplification by the three PCR assays (Lab, Artus, and Argene). The sample for which a negative result was expected was found negative by the three PCR assays. All nine positive results obtained by the laboratory-developed PCR were higher than the expected results, but the difference
re-mained below 0.5 log10copies/ml (mean⌬log10,⫹0.175). With
the Argene PCR, eight of nine results were lower than the expected
results (mean⌬log10for the nine positive samples,⫺0.180). The
maximum differences between the Argene PCR results and the
expected results were⫺0.502 and⫹0.564. With the Artus PCR,
seven of nine results were lower than the expected result (mean
⌬log10for the nine positive samples,⫺0.425) and four of them
presented differences greater than 0.5 log10. The Spearman
corre-lation coefficients for the laboratory-developed PCR, the Artus PCR, and the Argene PCR relative to the expected results were 0.999, 0.951, and 0.915, respectively.
DISCUSSION
The automation of nucleic acid extraction and the availability of commercial real-time quantitative PCR assays could improve the agreement and the clinical utility of EBV DNA load measurement in routine clinical settings. This study compared the EBV load results obtained by two automated extraction methods coupled to the same PCR assay and the EBV load results obtained by three EBV quantitative real-time PCR assays after the same extraction. Few data have been published on the performance of auto-mated extraction for EBV DNA quantification on whole blood
(14), and to our knowledge, this is the first study of QIAcube extraction for EBV DNA load measurement. The comparison of the MagNA and QIAcube automated extraction platforms showed an excellent correlation of the EBV load results in 200
whole-blood specimens (R⫽0.958;P⬍0.0001), with fewer than
8% of VL differing by more than 0.5 log10, and with a low standard
deviation of the differences (0.31). No PCR inhibition precluded the measurement of EBV load, since none of the samples inhibited the internal positive control in any of the PCR assays. All the qualitatively discordant VL (10%) concerned low EBV loads
(be-low 3 log10copies/ml): 15 of 20 were negative after QIAcube
ex-traction and weakly positive after MagNA exex-traction, and 5 of 20 were negative after MagNA extraction and weakly positive after QIAcube extraction. This suggested a trend toward greater sensi-tivity of MagNA extraction than of QIAcube extraction, particu-larly for low viral loads. The two automated extraction platforms were equivalent regarding time spent and standardization. The QIAcube is not totally automated but offers the advantage of being more versatile, since almost all the manual extraction kits available from Qiagen can be adapted for the QIAcube with comparable results. No cross-contamination was observed with either the MagNA or the QIAcube, but it should be noted that the MagNA instrument includes a UV DNA decontamination process not in-cluded in the QIAcube.
The three PCR methods (Artus PCR, Argene PCR, and Lab PCR) were compared after a common extraction on the QIAcube platform. Overall, for the 200 blood specimens, the correlation
between the different PCR assays was good (R⬎0.9;P⬍0.0001),
with⬍10% quantitatively or qualitatively discordant results, but
the standard deviation of the differences reached 0.49. In this study, the best correlation was observed for the laboratory-devel-oped PCR and the Artus PCR, even though they were carried out with different amplification platforms (LightCycler versus Rotor-Gene) and even though they target distinct genes (thymidine ki-nase versus EBNA1).
The discordant results were observed mostly for EBV loads
below 3 log10copies/ml, as has been reported previously (1, 2, 5,
[image:5.585.41.545.78.220.2]12, 16). In the transplantation setting, these discrepancies among low EBV loads in whole blood are most often irrelevant for the diagnosis of posttransplantation lymphoproliferative disorders (16). Nevertheless, greater sensitivity could become important if
TABLE 4Quantification of EBV DNA loads of QCMD 2009 proficiency panel specimens
QCMD 2009 specimen no.
VL result (log10copies/ml)a
Difference from expected VL result (⌬log10
copies/ml)
Expected Lab PCR Artus PCR Argene PCR Lab PCR Artus PCR Argene PCR
1 0.000 0.000 0.000 0.000 0.000 0.000 0.000
2 2.425 2.512 2.000 2.989 0.087 ⫺0.425 0.564
3 2.719 2.845 2.000 2.544 0.126 ⫺0.719 ⫺0.175
4 3.919 4.145 3.653 3.803 0.226 ⫺0.266 ⫺0.116
5 4.218 4.390 3.309 3.922 0.172 ⫺0.909 ⫺0.296
6 4.431 4.512 4.525 4.290 0.081 0.094 ⫺0.141
7 5.199 5.279 4.813 4.942 0.080 ⫺0.386 ⫺0.257
8 2.733 3.051 2.000 2.398 0.318 ⫺0.733 ⫺0.335
9 3.412 3.641 3.544 3.051 0.229 0.132 ⫺0.361
10 3.315 3.577 2.699 2.813 0.262 ⫺0.616 ⫺0.502
aLab PCR, laboratory-developed PCR (on a LightCycler amplification platform); Artus PCR, Qiagen artus EBV RG PCR kit (on a Rotor-Gene amplification platform); Argene
PCR, Argene EBV R-gene kit (on a Rotor-Gene amplification platform). The Spearman correlation coefficients with regard to the Expected value (Pⱕ0.006) were 0.999 for the Lab PCR, 0.951 for the Artus PCR, and 0.915 for the Argene PCR.
Germi et al.
on May 16, 2020 by guest
http://jcm.asm.org/
evidence emerges that low or medium EBV VL are related to other pathologies, such as acute rejection or graft dysfunction, or are useful for subtle immunosuppression monitoring (7). Although not explored in this study, the sensitivity of the quantitative PCR in matrices other than whole blood, such as serum or cerebrospi-nal fluid, could be important for the diagnosis of nasopharyngeal carcinoma, infectious mononucleosis, and EBV neurological dis-orders (6).
Despite the good correlation of EBV VL values measured using the three PCR methods, some major discrepancies were observed
in this study. In one case (patient H), with VL above 3 log10copies/
ml, the quantification differed repeatedly by more than 2 log10
copies/ml between the Artus (5.69 log10copies/ml) and Argene
(3.45 log10copies/ml) PCRs, despite the use of the same extraction
process and the same PCR platform. Mutations involving the primers or the probe annealing site could account for this differ-ence, since the Argene PCR and the laboratory-developed PCR target the EBV thymidine kinase gene, and the Artus PCR targets theEBNA1gene, but the thymidine kinase gene was sequenced, and no mutations were observed (results not shown) (17). Target-ing of genes present in multiple repeated copies may also cause this type of discrepancy, but to our knowledge, the thymidine
kinase andEBNA1genes are single-copy genes (15). This
consid-erable difference between two commercial assays in a single labo-ratory has already been observed by others (2, 15, 17), suggesting that replacement of one method with another should be under-taken with caution. It is hoped that the ongoing implementa-tion of a WHO EBV internaimplementa-tional standard for nucleic acid am-plification-based assays will improve the standardization of EBV load measurement, making the clinical interpretation of EBV DNA loads less challenging.
The second type of discrepancy highlighted by this study was a trend for the Argene PCR to give higher EBV VL than the Artus PCR and the laboratory-developed PCR in whole blood
(mean differences for the 200 WB VL,⫺0.42 and⫺0.36,
re-spectively). Surprisingly, the QCMD panel quantified by the Argene PCR gave values below the expected results and below the results obtained by the laboratory-developed PCR, suggest-ing that EBV VL quantification depends on the matrix consid-ered. This difference between the results for cell-free samples and cell-associated clinical samples has already been described (1, 5) and suggests that evaluation of a new commercial EBV DNA quantitative assay relies both on quality control and on clinical sample studies.
The main advantages of the commercial kit are that it provides standards and reagents produced using good manufacturing prac-tices and is easy to develop for nonspecialized laboratories that cannot develop their own method. Some studies suggested that commercial assays and standardized reagents could help improve the comparability of assays between laboratories (2, 8, 10), but others observed no significant difference in interlaboratory quan-titative precision when commercial reagents/assays rather than laboratory-developed assays were used (16).
In conclusion, these results demonstrated that the automated extraction systems, MagNA and QIAcube, and the two commer-cially available EBV real-time quantitative PCR assays, Argene and Artus, gave comparable results for EBV DNA measurement in whole blood. However, in this study, the two automated
extrac-tion techniques with the same PCR gave a higher correlaextrac-tion (P⬍
0.05) and a lower standard deviation (P,⬍0.001 by the
Fisher-Snedecor test) than different PCR assays with the same extracted material. This work also underscored that 40% of VL measure-ments performed with two commercial assays in the same
labora-tory differed by more than 0.5 log10copies/ml. This highlights the
importance of using an international standard and reinforces the assumption that EBV VL should be monitored by the same assays and with the same specimen type, and should be interpreted for a given patient with regard to the clinical history, the risk factors for an EBV-associated disease, and the viral dynamics of the EBV DNA load.
ACKNOWLEDGMENTS
The authors declare no conflict of interest.
We thank José Labarere for his help in statistical analysis.
REFERENCES
1.Abbate I, et al.2011. Multicenter comparative study of Epstein-Barr virus DNA quantification for virological monitoring in transplanted patients. J. Clin. Virol.50:224 –229.
2.Ahsanuddin AN, Standish MC, Caliendo AM, Hill CE, Nolte FS.2008. Validation of an Epstein-Barr viral load assay using the QIAGEN Artus EBV TM PCR analyte-specific reagent. Am. J. Clin. Pathol.130:865– 869. 3.Brengel-Pesce K, et al.2002. Routine use of real-time quantitative PCR for laboratory diagnosis of Epstein-Barr virus infections. J. Med. Virol.
66:360 –369.
4.De Paoli P, Pratesi C, Bortolin MT.2007. The Epstein Barr virus DNA levels as a tumor marker in EBV-associated cancers. J. Cancer Res. Clin. Oncol.133:809 – 815.
5.Fafi-Kremer S, et al.2008. Evaluation of the Epstein-Barr virus R-gene quantification kit in whole blood with different extraction methods and PCR platforms. J. Mol. Diagn.10:78 – 84.
6.Gärtner B, Preiksaitis JK.2010. EBV viral load detection in clinical virol-ogy. J. Clin. Virol.48:82–90.
7.Gulley ML, Tang W.2010. Using Epstein-Barr viral load assays to diag-nose, monitor, and prevent posttransplant lymphoproliferative disorder. Clin. Microbiol. Rev.23:350 –366.
8.Hayden RT, et al.2008. Multicenter comparison of different real-time PCR assays for quantitative detection of Epstein-Barr virus. J. Clin. Mi-crobiol.46:157–163.
9.Heslop HE.2009. How I treat EBV lymphoproliferation. Blood114:4002– 4008.
10. Ito Y, et al.2010. Multicenter evaluation of prototype real-time PCR assays for Epstein-Barr virus and cytomegalovirus DNA in whole blood samples from transplant recipients. Microbiol. Immunol.54:516 –522. 11. Kimura H, Ito Y, Suzuki R, Nishiyama Y.2008. Measuring Epstein-Barr
virus (EBV) load: the significance and application for each EBV-associated disease. Rev. Med. Virol.18:305–319.
12. Laus S, Kingsley LA, Green M, Wadowsky RM.2011. Comparison of QIAsymphony automated and QIAamp manual DNA extraction systems for measuring Epstein-Barr virus DNA load in whole blood using real-time PCR. J. Mol. Diagn.13:695–700.
13. Luzuriaga K, Sullivan JL.2010. Infectious mononucleosis. N. Engl. J. Med.362:1993–2000.
14. Mengelle C, et al. 2008. Comparison of two highly automated DNA extraction systems for quantifying Epstein-Barr virus in whole blood. J. Clin. Virol.43:272–276.
15. Perandin F, Cariani E, Pollara CP, Manca N.2007. Comparison of commercial and in-house real-time PCR assays for quantification of Epstein-Barr virus (EBV) DNA in plasma. BMC Microbiol.7:22. 16. Preiksaitis JK, et al.2009. Interlaboratory comparison of Epstein-Barr
virus viral load assays. Am. J. Transplant.9:269 –279.
17. Ruiz G, Peña P, de Ory F, Echevarría JE.2005. Comparison of com-mercial real-time PCR assays for quantification of Epstein-Barr virus DNA. J. Clin. Microbiol.43:2053–2057.
18. Young LS, Rickinson AB.2004. Epstein-Barr virus: 40 years on. Nat. Rev. Cancer4:757–768.