MODELING AND ANALYSIS OF PMSG BASED WIND TURBINE
WITH SUPER-LIFT CONVERTER
J. Barsana Banu and M. Balasingh Moses
Department of Electrical and Electronics Engineering, University College of Engineering, BIT Campus, Truchirappalli, India E-Mail: [email protected]
ABSTRACT
Modeling of Permanent Magnet synchronous generator (PMSG) based wind energy conversion system is described throughout this paper. The wind turbine is connected across the load via super-lift boost converter and PMSG generator. Super-lift boost converter enhances the voltage gain and output voltage in geometric progression. The ultimate aim of this paper is to extort utmost power commencing from the airstream with high efficiency. To achieve maximum power, a conventional perturbs and observes MPPT because of its simple and robust control, which permits the PMSG to operate at optimal power. The proposed model can be simulated by MATLAB software, and simulated results are given to illustrate the validity of the proposed system with the conventional wind power system.
Keywords: permanent magnet synchronous generator, perturb and observe algorithm, super-lift boost converter, wind turbine.
1.INTRODUCTION
Nowadays, truly utilization of energy having an essential impact on the improvement of human progress. Repeatedly, it has demonstrated that the energy growth corresponds to the financial welfare of the society. Nowadays, in [1, 2] fossil fuels have are utilized as the main energy source to deliver power, but it is very expensive because of its ecological effect and unsustainable nature. The ignition of fossil fuels generates the greenhouse gas, which leads to global warming. Hence, the energy experts prefer the renewable- energy sources (RES) because of its sustainable and pollution- free environment.
Among the various RES, a wind-energy source has demonstrated the greatest development in the past few years contrasted with other RES. The energy captured by the wind depends on its speed, which is intermittent in nature to limit’s efficiency. To generate power from wind, three-phase PMSG, Rectifier and power electronic converters are incorporated to co-ordinate with the utility grid or stand-alone load.
Permanent magnet synchronous generators (PMSGs) based WECS has created with different strategies because of their exceptional attributes, for example, low volume, weight, and elite, In addition, it is working at minimum rotational speed and the gearbox that impacts the efficiency can be overlooked [3].
Figure-1. Block representation of the proposed WECS.
The quantity of energy obtained from the wind relies upon occurrence of instant wind speed in addition MPPT control strategies are needed to extort the maximum power. Numerous topologies of MPPT are described in [4, 5]. Optimal torque control MPPT is utilized in addition with speed controller is described in [6]. Various converter models and control applied for PMSG based WECS to analyze power and voltage disturbance is presented in [7, 8].
This paper discusses the simulation and modeling of WECS with enhanced power electronic boost converter is developed to access the extreme force from the incident wind at all directions as shown in figure 1. The wind turbine and permanent magnet synchronous generator modeling is given in section II and III. Uncontrolled rectifier and proposed super-lift boost converter are analyzed in section IV and V. MPPT algorithm and its implementation are narrated in part VI. Results and discussions are performed in section VII. At last, conclusions are presented in section VIII.
2.MODELING OF WIND TURBINE
The mechanical power extricated from air has the subsequent derivation
Where,
R - Radius of the turbine (m), q - Thickness of air (kg/m3), VW - Airstream velocity (m/s) and Cp - Turbine power coefficient
p w w
R
V
C
P
2 32
1
(1)
The wind-turbine torque can be expressed as
p m w
m w
w
C
V
R
P
T
22
1
Ωm –Turbine revolution velocity (rad/s). The Cp has the subsequent equation
0
.
4
5
0
.
0068
116
5176
.
0
1 21
e
C
i p (3)1
055
.
0
08
.
0
1
1
3
i (4)Where β is the angle of the blades (rad) and λ is the tip speed ratio (TSR), which is expressed as:
w m
V
R
(5)It should be recognized in order to have finest TSR, kΩmopt at which the energy derivative is maximum CPmax. As a result, the mechanical energy access from the airstream is also greatest. If the scheme working at the finest position, the extreme power is obtained by substitute (5) in (1) as given below:
3
max mopt
w
K
P
(6)The equation (6) should be utilized to understand the MPPT scheme. The ideal revolving velocity is computed from the power output, by regulating the airstream turbine to work at the ideal rotor velocity; this promises the greatest power is accessed from the occurrence storm. Where, Ωmopt is an optimal revolving velocity consequent to on particular airstream velocity, and K is an optimal power gain represented by:
3 max 5
2
1
opt pC
R
K
(7)3. PMSG MODELING
The PMSM can be modeled using rotor reference frame with the subsequent assumptions,
1) Neglecting the saturation. 2) The Sinusoidal induced EMF. 3) Zero iron losses.
4) Neglecting dynamics of the field current.
Voltage equations are given by:
q d r q s q
R
i
V
(8)d q r d s d
R
i
V
(9)Flux linkages are given by
q q q
L
i
(10)f d d d
L
i
(11)Substituting (10) & (11) in to (8) & (9)
q q f d d r q s
q
R
i
L
i
L
i
V
(
)
(12))
(
d d fq q r d s
d
R
i
L
i
L
i
V
(13)Arranging equation (12) and (13) in matrix form
f f r d q d s q r d r q s d qi
i
L
R
L
L
L
R
V
V
(14)The developed torque motor is being given by
di
q qi
d
P
Te
2
2
3
(15)The mechanical torque expression is,
dt
d
J
B
T
T
e L m m
(16)Solving the rotor mechanical speed from (9)
dt
J
B
T
T
e L mm
(17)and
P
r m2
(18)In the exceeding expressions,
r and
mis the electrical and mechanical speed at the rotor.4.DIODE RECTIFIER
The three-phase bridge rectifier can be connected directly to the three-phase PMSG to correct the generated AC voltage output from the PMSG as revealed in Figure-2. The normal output voltage across the rectifier is,
Li
V
V
3
2
(19)Figure-2. Three phase diode rectifier.
5. SUPER-LIFT BOOST CONVERTER
Super-lift boost converter acquires unregulated input dc from the diode rectifier. The output voltage from the rectifier oscillates due to alterations in wind speed. Therefore, the enhanced super-lift boost converter comprises of a single switch in addition with two diodes are required to obtain not only noiseless dc voltage and also incorporate the MPPT function with high-voltage gain. Resistive load is connected across the super-lift boost converter for simplicity to access the power from wind as appeared in Figure-3.
Figure-3. Super-lift boost converter.
The voltage developed across capacitor C1 is exciting to Vi. The current iL1 flow via the inductor L1 maximize in voltage Vi throughout the switch-on duration DT and minimizes in voltage −(VO - 2Vi) throughout the switch-off interval (1-D)T. Hence, the inductor current ripple iL1 is,
T
D
L
V
V
DT
L
V
iL
in2
i(
1
)
1 0 1 1
(20)in
V
D
D
V
1
2
0 (21)
The voltage transfer gain is,
D
D
V
V
G
i
1
2
0 (22)
The mean input current is,
1 1
(
1
)
(
2
)
)
1
(
D
I
D
I
D
I
D
I
(23)The current variation ratio iLi via inductor L1 is,
1 2 1 1 1 1
)
2
(
2
)
1
(
2
)
2
(
2
/
fL
R
D
D
D
I
L
TV
D
D
I
i
i i L L
(24)Usually
1 is little (lesser than one) indicates this super-lift converter in generalfunctions as the continuous mode.The output ripple voltage VOis,
R
V
fC
k
C
DT
I
C
Q
v
0 2 2 0 20
(25)Consequently, the voltage output variation ratio
0
v
is given by2 0
2
2
/
RfC
D
V
v
o
(26)6.MPPT ALGORITHM
The most generally utilized MPPT procedure for WECS is Perturb and Observe technique. Perturb implies change. At this point, the voltage or current through the rectifier is varied occasionally, and the output power is measured.
Figure-4. Flow diagram for P & O MPPT.
addition and the subsequent change in power i.e., ΔP is calculated.
In the event that ΔP is positive, then the perturbation or variation in the voltage at the rectifier moves the working point nearer to the greatest power point. In other cases if ΔP is negative, then the working point is moved far from extreme power point. Flow diagram of perturb and observe calculation is appeared in Figure-4.
7.RESULTS AND DISCUSSIONS
[image:4.612.320.539.91.237.2]The simulation of the proposed WECS with Perturb and Observe MPPT calculation is completed in MATLAB/SIMULINK software. The parameters used during the simulation are appeared in Table-1. The proposed WECS consists of wind turbine, PMSG, three-phase diode rectifier, Super-lift converter, perturb and observe algorithm with resistive load. The wind turbine has wind velocity of 15 m/s at phase angle 00 is considered as input for simulation and given to the PMSG. This PMSG converts mechanical energy of wind into electric energy at the same time speed fluctuates due to intermittent in nature. Again, the diode bridge rectifier converts generated three-phase AC output voltage in to unregulated dc voltage. In addition, we need MPPT algorithm to extract maximum power from the given wind speeds. Traditional perturb and observe MPPT algorithm is utilized to sense voltage and current from the rectifier and correspondingly duty proportion of the super-lift enhanced converter is adjusted to boosting the voltage from the rectifier with high transfer gain and high efficiency for maximum power.
Figure-5. Conventional WECS-Generator output voltage (AC).
Figure-5 shows the three-phase generator AC output voltage (120 V) of the conventional WECS and figure 6 describe the dc output voltage (120 V) and power (590 W) of the rectifier.
[image:4.612.318.540.290.587.2]Figure-6. Conventional WECS- Rectified voltage and power (DC).
Table-1. Circuit Parameters for proposed WECS.
Parameters Values
Input Voltage Vi 150 Volts Output Voltage V0 300 Volts Wind speed 15 m/s Inductor L1 4 Micro Henry Capacitor C1 18 Nano Farad Capacitor C2 47 Micro Farad
Figure-7. Conventional WECS- Boost converter voltage and power (DC).
[image:4.612.81.294.447.607.2]Figure-8. Proposed WECS - Generator output voltage (AC).
Figure-8 shows the three-phase generator AC output voltage (150 V) of the proposed WECS and figure 9 describe the dc output voltage (150 V) and power (710 W) of the rectifier.
Figure-9. Proposed WECS- rectified voltage and power (DC).
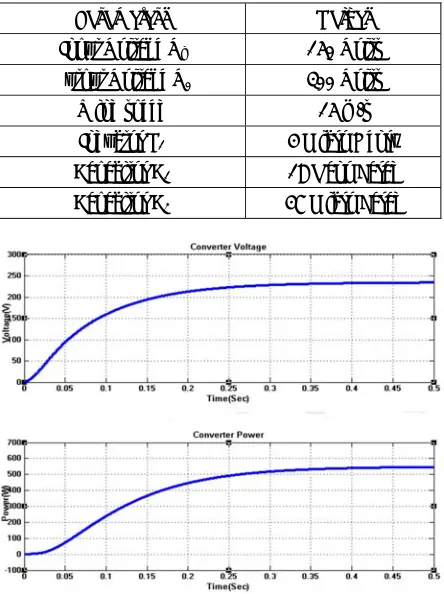
Figure-10. Proposed WECS- super-lift boost converter voltage and power (DC).
Figure-10 presents the output voltage (300 V) and output power (700 W) across the load i.e. from the proposed super-lift boost converter. From this, the efficiency of 98.5 % is achieved, which is greater than the conventional WECS.
8.CONCLUSIONS
In this article, modeling and analysis of Permanent Magnet synchronous generator (PMSG) driven wind energy conversion system is discussed. The voltage gain and output voltage enhancement of the super-lift boost converter in geometric progression is analyzed by simulation results. The mathematical modeling of each component used in the proposed system is described in detail. Traditional perturb and observe MPPT algorithm is utilized to extort highest power from the airstream with high efficiency. The simulation result of the proposed WECS is compared with conventional WECS and proved that the proposed model access maximum power at high efficiency.
REFERENCES
[1] Luz Trejos-Grisales, Cristian Guarnizo-Lemus and Sergio Serna. Overall Description of Wind Power Systems. ing. cienc. vol. 10, no. 19, pp. 99-126, enero-junio. 2014.
[3] Mayouf. Messaoud, Rachid. Abdessamed. Modeling and Optimization of Wind Turbine Driving Permanent Magnet Synchronous Generator. Jordan Journal of Mechanical and Industrial Engineering. Volume 5, Number 6, Dec. 2011. Pages 489-494.
[4] Abdullah M. A., Yatim A. H. M. Tan C.W, Saidur R. A review of maximum power point tracking algorithms for wind energy systems. Renewable and Sustainable Energy Reviews 16 (2012), 3220-3227.
[5] Yacine Daili, Jean-Paul Gaubert, Lazhar Rahmani. Implementation of a new maximum power point tracking control strategy for small wind energy conversion systems without mechanical Sensors. Energy Conversion and Management (2015), 97, 298-306.
[6] Abdeldjalil Dahbi, Mabrouk Hachemi, Nasreddine Nait-Said, Mohamed-Said Nait-Said. Realization and control of a wind turbine connected to the grid by using PMSG. Energy Conversion and Management 84(2014), 346-353.
[7] Hua Ye, Juan Su, Songhuai Du. Simulation and Analysis of PMSG-based Wind Energy Conversion System using Different Converter Models. Engineering, 2013, 5, 96-100 doi:10.4236/eng.2013.51b017.
![2 [(2,4 Dimethylphenyl)iminomethyl] 6 methylphenol](data:image/gif;base64,R0lGODlhAQABAIAAAP///wAAACH5BAEAAAAALAAAAAABAAEAAAICRAEAOw==)