OPTIMIZATION OF ELECTROCOAGULATION PROCESS FOR TREATING
OILFIELD
PRODUCED WATER
Rand Q. Al-Khafaji and Abdul Halim A-K Mohammed
Department of Chemical Engineering, College of Engineering, University of Baghdad, Iraq
E-Mail: [email protected]
ABSTRACT
Treatment and reuse the huge amounts of oilfield produced water (PW) represent a current and future challenge for oil companies and needs more research for improving efficiency and reducing treatment cost. This study proposed electrocoagulation (EC) as a simple, reliable and economic method for treating PW. Treatment was carried out in a batch EC reactor with aluminum electrodes. Response surface methodology (RSM) with central composite design (CCD) was employed to achieve energy efficient removal of chemical oxygen demand (COD). The effect of crucial process variables,
namely, current density (5-15 mA/cm2), initial pH (5-11), and reaction time (5-30 minutes) on the responses, namely,
removal efficiency of COD and electrical energy consumption were studied using three dimensional response surface plots. The experimental results were analyzed by analysis of variance (ANOVA). Multiple response optimization revealed that
optimum current density, pH, and reaction time were 7.83 mA/cm2, 7.24, and 20.40 minutes, respectively. Under these
conditions, the COD removal percentage was 73.98%, and electrical energy consumption was 0.1549 kWh/kg COD. It is concluded that electrocoagulation method is an effective preliminary process for treating produced water and additional treatment by advanced method, such as electo-oxidation, is needed to reduce COD to below regulation limits.
Keywords: electrocoagulation, produced water, response surface methodology, COD removal, aluminum electrodes.
1. INTRODUCTION
Oil is a major source of energy and income for many countries, and its production is one of the most important industrial activities in this century [1]. Oil is produced with large volume of wastewater, it is estimated that three barrels of water are produced for every barrel of crude oil [2].
Produced water (PW) is a complex mixture of dissolved and particulate organic and inorganic chemicals in water (mostly oils, salts and minerals) [3]. Some factors such as geological location of the field, lifetime of its reservoirs affect the physical and chemical properties of produced water.
The oil content in produced water is frequently classified into four groups according to its nature of physical phase, which are: free oil (larger than 150 µm), dispersed oil (20-150 µm), emulsified oil (less than 20 µm), and dissolved oil.
Nowadays, it has become essential to recover and use this water again due to the more and more stringent environmental limits and the always increasing in water demand. Usually, selection of the PW treatment method is a challenging problem that is steered by the overall treatment goal. The general plan is to choose the cheapest
and most efficient method3.
Treatment methods of produced water can be classified into three main categories namely, primary to separate free oil such as gravity separators, secondary to removal dispersed oil such as coagulation and flotation processes, and tertiary treatment to eliminate emulsified and soluble oil such as advanced oxidation processes (AOPs).
Electrocoagulation (EC) is an electrochemical method where coagulants are produced in-situ by passing
D.C. current through aqueous media. Sacrificial anodes are dissolved in order to produce the coagulants. In addition, hydrogen gas is evolved at the cathode and oxygen gas may be evolve at the anode. Hydrogen bubbles adsorb the flocs formed by the process, and ensure their flotation. EC is hybridization of coagulation, flotation and electrochemistry.
The most used material as sacrificial anodes are aluminum and iron because they are cheap, readily
available and proven effective. The formation of Fe(OH)3
as result of the reaction of Fe3+ with OH- ions gives yellow
color to the water and increase turbidity. This phenomenon a reason for choosing aluminum electrodes for electrocoagulation [4-5].
Electrocoagulation is a simple, environment-friendly and cost-effective technique that has the potential to be a distinct choice for wastewater treatment. One of the main advantages of EC is the avoidance of chemical additions, which makes EC “a green technology”. Indeed, the electron may be considered to be the only “chemical” used, thus preventing secondary pollution.
Electrocoagulation technologies has been applied successfully for the treatment of various wastewater [6]such as food industry wastewater [7], wastewater with heavy metals [8], textile wastewater [9], tannery wastewater [10], paper industry wastewater [11], nitrate wastewater [12] and refinery wastewater [13].
discharge limits, it is compulsory to use additional treatment such as electro-oxidation (EO) [15].
The traditional technique of experimental design, in which one process variable is changed, while the other variables are settled, dose not demonstrate the interaction between the process variables. Response surface methodology (RSM) is able to assess this interaction [16].
Response surface methodology finds the
optimum values of process variables for a desirable response by using a statistical-based technique to evaluate the simultaneous effects between these variables [17-18].
The aim of this work is to examine the effectiveness of electrocoagulation process with aluminum sacrificial electrodes for treating Iraqi oilfield produced water. Moreover, in this study, the response surface methodology has been employed to optimize the process conditions for electrocoagulation for maximizing COD removal efficiency while minimizing electrical energy consumption.
2. MATERIAL AND METHODS
2.1 Produced water sample
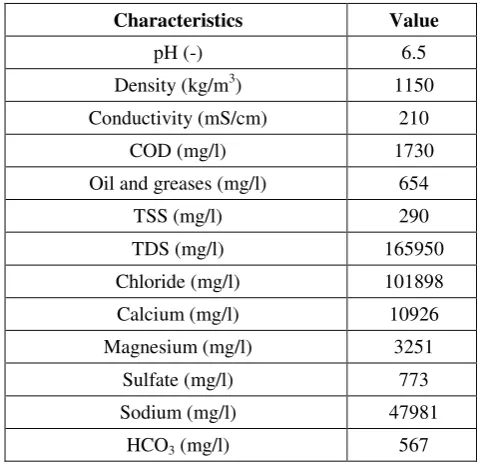
[image:2.595.48.290.421.653.2]The produced water sample was collected from oilfield, midland oil company, Iraq. The characteristics of the produced water are summarized in Table-1.
Table 1. Characteristics of Iraqi oilfield produced water.
Characteristics Value
pH (-) 6.5
Density (kg/m3) 1150
Conductivity (mS/cm) 210
COD (mg/l) 1730
Oil and greases (mg/l) 654
TSS (mg/l) 290
TDS (mg/l) 165950
Chloride (mg/l) 101898
Calcium (mg/l) 10926
Magnesium (mg/l) 3251
Sulfate (mg/l) 773
Sodium (mg/l) 47981
HCO3 (mg/l) 567
2.2 Electrochemical reactor
Electrocoagulation was conducted at room temperature (25 °C) in a cylindrical glass reactor with a working volume of 1000 ml and the solution was rigorously stirred with a magnetic stirrer (Jenway1000, UK) at 500 rpm. The electrodes used were two aluminum plates, one serving as a cathode and the other as anode,
with an effective area of 40 cm2 each. The inter-electrode
distance was 2 cm. A laboratory model DC power supply (Yaogong 1052DD, China) was used maintain constant
DC current and to measure voltage and current. pH was measured by pH-meter (Hanna Instruments pH 211).
The main electrochemical reactions occurring during electro coagulation can be written as [19]:
𝐴𝑙 → 𝐴𝑙3++ 3 𝑒− (anode) (1)
3𝐻2𝑂 + 3𝑒−→ (32) 𝐻2(𝑔) + 3𝑂𝐻− (cathode) (2)
The generated Al3+ and OH- ions react to form
various monomeric and polymeric species such as
Al(OH)2+, Al(OH)2+, Al2(OH)24+, Al6(OH)153+,
Al7(OH)174+, Al8(OH)207+, Al13O4(OH)247+,
Al13(OH)345+[20], which transform primarily into
Al(OH)3(s) and eventually polymerize to Aln(OH)3n as
follow [21]:
𝑛𝐴𝑙(𝑂𝐻)3 → 𝐴𝑙𝑛(𝑂𝐻)3𝑛 (3)
𝐴𝑙3++ 3𝐻
2𝑂 → 𝐴𝑙(𝑂𝐻)3(𝑠)+ 3𝐻+ (4)
The hydrogen gas evolved at the cathode (equation 2) can remove suspended materials by flotation which is one of the advantages of the electrocoagulation process [22]. Some articles have also speculated that oxygen is also produced on the anodes. However, it seems that this does not take place in typical conditions (electrochemical potential) of EC systems as dissolution of anodes follows Faraday’s law [23].
Moreover, hypochlorite (ClO-) form at the
cathode due to the presence of a large number of chloride
ions in the produced water. ClO- ions acts as oxidizing
agent that favors the electrochemical reaction. The
following reactions explain the formation of ClO- ions
[24]:
2𝐶𝑙(𝑎𝑞)− → 𝐶𝑙2(𝑔)+ 2𝑒− (5)
𝐶𝑙2(𝑔)+ 𝐻2𝑂(𝑙) → 𝐻𝐶𝑙𝑂(𝑎𝑞)+ 𝐻(𝑎𝑞)+ + 𝐶𝑙(𝑎𝑞)− (6)
𝐻𝐶𝑙𝑂(𝑎𝑞) → 𝐶𝑙𝑂(𝑎𝑞)− + 𝐻(𝑎𝑞)+ (7)
2.3 Analytical procedure
All samples were filtered through Whatman filter paper with a pore size of 11 µm. COD was analyzed using a COD thermo reactor (RD125, Lovibond) and a direct reading spectrophotometer (MD200, Lovibond)
The equation used to calculate the percentage of COD removal (R%) was:
R% =COD𝑜−COD
COD𝑜 × 100 (8)
Where CODo and COD are the initial and final chemical
2.4 Experimental design
A total of 20 experiments were performed to optimize and determine the relationship between the removal efficiency of COD and electrical energy consumption with respect to crucial operating parameters,
i.e., current density 5-15 mA/cm2, initial pH 5-11 and
treatment time 5-30 min. Response surface Methodology (RSM), the central composite design (CCD) was performed using MINITAB software (version 17). Experimental data were fitted to a quadratic equation:
𝑌𝑖= 𝑏𝑜+ ∑ 𝑏𝑖𝑥𝑖+ ∑ 𝑏𝑖𝑖𝑥𝑖2+ ∑ 𝑏𝑖𝑗𝑥𝑖𝑥𝑗 (9)
Where bo, bi, and bij are the regression coefficients for the
equation terms. Yi is the percentage removal of COD
(R%), and electrical energy consumption (EEC). The regression coefficients were analyzed by the F-test and P-value. The statistical significance of the model was tested by the analysis of the variance (ANOVA). The relationship between the response and the variables was used to construct three dimensional response surface plots to study the variables on the response. Multiple response optimization of the EC process was done to determine the optimum parameters for maximum COD removal efficiency and for minimum power consumptions.
2.5 Experimental procedure
All electro coagulation experiments were conducted in a batch mode under galvanostatic conditions. Before starting-up the process, the electrodes were cleaned with 1 M HCl and rinsed with deionized water to eliminate impurities from the surface of the electrodes. In each run, 800 ml of produced water was placed into the reactor and all runs were performed under stirring at 500 rpm. Initial
pH values were adjusted with 0.1 M solutions of H2SO4
and NaOH as required. The average of voltage from the start to the end of experiment was used for the determination of energy consumption.
One of most important parameters that affect the application of any method of wastewater treatment is the cost. The operation cost in EC process includes material (mainly electrode material), consuming of energy cost, labor, maintenance, sludge dewatering and disposal and fixed cost [4]. Consuming of energy cost is the major cost in EC process [19]. The electrical energy consumption (EEC) for electrocoagulation treatment was calculated using the following equation:
𝐸𝐸𝐶 =(𝐶𝑂𝐷U .I .t. 1000
𝑜−𝐶𝑂𝐷) 𝑉 (10)
where:
EEC = electrical energy consumed (kWh/kg
COD)
U = voltage (volt)
I = current intensity (A)
T = time (h)
V = water volume (Liter)
CODo and COD = initial and final COD (mg/l)
3. RESULTS AND DISCUSSIONS
3.1 Experimental design analysis
Table-2. Experimental design and the obtained responses.
Run
Current density, i,
(mA/cm2)
pH Time,
(min)
COD removal efficiency, R%
Electrical energy consumption, EEC
(kWh/kg COD)
1 5 5 5.0 45.90 0.0315
2 5 11 30.0 57.08 0.1519
3 15 5 5.0 48.90 0.1551
4 10 8 30.0 78.90 0.3114
5 10 8 17.5 74.10 0.1934
6 15 8 17.5 77.10 0.3444
7 10 11 17.5 70.90 0.2021
8 15 5 30.0 76.20 0.5974
9 10 8 17.5 76.05 0.1884
10 5 5 30.0 66.83 0.1297
11 10 8 17.5 75.15 0.1907
12 10 8 17.5 74.03 0.1936
13 5 8 17.5 62.13 0.0814
14 10 5 17.5 70.13 0.2043
15 15 11 5.0 47.10 0.1611
16 10 8 17.5 75.40 0.1901
17 15 11 30.0 74.50 0.6110
18 5 11 5.0 43.10 0.0335
19 10 8 17.5 74.51 0.1923
20 10 8 5.0 53.70 0.0762
The relationship between COD removal
efficiency (R%), electrical energy consumption (EEC),
and the three process variables, i.e., current
density(mA/cm2), pH, and reaction time (min) were fitted
to a second order polynomial, Eqs. (11) and (12), as given below:
COD (R%) = - 2.41 + 3.66i + 6.39 pH + 2.563
time-0.19992i*i–0.453 pH*pH –0.05308 time*time+0.0754i*pH
+ 0.0396i*time-0.0228 pH*time (11)
EEC = 0.1563–0.01368i–0.0253 pH –4.59E-3 time +
9.58E-4i*i + 1.59E-3 pH*pH +3.10E-5 time*time - 3.90E-5i*pH + 1.35E-3i*time + 9.40E-5 pH*time (12)
Table-3 show the ANOVA for the removal efficiency of COD (R%) response and variables selected to fit the model. The F-value of 78.97 for the model implying that the model is significant. A p-value lower than 0.05 indicates that the model is statistically high significant. Terms with p-values less 0.05 indicates that these terms are significant. The model was also tested
using the determination coefficient (R2). The closer R2
Table-3. ANOVA for COD removal efficiency (R%).
Source Sum of
squares DF
Mean
square F-value p-value Remark*
Model 2768.04 9 307.56 78.97 0.000 S
i 237.75 1 237.75 61.05 0.000 S
pH 23.35 1 23.35 5.99 0.034 S
time 1318.13 1 1318.13 338.45 0.000 S
i*i 68.18 1 68.18 17.51 0.002 S
pH*pH 45.76 1 45.76 11.75 0.006 S
time*time 189.18 1 189.18 48.57 0.000 S
i*pH 10.24 1 10.24 2.63 0.136 NS
i*time 48.96 1 48.96 12.57 0.005 S
pH*time 5.87 1 5.87 1.51 0.248 NS
Residual 38.95 10 3.89
Lack-of-fit 35.77 5 7.15 11.25 0.009
Pure error 3.18 5 0.64
Cor total 2806.99 19
* S=significant, NS=not significant
Table-4 show the ANOVA for the electrical energy consumption (EEC) response and variables selected to fit the model. The F-value of 407.50 for the model implying that the model is significant. A p-value lower than 0.05 indicates that the model is statistically high significant. Terms with p-values less 0.05 indicates
that these terms are significant. Comparison between the actual and predicted values of EEC showed a good correlation between the observed and the predicted values with coefficient of determination (R-squared) value of 0.9973.
Table-4. ANOVA for electrical energy consumption (EEC).
Source Sum of
squares DF
Mean
square F-value p-value Remark
Model 0.452740 9 0.050304 407.50 0.000 S
i 0.207635 1 0.207635 1681.98 0.000 S
pH .000173 1 0.000173 1.4 0.264 NS
time 0.180609 1 0.180609 1463.06 0.000 S
i*i 0.001579 1 0.001579 12.79 0.005 S
pH*pH 0.000561 1 0.000561 4.55 0.059 NS
time*time 0.000065 1 0.000065 0.53 0.485 NS
i*pH 0.000003 1 0.000003 0.02 0.885 NS
i*time 0.057043 1 0.0570453 462.09 0.000 S
pH*time 0.000097 1 0.000097 0.78 0.397 NS
Residual 0.001234 10 0.000123
Lack-of-fit 0.001214 5 0.000243 58.73 0.000
Pure error 0.000021 5 0.000004
Cor total 0.45397 19
3.2 Effect of process variables
Three factors at three levels CCD were used in this study to investigate the effect of process variables (current density, pH, operation time) on the responses (COD removal efficiency, electrical energy consumption). Response surface plots and contour plots were constructed from model equations (eqns. 11-12) which are shown in Figures 1-6.
3.2.1 Effect of process variables on COD removal
Figures 1-3 represents the three-dimensional (3D) response surface and two-dimensional (2D) contour plots of COD removal efficiency as a function of applied current density, pH, and reaction time.
Figure-1. Surface plot and contour plot for COD removal efficiency (R%)vs pH, i, at time= 17.5 minutes.
Figure-2. Surface plot and contour plot for COD removal efficiency (R%)vs time, i, at pH = 8.
Figure-3. Surface plot and contour plot for COD removal efficiency (R%), vs time, pH at i=10 mA/cm2.
time 1 7.5 Hold Values
i
p
H
1 5.0 1 2.5 1 0.0 7.5 5.0 1 1
1 0
9
8
7
6
5
> – – – – – – < 60.0
60.0 62.5
62.5 65.0
65.0 67.5
67.5 70.0
70.0 72.5
72.5 75.0
75.0 COD R%
pH 8 Hold Values
i
ti
m
e
1 5.0 1 2.5 1 0.0 7.5 5.0 30
25
20
1 5
1 0
5
> – – – – – – < 50
50 55
55 60
60 65
65 70
70 75
75 80
80 COD R%
i 1 0 Hold Values
pH
ti
m
e
1 1 1 0 9 8 7 6 5 30
25
20
1 5
1 0
5
> – – – – < 55
55 60
60 65
65 70
70 75
It was found that the removal efficiency of COD
increased rapidly with current density up to 10 mA/cm2.
This can be explained to the fact that, increasing current density will increase the coagulant and increase the metal hydroxide flocks and hence improve the COD removal.
However, above 10 mA/cm2, the current density had
almost negligible effect on the COD removal efficiency. This may be attributed to the formation of a passive oxide film on the aluminum electrodes, which inhibit the electro coagulation process. In addition, at higher current, mass transfer could be hindered by the increased gas production.
Similar observation was obtained by Ogedey et al. (2017)
[25], Zhu et al. (2015) [24] and Kushwaha et al. (2010)
[7].
It has been found that initial pH is an important parameter affecting the performance of EC process. It was observed that COD removal efficiency increased with increasing initial pH from 5 to 7.7. This may be due to the formation of amorphous aluminum hydroxide with large surface area which enhance the removal of COD. Beyond pH 7.7, lower COD removal efficiency was noticed which may be due to the precipitation mechanism. Similar
observation was obtained by Thirugananasambandham et
al. (2013) [17].
The COD removal efficiency increase with increasing reaction time up to 20 minutes. This is due to the increase in the quantity of aluminum released in the solution, which enhance the formation of aluminum hydroxide and lead to higher COD removal. Thereafter 20 minutes, the removal efficiency had slight effect on the removal of COD. This can be explained by the fact that after 20 minutes most pollutants are removed as flocks. In addition, aluminum hydroxide species formed during EC stick with the electrode surface and grow like a film with time. Therefore, the removal efficiency affected due to extra resistance imposed by this film. Similar observation was obtained by Ghosh et al. (2008) [26].
3.2.2 Effect of process variables on electrical energy consumption
Figures 4-6 represents the three-dimensional (3D) response surface and two-dimensional (2D) contour plots of electrical energy consumption as a function of applied current density, pH, and reaction time.
Figure-4. Surface plot and contour plot for EECvs time, pH, at i=10 mA/cm2.
Figure-5. Surface plot and contour plot for EECvs pH, i, at time=17.5 minutes.
i 1 0 Hold Values
pH
ti
m
e
1 1 1 0 9 8 7 6 5 30
25
20
1 5
1 0
5
> – – – – – < 0.1 0
0.1 0 0.1 5
0.1 5 0.20
0.20 0.25
0.25 0.30
0.30 0.35
0.35 EEC
time 1 7.5 Hold Values
i
p
H
1 5.0 1 2.5 1 0.0 7.5 5.0 1 1
1 0
9
8
7
6
5
> – – – – – < 0.1 0
0.1 0 0.1 5
0.1 5 0.20
0.20 0.25
0.25 0.30
0.30 0.35
Figure-6. Surface plot and contour plot for EECvs time, i, at pH = 8.
EEC values of the present study was calculated for a given amount (kg) of COD removed. From the obtained results, it was found that EEC is significantly increased with increasing the applied current density while EEC increase linearly with time. Meanwhile, the EEC decreases with increasing pH up to 7.9, beyond that there was an increase in the EEC. In this study, the EEC values varied in the range of 0.0315 to 0.6110 kWh/kg COD.
3.3 Optimization and validation
Multiple response optimization was performed to solve model equations for maximizing COD removal
efficiency (R%) while minimizing electrical energy consumption (EEC). The optimization gave current
density of 7.83 mA/cm2, pH of 7.24, and reaction time of
20.40 minutes as optimal points. The optimization predicts removal efficiency of 73.97% and energy consumption of 0.1549 kWh/kg COD at these optimal points. Figure-7 illustrate the response optimization of COD removal efficiency, and electrical energy consumption.
Validation experiment conducted under the optimal parameters gave 74.25% COD removal efficiency and 0.1651 kWh/kg COD electrical energy consumption, which in agreement with the predicted values.
Figure-7. Multiple response optimization of COD removal efficiency (R%), and electrical energy consumption (EEC).
4. CONCLUSIONS
Response surface methodology (RSM) has been successfully employed for electrocoagulation treatment of oilfield produced water using aluminum electrodes. The performance of the EC process was modeled and the effect
of crucial process variables was investigated. Multiple response optimizations were performed for maximizing COD removal efficiency while minimizing electrical energy consumption. The optimum current density, pH, and reaction time were 7.83, 7.24, and 20.40 respectively.
pH 8 Hold Values
i
ti
m
e
1 5.0 1 2.5 1 0.0 7.5 5.0 30
25
20
1 5
1 0
5
> – – – – < 0.1
0.1 0.2
0.2 0.3
0.3 0.4
0.4 0.5
Under these conditions, the removal efficiency of COD and the electrical energy consumption were 73.97% and 0.1549 kWh/kg COD respectively. This study reveals that electrocoagulation is an effective preliminary treatment process. Synergistic combination of EC with advanced method, such as electro-oxidation, is still required for complete elimination of organic compounds.
Nomenclatures
b Regression coefficient
COD Chemical oxygen demand, mg/l
EEC Electrical energy consumption, kWh/kg
COD
i Current density, mA/cm2
I Current intensity, A
R% Percent of COD removal
t Time, min
TDS Total dissolved solids, mg/l
TSS Total suspended solids, mg/l
U Voltage, Volt
V Volume, Liter
REFERENCES
[1] Igunnu E.T., Chen G.Z. 2012. Produced water
treatment technologies. International Journal of
Low-Carbon Technologies. 9, 157-177.
https://doi.org/10.1093/ijlct/cts049
[2] Gomes J., Cocke D., Das K., Guttula M., Tran D.,
Beckman J. 2009. Treatment of produced water by electrocoagulation. Proceedings of the TMS Annual Meeting and Exhibition, February 15-19, 2009, San Francisco, CA. pp. 459-466.
[3] Nasiri M., Jafari I. 2016. Produced water from oil-gas
plants: A short review on challenges and
opportunities. Periodica Polytechnica Chemical
Engineering. https://doi.org/10.3311/ppch.8786
[4] Kobya M., Hiz H., Senturk E., Aydiner C., Demirbas
E. 2006. Treatment of potato chips manufacturing wastewater by electrocoagulation. Desalination. 190, 201-211. https://doi.org/10.1016/j.desal.2005.10.006
[5] Linares-Hernández, I., Barrera-Díaz, C.,
Roa-Morales, G., Bilyeu, B., Ureña-Núñez, F., 2009. Influence of the anodic material on electrocoagulation performance. Chemical Engineering Journal. 148, 97-105. https://doi.org/10.1016/j.cej.2008.08.007
[6] Moussa D.T., El-Naas M.H., Nasser M., Al-Marri
M.J. 2017. A comprehensive review of
electrocoagulation for water treatment: Potentials and challenges. Journal of Environmental Management.
186,24-41.
https://doi.org/10.1016/j.jenvman.2016.10.032
[7] Kushwaha J.P., Srivastava V.C., Mall I.D. 2010.
Organics removal from dairy wastewater by electrochemical treatment and residue disposal. Separation and Purification Technology. 76, 198-205. https://doi.org/10.1016/j.seppur.2010.10.008.
[8] [8]Vasudevan, S., Lakshmi, J., 2011. Effects of
alternating and direct current in electrocoagulation
process on the removal of cadmium from water – A
novel approach. Separation and Purification
Technology 80, 643–651.
https://doi.org/10.1016/j.seppur.2011.06.027
[9] Aoudj S., Khelifa A., Drouiche N., Hecini M.,
Hamitouche H. 2010. Electrocoagulation process applied to wastewater containing dyes from textile industry. Chemical Engineering and Processing:
Process Intensification. 49, 1176-1182.
https://doi.org/10.1016/j.cep.2010.08.019
[10]Varank G., Erkan H., Yazýcý S., Demir A., Engin G.
2014. Electrocoagulation of tannery wastewater using monopolar electrodes: process optimization by response surface methodology. International Journal
of Environmental Research. 8, 165-180.
https://doi.org/10.22059/ijer.2014.706
[11]Zodi S., Louvet J.-N., Michon C., Potier O., Pons
M.-N., Lapicque F., Leclerc J.-P. 2011.
Electrocoagulation as a tertiary treatment for paper mill wastewater: Removal of non-biodegradable organic pollution and arsenic. Separation and
Purification Technology. 81, 62-68.
https://doi.org/10.1016/j.seppur.2011.07.002
[12]Lacasa E., Cañizares P., Sáez C., Fernández F.J.,
Rodrigo M.A. 2011. Removal of nitrates from
groundwater by electrocoagulation. Chemical
Engineering Journal. 171, 1012-1017.
https://doi.org/10.1016/j.cej.2011.04.053
[13]El-Naas M.H., Alhaija M.A., Al-Zuhair S. 2014.
Evaluation of a three-step process for the treatment of
petroleum refinery wastewater. Journal of
Environmental Chemical Engineering. 2, 56-62. https://doi.org/10.1016/j.jece.2013.11.024
[14]Emamjomeh M.M., Sivakumar M. 2009. Review of
Environmental Management. 90, 1663-1679. https://doi.org/10.1016/j.jenvman.2008.12.011
[15]Chakchouk I., Elloumi N., Belaid C., Mseddi S.,
Chaari L., Kallel M. 2017. A combined
electrocoagulation electrooxidation treatment for diary wastewater. Brazilian Journal of Chemical
Engineering. 34, 109-117.
https://doi.org/10.1590/0104-6632.20170341s20150040
[16]Mirshahghassemi S., Aminzadeh B., Torabian A.,
Afshinnia K., 2016. Optimizing electrocoagulation and electro-Fenton process for treating car wash wastewater. Environmental Health Engineering and
Management. 4, 37-43.
https://doi.org/10.15171/ehem.2017.06
[17]Thirugnanasambandham K., Sivakumar V., Prakash
M., J. 2014. Optimization of electrocoagulation process to treat biologically pretreated bagasse effluent. Journal of the Serbian Chemical Society. 79, 613-626. https://doi.org/10.2298/jsc130408074t
[18]Hakizimana J.N., Gourich B., Chafi M., Stiriba Y.,
Vial C., Drogui P., Naja J. 2017. Electrocoagulation
process in water treatment: A review of
electrocoagulation modeling approaches.
Desalination. 404, 1-21.
https://doi.org/10.1016/j.desal.2016.10.011
[19]Safari S., Azadi Aghdam M., Kariminia H.-R. 2015.
Electrocoagulation for COD and diesel removal from
oily wastewater. International Journal of
Environmental Science and Technology. 13, 231-242. https://doi.org/10.1007/s13762-015-0863-5
[20]Mollah M., Morkovsky P., Gomes J., Kesmez M.,
Parga J., Cocke D. 2004. Fundamentals, present and future perspectives of electrocoagulation. Journal of
Hazardous Materials. 114, 199-210.
https://doi.org/10.1016/j.jhazmat.2004.08.009
[21]Gengec E., Kobya M., Demirbas E., Akyol A., Oktor
K. 2012. Optimization of baker’s yeast wastewater
using response surface methodology by
electrocoagulation. Desalination. 286, 200-209.
https://doi.org/10.1016/j.desal.2011.11.023
[22]Yildiz Y.Ş. 2008. Optimization of Bomaplex Red
CR-L dye removal from aqueous solution by
electrocoagulation using aluminum electrodes.
Journal of Hazardous Materials. 153, 194-200. https://doi.org/10.1016/j.jhazmat.2007.08.034
[23]Mouedhen, G., Feki, M., Wery, M.D.P., Ayedi, H.F.,
2008. Behavior of aluminum electrodes in
electrocoagulation process. Journal of Hazardous
Materials 150, 124–135.
https://doi.org/10.1016/j.jhazmat.2007.04.090
[24]Zhu M., Yao J., Wang W., Yin X., Chen W., Wu X.
2015. Using response surface methodology to evaluate electrocoagulation in the pretreatment of produced water from polymer-flooding well of Dagang Oilfield with bipolar aluminum electrodes. Desalination and Water Treatment. 57, 15314-15325. https://doi.org/10.1080/19443994.2015.1072058
[25]Ogedey A., Tanyol M. 2017. Optimizing
electrocoagulation process using experimental design for COD removal from unsanitary landfill leachate. Water Science and Technology. 76, 2907-2917. https://doi.org/10.2166/wst.2017.460
[26]Ghosh D., Medhi C.R., Purkait M.K. 2008. Treatment
of fluoride containing drinking water by