Munich Personal RePEc Archive
Estimating Quarterly Gross Fixed
Capital Formation
Arby, Muhammad Farooq and Batool, Irem
State Bank of Pakistan
STATE BANK OF PAKISTAN
June, 2007 No. 17
Muhammad Farooq Arby Irem Batool
Estimating Quarterly Gross Fixed
Capital Formation
SBP Working Paper Series
Editor: Riaz Riazuddin
The objective of the SBP Working Paper Series is to stimulate and generate discussions, on different aspects of macroeconomic issues, among the staff members of the State Bank of Pakistan. Papers published in this series are subject to intense internal review process. The views expressed in the paper are those of the author(s) and do not necessarily reflect those of the State Bank of Pakistan.
© State Bank of Pakistan All rights reserved.
Price per Working Paper
Pakistan: Rs 50 (inclusive of postage) Foreign: US$ 20 (inclusive of postage)
Purchase orders, accompanied with cheques/drafts drawn in favor of State Bank of Pakistan, should be sent to:
Chief Spokesperson
External Relations Department, State Bank of Pakistan,
I.I. Chundrigar Road, P.O. Box No. 4456, Karachi 74000. Pakistan
For all other correspondence: Editor,
SBP Working Paper Series Research Department, State Bank of Pakistan,
I.I. Chundrigar Road, P.O. Box No. 4456, Karachi 74000. Pakistan
Published by: Editor, SBP Working Paper Series, State Bank of Pakistan, I.I. Chundrigar Road, Karachi, Pakistan.
E
STIMATINGQ
UARTERLYG
ROSSF
IXEDC
APITALF
ORMATIONMuhammad Farooq Arby Joint Director
Research Department State Bank of Pakistan
Irem Batool Analyst
Monetary Policy Department State Bank of Pakistan
Acknowledgment
The authors are grateful to Dr. A.R. Kemal for his guidance and valuable suggestions to
improve the paper. Suggestions from participants of the seminar in which this paper was
presented are also acknowledged. For any errors remaining in the paper, the authors are
solely responsible.
Contact for correspondence
Irem Batool
Monetary Policy Department, State Bank of Pakistan I.I. Chundrigar Road, Karachi, Pakistan
Abstract
In Pakistan, only annual estimates of national accounts are available officially. Although
quarterly real gross domestic product has been estimated by some studies like Kemal &
Arby (2004) and Bengaliwala (1995), no attempt has been made so far to estimate
quarterly gross fixed capital formation – a key macroeconomic variable. This study
presents a methodology to quarterise gross fixed investment in Pakistan and estimates a
quarterly series for the period 1971Q3 to 2006Q2. Using the commodity flow approach,
total gross fixed investment has been disaggregated into four components, i.e. machinery
and equipment, furniture and fixture, structure and land improvement for annual data of
selected years and then each component is quarterised on the basis of related indicators
for which quarterly data is available officially.
Key Words: National Income Accounts, Gross Fixed Capital Formation, Commodity
flow approach, Pakistan
2 Estimating Quarterly Gross Fixed Capital Formation
The official estimates of national accounts in Pakistan are available only on annual basis.
The lack of higher frequency data on key macroeconomic variables has been a stumbling
block to a meaningful economic research, particularly econometric modeling where the
length of time series has a bearing on the quality of models. Although Bengaliwala
(1995) and Kemal and Arby (2004) have estimated quarterly real GDP along with its
sub-sectors on the supply side, i.e. agriculture, industry and services, the quarterly
national accounts in expenditure side are still unavailable. This study attempts to
quarterise the annual data of gross fixed capital formation (GFCF) – the only variable
needed to present a complete table of quarterly national accounts with broad aggregates
on the expenditure side.1
The gross fixed capital formation can be estimated through three approaches: commodity
flow, expenditure and financing approach. We adopted the commodity flow approach
where capital goods flow into the economy from different sources. There are four types
of capital goods included in gross fixed capital formation, viz. machinery and equipment,
furniture & fixture, structure, and land improvement and cultivated assets in livestock
sector and orchard plantation. The machinery and equipment enter into the economy
through two sources viz., domestic production and imports; structure includes
construction work undertaken in the domestic economy; and land improvement and
cultivated assets are also domestic activities. We estimated the quarterly series of capital
formation on the basis of these components. The rest of the paper consists of a section on
methodology and another section on results. The last section concludes the paper.
2. Methodology
As already mentioned, the gross fixed capital formation can be expressed as a sum of the
four components, i.e. It = Mt + St + Rt + Lt with Mt = MFt + MDt. The It is aggregate gross
fixed capital formation, Mtis total machinery and equipment, St is structure, Rt is furniture
& fixture and Lt is land improvement including improvement of water courses, and
cultivated assets in the livestock sector.2 The Mt consists of domestically produced
machinery (MDt) and imported machinery & equipment (MFt).
In the first step of estimating quarterly investment, we disaggregated the total investment
into its five components for some selected years for which detailed information was
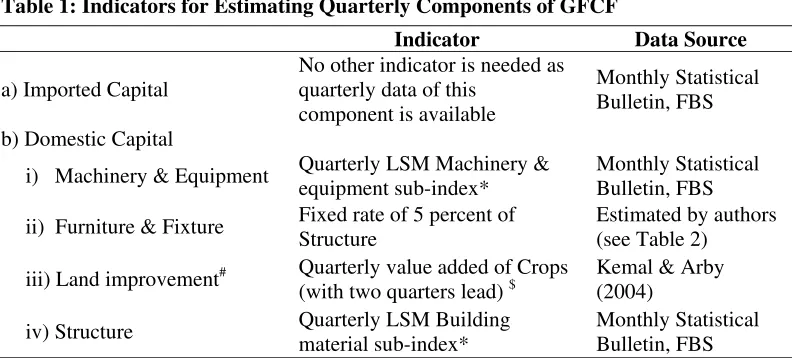
available. The second step is to quarterise the annual values of these five components by
using some indicators of which quarterly data is available in official sources as given in
Table 1. In the next step, quarterly values of these components are estimated for the
remaining years through interpolation which is done on the basis of annual compound
growth rates.
The total gross fixed investment is then worked out by aggregating the quarterly values of
its components. The gross fixed investment is estimated both at current and constant
prices. Different deflators are used to convert the values of components of fixed
2
4 investment at current prices to constant prices of 1999-00: unit value index is used for
imported machinery and equipment, WPI manufacturing is used for domestically
manufactured machinery and equipment, WPI building material is used for structure, and
[image:8.595.101.497.221.400.2]WPI food for land improvement.
Table 1: Indicators for Estimating Quarterly Components of GFCF
Indicator Data Source
a) Imported Capital
No other indicator is needed as quarterly data of this
component is available
Monthly Statistical Bulletin, FBS b) Domestic Capital
i) Machinery & Equipment Quarterly LSM Machinery & equipment sub-index*
Monthly Statistical Bulletin, FBS ii) Furniture & Fixture Fixed rate of 5 percent of
Structure
Estimated by authors (see Table 2)
iii) Land improvement# Quarterly value added of Crops (with two quarters lead) $
Kemal & Arby (2004)
iv) Structure Quarterly LSM Building material sub-index*
Monthly Statistical Bulletin, FBS
* Estimated by authors by using quarterly production of relevant items and their relative weights information for which are available in FBS Monthly Statistical Bulletin.
# The cultivated assets are distributed equally into four quarters following Kemal & Arby (2004) wherein except milk all other components of the livestock are distributed into four quarters equally.
$ In Pakistan, there are two major types of crops (a) Kharif crops with sowing seasons in April-June and harvest season in October-December, (b) Rabi crops with sowing season in October-December and harvest season in April-May. Since crops’ value addition belongs to harvest season while investment activity is undertaken during sowing season. Therefore, we have taken crops value added with two quarters lead as an indicator of land improvements.
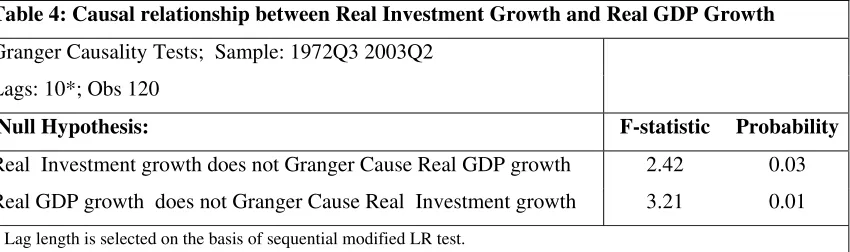
An attempt is also made to use the newly estimated real investment series in examining
the linkage between investment and growth. For this purpose Granger causality test3 is
applied on quarterly real investment growth estimated by this study and quarterly real
GDP growth estimated by Kemal and Arby (2004).
The component of imported machinery and equipment (MFt) is obtained from the
monthly Statistical Bulletin of the Federal Bureau of Statistics (various issues) which
gives both annual and quarterly data of imports by commodity groups. The domestic
production of capital goods is obtained from various censuses of manufacturing
industries (CMIs) and censuses of small and household manufacturing industries
(SHMI).4 Productions of furniture & fixtures, both metal and non-metal, are also taken
from CMI and SHMI.5 The value of land improvement is worked out as 15.2 percent of
gross fixed capital formation in the agriculture sector.6 The cultivated assets are taken as
4 percent of total value added of livestock worked out on the basis of information given
in FBS (2004). With the estimates of four components in hand, we worked out the last
component, structure (St) as residual. The annual numbers of gross fixed capital
formation are taken from the series generated by Ayaz (2006). This process of
disaggregation is carried out for the years 1975-76, 1980-81, 1985-86, 1990-91 and
2000-01.7
3. Results
The shares of the five components of the total gross fixed investment as a result of the
decomposition exercise are reported in Table 2. It comes out that imported capital
contributes about a quarter of the gross fixed investment while another quarter is
domestically produced machinery and equipment. On the other hand, structure constitutes
4
Both published by Federal Bureau of Statistics for selected years. 5
The SHMI is not undertaken by the Federal Bureau of Statistics in regular interval; therefore, in order to make the relevant figures of CMI and SHMI comparable for a given year, we adjusted the SHMI (1996-97) data with growth rate of small-scale manufacturing value added.
6 We used the ratio as given in Agriculture Census 1990 according to which land improvement is 14.1 percent and water course improvement is 1.1 percent of the total fixed investment.
7
6 around 45% of the total gross fixed investment. Our results are close to Arshad Zaman
Associates (2002) who worked out shares of structure in total investment as 45 to 49
percent for different years of the late 1990s and that of equipment (domestic and foreign
combined) as 42 to 45 percent.
[image:10.595.103.493.244.394.2]
Table 2: Break-up of Gross Fixed Capital Formation (% share)
1975-76 1980-81 1985-86 1990-91 2000-01
a) Imported Capital 23.3 23.9 28.2 23.2 23.8 b) Domestic Capital
i)Machinery & Equipment * 24.6 23.0 23.2 25.4 26.3 ii)Furniture & Fixture * 0.9 1.1 0.9 1.2 2.3 iii)Land improvement &
cultivated assets 4.9 4.4 4.4 4.1 4.3
iv)Structure 46.3 47.6 43.3 46.1 43.3 Total 100.0 100.0 100.0 100.0 100.0
* Production data from CMI is adjusted upward for under-coverage.
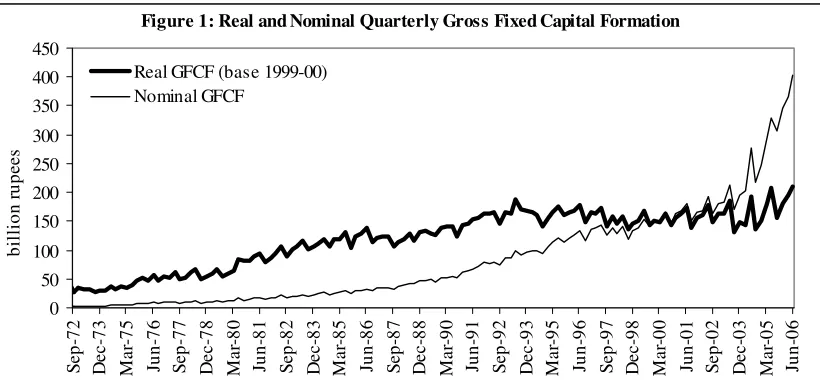
The estimated series of gross fixed capital formation at current and constant prices are
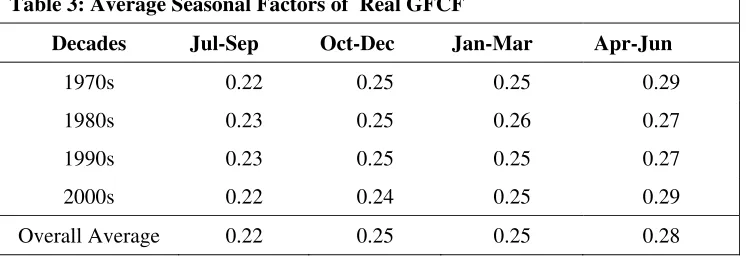
depicted in Figure 1 (spreadsheets given as annexure). The results show that, on average,
22 percent of the annual gross fixed investment takes place during the first quarter and 28
percent in the last quarter of the fiscal year (July-June). The rest of the annual investment
[image:10.595.113.486.591.720.2]is spread almost equally into the other two quarters (see Table 3).
Table 3: Average Seasonal Factors of Real GFCF
Decades Jul-Sep Oct-Dec Jan-Mar Apr-Jun
1970s 0.22 0.25 0.25 0.29 1980s 0.23 0.25 0.26 0.27 1990s 0.23 0.25 0.25 0.27 2000s 0.22 0.24 0.25 0.29 Overall Average 0.22 0.25 0.25 0.28
As regards the relationship between investment and growth, the study finds a two-way
causality between the growth rates of the two variables (see Table 4). The real investment
growth significantly impacts and is impacted by real GDP growth implying the existence
of both the Keynesian investment multiplier and the accelerator principle in case of
Pakistan.
Earlier studies on investment and growth relationship include Khan (1996) who finds a
significant impact of investment on economic growth from data of 95 countries
(including Pakistan) for the 1970-90 periods. Another study by Khan (1988) finds that
changes in output have minor impact on private investment while general market
[image:11.595.92.502.108.299.2]conditions have stronger influence on private capital formation in Pakistan. Figure 1: Real and Nominal Quarterly Gross Fixed Capital Formation
0 50 100 150 200 250 300 350 400 450 S ep-72 D ec-7 3 Ma r-7 5 Jun-76 S ep-77 D ec-7 8 Ma r-8 0 Jun-81 S ep-82 D ec-8 3 Ma r-8 5 Jun-86 S ep-87 D ec-8 8 Ma r-9 0 Jun-91 S ep-92 D ec-9 3 Ma r-9 5 Jun-96 S ep-97 D ec-9 8 Ma r-0 0 Jun-01 S ep-02 D ec-0 3 Ma r-0 5 Jun-06 b ill ion r u pe es
8 4. Concluding Remarks
While high frequency data for most of the other macroeconomic variables is available in
Pakistan, that for national accounts is not, except for the quarterly series of real GDP and
its sub-sectors. This paper, thus attempts to fill the high frequency data gap to some
extent by estimating the quarterly gross fixed capital formation for the period 1971Q3 to
2006Q2. We first disaggregated the total fixed investment into its components for annual
data of selected years and then estimated quarterly components on the basis of some
related indicators for which quarterly information was available. As an application of the
newly estimated series, we also examined its relationship with the real GDP growth and
found that there existed two-way Granger causality between quarterly real investment
growth and quarterly real GDP growth. Future extension to this work can be the
quarterisation of investment at sectors level, i.e. gross fixed capital formation in
[image:12.595.92.517.119.245.2]agriculture, industry and services sectors.
Table 4: Causal relationship between Real Investment Growth and Real GDP Growth
Granger Causality Tests; Sample: 1972Q3 2003Q2 Lags: 10*; Obs 120
Null Hypothesis: F-statistic Probability
Real Investment growth does not Granger Cause Real GDP growth 2.42 0.03 Real GDP growth does not Granger Cause Real Investment growth 3.21 0.01
References
Agriculture Census Organization (1990), Census of Agriculture 1990; Government of Pakistan, Lahore.
Arshad Zaman Associates (2002,) Capital Formation in Pakistan 1999-00; Federal Bureau of Statistics, Islamabad, September.
Ayaz, Adila (2006), Construction of Consistent Time Series of National Accounts; SBP unpublished manuscript, Economic Analysis Department, State Bank of Pakistan, Karachi.
Bengaliwala, Kaiser (1995), Temporal and Regional Decomposition of National Accounts of Pakistan; Ph.D Dissertation, Department of Economics, University of Karachi.
Federal Bureau of Statistics (2000), Survey of Small and Household Manufacturing Industries 1996-97; Islamabad.
Federal Bureau of Statistics (2002a), Census of Manufacturing Industries (various issues); Islamabad.
Federal Bureau of Statistics (2004), National Income Accounts of Pakistan: Rebasing from 1980-81 to 1999-00; National Accounts Section, FBS, Islamabad.
10
Khan, Ashfaque Hasan (1988), Macroeconomic Policy and Private Investment in Pakistan; Pakistan Development Review, 27, 277-292.
Khan, Mohsin S. (1996), Government Investment and Economic Growth in the
Annexure 1: Real Gross Fixed Capital Formation
(1999-00 prices) (Rs million)
Jul-Sep Oct-Dec Jan-Mar Apr-Jun Annual
12
Annexure 2: Nominal Gross Fixed Capital Formation
(Rs million)
Jul-Sep Oct-Dec Jan-Mar Apr-Jun Annual
1971-72 2030 1854 2336 2659 8879 1972-73 2024 2280 2377 2999 9679 1973-74 2301 2694 3351 4644 12990 1974-75 3970 5152 5208 5734 20064 1975-76 6981 7420 7321 8981 30703 1976-77 7669 8821 8489 10341 35320 1977-78 8525 9075 9918 11228 38746 1978-79 8797 10071 10546 12234 41649 1979-80 10687 12182 12705 16212 51786 1980-81 13966 15144 16248 17028 62386 1981-82 15459 17057 17949 20445 70909 1982-83 17259 20286 20707 22928 81180 1983-84 20401 22236 24120 25862 92619 1984-85 22524 25646 26388 30524 105082 1985-86 24278 29560 30815 32976 117628 1986-87 29505 34303 35492 36311 135611 1987-88 32611 36666 38828 42292 150397 1988-89 40284 46377 48308 49188 184157 1989-90 45034 52759 53553 55925 207270 1990-91 50505 62296 63816 66199 242816 1991-92 70843 78794 77449 80183 307270 1992-93 74661 87679 86132 99624 348096 1993-94 91478 95780 98428 98756 384443 1994-95 93422 105764 113490 120442 433118 1995-96 112228 121981 126163 134200 494572 1996-97 115629 137162 137545 142011 532346 1997-98 124553 139841 129337 139400 533131