Munich Personal RePEc Archive
IMPACT of Cash Transfer Programs on
School Attendance and Child Poverty:
An Ex-ante Simulation for Sri Lanka
KUMARA, Ajantha Sisira and PFAU, Wade Donald
National Graduate Institute for Policy Studies (GRIPS)
1 March 2010
Online at
https://mpra.ub.uni-muenchen.de/30501/
Impact of Cash Transfer Programs on School Attendance and Child Poverty:
An Ex-ante Simulation for Sri Lanka
by
Ajantha Sisira Kumara
National Graduate Institute for Policy Studies (GRIPS) 7-22-1 Roppongi, Minato-ku, Tokyo 106-8677, JAPAN.
and
Wade Donald Pfau
National Graduate Institute for Policy Studies (GRIPS) 7-22-1 Roppongi, Minato-ku, Tokyo 106-8677, JAPAN.
Abstract
For countries assessing whether to implement a cash transfer program, an ex-ante
evaluation is vital to assess its potential impacts. This study simulates the impact of
alternative cash transfer programs on school attendance and poverty among Sri Lankan
children. We find that cash transfer programs targeting poor children would be the
most cost-effective way to reduce child poverty and encourage school attendance. If
means-testing is not feasible, then programs targeting the children in households with
at least three school-age children would provide a suitable second-best solution. Our
findings suggest that even a limited program budget can provide significant impacts.
Keywords: Cash Transfers; Poverty; School Attendance; Sri Lanka.
Acknowledgements: We thank two anonymous referees for their helpful comments, and we also thank Giang Thanh Long for his discussion and motivation.
Introduction
Children constitute a particularly vulnerable group in developing and emerging market countries. As estimated by UNICEF (2000), the risk of income-poverty among children is high and children account for the majority of the poor. Hence, a growing consensus exists for the importance of addressing childhood poverty. According to the UN (2009), in Sri Lanka, currently, children (age under 15) account for approximately 25 per cent of the population. Those attending school account for 16 per cent. As a rapidly ageing economy in the South Asian region, the percentage of children in Sri Lanka is decreasing gradually over time while the elderly (aged 60 and above) population grows. Researchers in the field of social protection have tended to focus on old-age social security systems and their impact on poverty among the elderly in Sri Lanka. Social protection economists have paid relatively less attention to social security systems for enhancing the well-being of children in Sri Lanka.
We find that simple cash transfer programs implemented even with a limited budget could reduce child poverty significantly while increasing school attendance and child-welfare modestly. Targeting poor children would be the most effective approach, though the involved administrative process for doing this is potentially cumbersome. If targeting poor children is too difficult, then targeting children in households with at least three children of school-age would provide a suitable alternative. These findings will assist policy makers to understand the costs and impacts of various cash transfer programs.
Review of the Literature
Most countries target poverty reduction with a mix of cash and in-kind transfers, but governments in developing and transition economies are increasingly relying on cash transfer programs to tackle childhood poverty (Barrientos and Dejong, 2004). There are a number of advantages for cash transfers when compared to in-kind transfers. Beneficiary families are free to use cash transfers in order to accomplish their priorities. Moreover, market distortions created by cash transfer programs are negligible. Such programs also tend to have multiplier effects on the local economy when the households spend their receipts. Tabor (2002) argues that the administrative setting required for handling cash transfer programs can be managed with low expenses. However, the effectiveness of such programs will depend completely on how poor households manage their money and how their behaviour changes in response to the program. Cash transfers may generate moral hazards.
Cash transfer programs aimed at children take three potential forms, namely conditional cash transfer programs, unconditional cash transfer programs, and child benefits (UNICEF, 2009). Conditional cash transfer programs are considered to be regular income transfers to poor households meeting certain behavioural conditions, such as school attendance, health checkups, and so forth. In contrast, unconditional cash transfers benefit households by providing regular income transfers without any attached conditions. Finally, child benefits are given to households with children on a universal basis.
poverty among families with children, discouraging child labour, and encouraging school attendance. In addition, developing economies expect to improve gender equality by supporting investment in the human capital of girls, ensure a measure of parity between families with children and those without children, and further encourage fertility.
Conditional cash transfer programs have been able to reduce poverty and generate positive impacts on school attendance, especially in Latin American countries (Son and Florentino, 2008). Well-recognized programs of this kind include Progresa (now called
Opportunidades) in Mexico, Bolsa Escola and Bolsa familia in Brazil, Red de
Proteccion Social in Nicaragua, Programa de Asistencia Familiar in Honduras,
Program of Advancement Through Health and Education in Jamaica, Food for Education in Bangladesh, Subsido Unico Familiar in Chile, and the Pantamid Pamilyang Pilipino in the Philippines.
A number of studies use an ex-ante simulation approach to evaluate the impact of cash transfer programs on child poverty and school attendance. As simulated by UNICEF (2009) for West and Central African countries, a universal child benefit scheme which provides a transfer equivalent to 30 per cent of the poverty line to every child from 0-14 has the greatest impact on poverty among children. It reduces the child poverty headcount ratio by 27.6 per cent in Mali, 18.5 per cent in Congo, and 16.9 per cent in Senegal. Moreover, the simulation results show that this scheme reduces educational deprivation, measured in terms of the number of children aged six and above who do not attend school, by 2.9 per cent.
As for targeting, Bourguignon et al. (2002) simulate the impact of the Bolsa Escola program in Brazil using universal targeting and targeting only poor children. The study reveals that targeting only poor children would be more effective in terms of encouraging school attendance and reducing poverty among children. The same conclusion is derived by Son and Florentino (2008) with regard to the Philippines.
Methodology
This study is based on the Sri Lanka Household Income and Expenditure Survey [Sri Lanka HIES] 2006/2007 conducted by the Department of Census and Statistics [DCS]. More details about the dataset are provided in Appendix 1.
Determining the Poverty Status of Children
This study utilizes static micro simulation techniques to simulate the impact of unconditional cash transfer programs on poverty and school attendance among children in Sri Lanka. Poverty in Sri Lanka is defined at the household level, and children living in poor households are classified as poor in this study. Under the official measure in Sri Lanka, poverty is defined as when the per-capita expenditures (total monthly expenditures divided by the number of household members with equal weights for adults and children) of a household fall below the poverty line of their residing district. The impact on poverty is estimated with the popular Foster-Greer-Thorbecke (1984) generalized measures [FGT Poverty Measures], which combine information about the extent of poverty as measured by the poverty headcount ratio, the intensity of poverty as measured by the poverty gap, and the inequality among the poor as measured by the poverty severity. Further details about poverty measurements in Sri Lanka and the FGT Poverty Measures are provided in Appendix 2.
The Role of Cash Transfers in School Attendance
We adapt the methodology of Kakwani et al. (2005) to express the demand function for education as Sci =Sci[Ζpi,Ζci,Ηi] where Sci is the demand for education for each
child and Ζpi,Ζci ,andΗiare the vectors of characteristics of the household head, child,
education level of the household head. We also include the employment status of the household head, as is done in Arunatilake (2006). The vector Ζciincludes the child’s
age, gender, and ethnicity. We also account for the biological relationship between the household head and the child, as Khanam and Ross (2005) find this to be an important factor. The household characteristics in the vector Ηi include per-capita expenditures,
sector (whether the household is in a rural or urban area), main livelihood (whether it is agriculture or non-agriculture), and the number of elderly dependents and children in the household. We estimate this demand function with a probit regression model to find the determinants of school attendance, seeking in particular to know the marginal effect of the household's per capita expenditures.
With these estimated marginal effects, we create two indicators to simulate the impact on schooling of a change in per-capita expenditure triggered by the cash transfer program. These indicators include the percentage change in probability to attend school by children in cash-recipient families, and the estimated number of new student enrolees after the program as a percentage of total school-attending children. The latter is referred to as the percentage increase in school attendance at the national level. Since the estimated coefficients are unbiased estimates of the probit regression for households with school-age children, the predicted average probability of attending school will be equal to the actual average attendance. Because this estimation provides a key input, but is otherwise incidental to our analysis, further descriptions of the methodology and estimation results are provided in Appendix 3.
Targeted Groups for Cash Transfers
[PRO]; schemes for children living in urban [URB] or rural sectors [RUR]; and a scheme for children living in households with at least three school-age children [THR].
Determining Effectiveness of the Proposed Cash Transfer Schemes
Effectiveness of the proposed cash transfer schemes is determined on the basis of how the poverty status of children and the whole population, along with the school attendance of children, would have changed if a cash transfer scheme had been implemented in the past in Sri Lanka. From the perspective of reducing poverty, the study calculates how the poverty rate, poverty gap, and poverty severity would have changed, in percentage terms. From the perspective of school attendance promotion, the study estimates the percentage increase in number of children attending schools together with the percentage increase in the probability to attend school by children in cash-recipient households.
The potential impact on social welfare is also calculated as the change in utility for school-age children and the whole population. To allow for diminishing returns from expenditures, changes in utility are computed as the sum of changes in the logarithms of expenditures before and after the cash transfer program. The impact on welfare is greater for poor households due to their lower starting expenditures. In addition, the cost effectiveness of the proposed cash transfer schemes is also computed. Here, the cost means the total cost for child benefit payments excluding any administrative costs. The cost effectiveness is the percentage of the total cost that would actually have been used to reduce the poverty incidence of cash-recipient children, all school-age children, and the whole population in Sri Lanka. This analysis provides details about the leakage of benefits to non-poor children, to poor non-children, and to non-poor non-children.
Major Assumptions for Simulating Cash Transfer Impacts
Accordingly, we can expect that the proposed cash transfer schemes would reduce poverty incidence among more than just the direct recipients.
With this assumption, we should note that an aspect of many cash transfer programs is that the money is paid to the mother rather than to the father. International evidence suggests that benefits are better spent, in terms of children’s health and education, when provided to women (see Rawlings and Rubio, 2005; Lund et al., 2008). For instance, a unique characteristic of the Mexican conditional cash transfer [CCT] program,
Opportunidades, is the deliberate decision to give the cash transfers to females.
According to Barber and Gertler (2010), this program improved the quality of prenatal care by empowering women to demand their right to quality care.
A second important assumption is that the proposed cash transfer schemes will be implemented with a restricted budget. Initially, we provide simulation results for a collection of cash transfer schemes costing approximately 1 per cent of GDP. Characteristics of cash transfer programs that we consider include targeting groups, maximum eligible age, and benefit level. The impact simulation of cash transfer schemes is then performed after varying the budget size between 0.25 per cent and 1.5 per cent of GDP in 2006/2007. This is considered to be the common range of budget allocations for child cash transfer schemes in many developing economies (see Barrientos and Dejong, 2004; Son and Florentino, 2008). Under each budget constraint, the study finds the most effective cash transfer scheme in terms of poverty reduction, welfare improvement, and promotion of school attendance among children.
degree university level. Government spending on education amounts to between two and three per cent of GDP.
A third assumption is that cash transfer amounts to children are expressed as a percentage of the poverty line. Per-capita poverty lines range from LKR 1959 to LKR 2623, depending on the region. The average household expenditures in the survey are LKR 23,925, which means that a benefit equal to the poverty line would increase the average household's expenditures by between 8.2 and 11 per cent, depending on the household's region of residence. For comparison to other countries, Maluccio et al. (2010) cites research finding that over the first two years starting in 2000, the actual average monetary transfer (for food security and education) of the Nicaraguan Red de
Protecciόn Social CCT program was approximately $272, or 17 per cent of the total
annual household expenditures. This is also approximately the same percentage of total annual pre-program household expenditures as the average transfer in Mexico's
Opportunidades CCT program. Thus, a Sri Lankan household with two school-age
children would be broadly comparable when benefit amounts are close to the poverty line.
Finally, the study assumes that there would not be any behavioural changes among the population in ways either to become qualified for benefits or to use benefits as a substitute for working. While our simulations are for unconditional transfers, behavioural changes that might weaken the program impacts could be mitigated through conditionality. Indeed, particularly with regard to school attendance, conditionality plays an important role in achieving the intended objectives from CT programs. For instance, Colombia’s CCT program, Familias en Acciόn, provides a cash subsidy to
enrolment rates before Opportunidades were between 90 and 94 per cent for both boys and girls. As explained in Rawlings and Rubio (2005), the increase in enrolment rates ranged from 0.74 to 1.07 percentage points for males and from 0.96 to 1.45 percentage points for females. Also, the increases in enrolment rates for secondary-level schooling range from 3.5 to 5.8 percentage points for males and from 7.2 to 9.3 percentage points for females, from the baseline enrolment rates of 73 per cent and 67 per cent for males and females, respectively. These studies have provided evidence for the role of conditionality in achieving desired objectives.
Nevertheless, certain studies have concluded that conditionality does not make a significant difference in achieving objectives through CT programs. By performing a comparative analysis, Lund et al. (2008) argues that the benefits of CT programs are reduced by the opportunity cost of fulfilling the conditions for achieving the transfer. They recommend that conditionality in CT programs should be justified after a careful analysis of the incidence of conditionality on poverty. A Brazilian study (Soares et al., 2006) compares the poverty reduction effects of unconditional benefits for elderly and disabled people with the Brazilian CCT program, Bolsa Escola. They find marked and similar effects on poverty reduction from both programs. Because our analysis is ex-ante for proposed programs, we are unable to directly incorporate conditionality, though in our results we will consider how conditionality may impact the findings.
Findings and Discussion
Impacts of the Proposed Cash Transfer Schemes on Poverty
impacts for different targeting groups in Table 1 are not directly comparable due to their differing costs and number of beneficiaries, but later we will compare programs of similar cost.
//Table 1 About Here//
As shown in Table 1, the total benefits paid would vary from 23.1 billion Sri Lankan Rupees (0.71 per cent of GDP in 2006/2007 or US$ 215.3 Million) for a cash transfer scheme targeting only poor children, to 135.4 billion Sri Lankan Rupees (4.15 per cent of GDP in 2006/2007 or US$ 1,262 Million) for a universal cash transfer scheme targeting all children. In our analysis, we have assumed that benefits are added to the household expenditures and then divided equally among household members. As a result, in most of the proposed cash transfer schemes, more than 50 per cent of estimated costs would be spent by non-children. However, lower leakage rates could be expected if a cash transfer scheme provides benefits to the children living in households consisting at least three school-age children (Category “THR”). Particularly, 56.47 per cent of estimated costs would be spent by children in a cash transfer scheme which targets such households.
Moreover, Table 1 provides vital information about the potential reduction in poverty rates and the poverty gap for the direct recipients, all school-age children, and the total population in Sri Lanka. For instance, a cash transfer scheme providing 50 per cent of the poverty line to all school-age children would reduce the poverty rate for children by 59.57 per cent and for the whole population by 42.94 per cent. After these transfers, the resultant poverty rates (ex-post) for children and the whole population would be 6.96 per cent and 7.72 per cent, respectively.
//Figure 1 About Here//
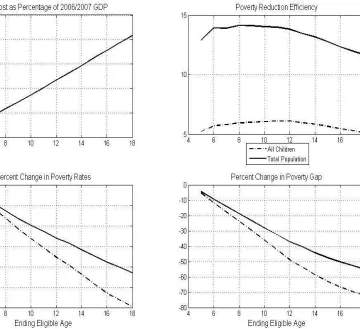
For a cash transfer scheme which provides a benefit of 50 per cent of the official poverty line to all school-age children, Figure 1 is created to show the resultant costs, poverty reduction efficiency, and impact on poverty when varying the maximum eligible age. The total costs of the scheme as a percentage of GDP in 2006/2007 grow approximately linearly as the maximum eligible age of children increases. The percentage of benefits that reduces the poverty gap varies with the maximum eligible age. However, it is always less than 7 per cent for children and less than 15 per cent for the total population. Poverty reduction efficiency tends to decline when increasing the maximum eligible age from 12 to 18 years. The lower panel of Figure 1 shows the reduction of the poverty headcount ratio and poverty gap for all children and the total population as the maximum eligible age of children increases.
//Figure 2 About Here//
Figure 2 presents a universal cash transfer scheme for all children (age from five to 18 years) with the benefit level varying from 5 per cent to 200 per cent of the official poverty line. The total costs required for the benefit payment will increase at a linear rate as the benefit level increases. The percentage of benefits that contribute to reducing the poverty gap for all children and the total population will decline as the benefit level increases. Further, the poverty rate and poverty gap for all children and the total population will continue to decline as the benefit level increases, but the rate of decline slows. In other words, the marginal poverty reduction decreases as the benefit level increases, and even a small benefit can have a significant impact on poverty for all children as well as the total population.
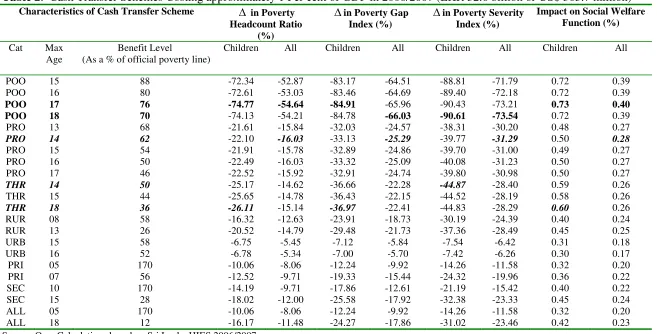
Next, Table 2 shows a number of alternatives for a child cash transfer scheme with a total cost of approximately 1 per cent of GDP. The table shows the targeting category, maximum eligible age of children, and benefit levels of alternative programs together with the impacts on the poverty rate, poverty gap index, poverty severity index, and the social welfare function for children and the total population.
//Table 2 About Here//
of poor children, the benefit level could be 88 per cent if the maximum eligible age is 15 years. However, the benefit level would decrease gradually to 80 per cent, 76 per cent, and 70 per cent as the maximum eligible age increases to 16, 17, and 18 years, respectively. With a fixed budget, this trade off occurs because a larger number of beneficiaries lower the amount of benefits that each beneficiary can receive.
Among the choices presented, the most effective programs can be selected from the list on the basis of the potential impact on poverty measures and welfare for children and the total population. For instance, Table 2 shows that a cash transfer scheme providing a benefit of 76 per cent of the official poverty line to the poor children aged 5-17 would be the most effective in reducing the poverty rate for children and the total population, the poverty gap for children, and increasing welfare for both children and the total population in Sri Lanka. Meanwhile the cash transfer program providing a benefit of 70 per cent of the official poverty line to all the poor children would be the most successful in terms of reducing the poverty gap of the whole population and reducing the poverty severity index for both children and the total population.
Even though targeting the children from poor households would lead to much greater poverty reduction among children and the whole population, policy makers need to think of the potentially high administrative cost required to identify poor households. In a situation where the administrative costs of identifying the poor becomes unbearable, policy makers need to pay attention to other targeting categories. Table 2 also provides additional information on the most effective cash transfer scheme in terms of each criterion if the category “POO” (Children from poor households) is omitted from the analysis. In this case, targeting children in households with at least three school-age children would be the most effective in terms of reducing child poverty and improving child welfare, while targeting children living in the three poorest provinces would be the most effective in reducing poverty and improving welfare among the whole population.
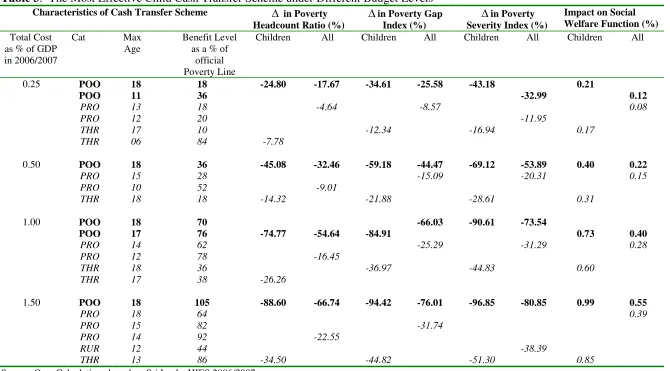
//Table 3 About Here//
poverty and increasing welfare among children across all the spending alternatives. As for the whole population, targeting children in the three poorest provinces in Sri Lanka would be the most successful for most budget allocations.
Table 3 also allows us to quantify the diminishing returns to poverty reduction that we observed in Figure 2. For example, the most effective cash transfer scheme costing about 0.5 per cent of GDP could reduce the child poverty rate by 45.1 per cent. When increasing the total costs by 0.5 percentage points to 1 per cent of GDP, the additional reduction in the poverty rate for children would be 29.7 percentage points, and an additional 0.5 per cent of GDP increase in total costs would further reduce poverty by 13.8 percentage points. As argued earlier, this implies that even with a limited budget for cash transfer schemes, a significant poverty reduction among children and the whole population can be expected.
Impacts of the Proposed Cash Transfer Schemes on School Attendance
Appendix 3 provides extensive details about the determinants of school attendance in Sri Lanka. The overall school attendance rate for children aged from five to 18 years is 84.9 per cent. Further, it is 89.4 per cent for primary school-age children and 82.6 per cent for secondary school-age children. Among the determinants, the variable of most interest in this study, the log of per-capita expenditures, has a positive and statistically significant impact on school attendance at both the primary and secondary levels. This implies that the cash transfer programs aimed at school children which increase household per-capita expenditures could encourage education participation of children at all levels.
Using the estimates provided in the appendix, Table 4 shows alternatives for a cash transfer scheme in Sri Lanka in which the expected spending would be approximately 1 per cent of GDP in 2006/2007. The characteristics of each alternative shown include the targeted category, maximum eligible age of children, and the benefit level as a percentage of the official poverty line, as well as the corresponding simulated impact on the probability to attend schools for children in cash-recipient households and for overall school attendance.
The most effective program can be selected from the list on the basis of desired impact on school attendance. Table 4 shows that the alternative providing a benefit of 70 per cent of the official poverty line to all the children in poor households (Category “POO”) with a maximum eligible age of 18 years would be the most effective in promoting school attendance for both outcome measures. Particularly, this alternative program could increase the probability to attend schools by the children in poor households by 2 per cent while increasing overall school attendance in Sri Lanka by 0.65 per cent. Table 4 also provides additional information in order to facilitate selection of the most successful program if targeting the children from poor households is not administratively feasible. As a second-best outcome, the alternative providing a benefit of 36 per cent of the official poverty line to all the children in households which consist of at least three school-age children (Category “THR”) with maximum eligible age of 18 years would be the most effective, increasing school attendance among children by 0.54 per cent.
Generally, for a given total cost, a greater increase in school attendance, in percentage terms, occurs with larger maximum eligible ages and lower benefit levels. For instance, if we target poor children with a maximum eligible age of 15 years, the program could increase school attendance by 0.38 per cent. However, if we gradually increase the maximum eligible age up to 16, 17, and 18 years, the simulated increase in school attendance would be 0.48 per cent, 0.59 per cent, and 0.65 per cent, respectively, despite falling benefits. In sum, this implies that it would be better to increase the maximum eligible age of children and reduce the benefit level for any given program cost.
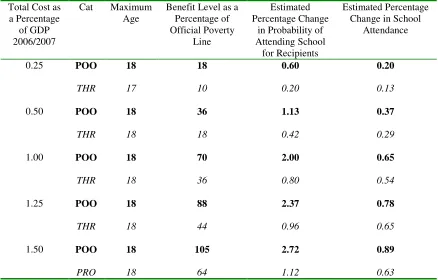
//Table 5 About Here//
reduction, the marginal increase in school attendance declines with increasing expenditures.
These estimates for the increase in school attendance can be thought of as lower bounds if benefit receipt were to include conditions for school attendance. Such requirements would reduce the opportunity costs of schooling, especially at the secondary level. Though initial enrolment rates vary across countries, the earlier discussion of CCT programs suggests that for a country with the initial enrolment rates of Sri Lanka, conditionality may increase attendance by several percentage points.
Concluding Remarks
In this study, we use the Sri Lanka HIES 2006/2007 to perform an ex-ante evaluation of unconditional cash transfer schemes for children. We find that targeting the children in poor households would be the most effective in terms of reducing poverty among children and the whole population and increasing school attendance. Universal schemes generally do not provide such favourable results. This finding is robust across various spending levels. In a situation where targeting only poor children becomes impossible, targeting the children in households which consist of at least three school-age children would generate the best results for improving the social welfare of children and the rate of school attendance. This finding is also quite robust. Further, we found that even with a small budget allocation and small benefit level, we can expect a significant reduction in poverty among children and the whole population, and a noticeable increase in school attendance. We determine that it would be better to increase the maximum eligible age of children and reduce benefit levels for any given scheme and cost in order to produce a bigger impact on poverty and schooling.
Table 1: Estimated Impacts of the Proposed Cash Transfer Schemes. A Cash Transfer of 50 Per cent of the Poverty Line provided to Eligible Children Aged from Five to 18 years.
Indicators ALL PRI SEC POO PRO URB RUR THR
Total Benefits Paid (LKR billion) 135.40 47.10 88.20 23.10 38.10 36.60 98.80 45.80
As a Per cent of GDP 4.15 1.45 2.71 0.71 1.17 1.12 3.03 1.41
% Spent by Recipients 43.32 27.50 37.72 45.80 44.03 42.98 43.45 56.47
% Spent by School-Age Children 43.32 40.66 44.75 45.80 44.03 42.98 43.45 56.47
% Spent by Non-Children 56.68 59.34 55.25 54.20 55.97 57.02 56.55 43.53
Direct Recipients
Ex-Ante Poverty Rate (%) 17.22 17.70 16.97 100.00 27.92 7.68 20.65 26.67
Ex-Post Poverty Rate (%) 6.96 11.00 8.06 40.43 12.72 2.77 8.47 8.65
% Change Poverty Rate -59.57 -37.84 -52.51 -59.57 -54.45 -63.92 -58.99 -67.56
Ex-Ante Poverty Gap Index 3.50 3.80 3.40 20.60 6.30 1.40 4.30 5.90
Ex-Post Poverty Gap Index 1.00 1.90 1.20 5.70 1.90 0.40 1.20 1.20
% Change Poverty Gap Index -72.40 -49.42 -65.00 -72.40 -69.70 -73.38 -72.29 -80.22
School-Age Children
Ex-Ante Poverty Rate (%) 17.22 17.22 17.22 17.22 17.22 17.22 17.22 17.22
Ex-Post Poverty Rate (%) 6.96 13.52 10.11 6.96 12.83 15.92 8.26 11.15
% Change Poverty Rate -59.57 -21.52 -41.31 -59.57 -25.50 -7.54 -52.04 -35.26
Ex-Ante Poverty Gap Index 3.50 3.50 3.50 3.50 3.50 3.50 3.50 3.50
Ex-Post Poverty Gap Index 1.00 2.50 1.70 1.00 2.30 3.30 1.30 2.00
% Change Poverty Gap Index -72.40 -29.72 -51.79 -72.40 -36.03 -7.68 -64.73 -44.64
Total Population
Ex-Ante Poverty Rate (%) 13.53 13.53 13.53 13.53 13.53 13.53 13.53 13.53
Ex-Post Poverty Rate (%) 7.72 11.31 9.65 7.72 11.05 12.70 8.54 10.78
% Change Poverty Rate -42.94 -16.39 -28.67 -42.94 -18.28 -6.08 -36.86 -20.29
Ex-Ante Poverty Gap Index 2.60 2.60 2.60 2.60 2.60 2.60 2.60 2.60
Ex-Post Poverty Gap Index 1.20 2.00 1.70 1.20 1.90 2.50 1.40 1.90
% Change Poverty Gap Index -55.21 -23.33 -37.48 -55.21 -27.37 -6.35 -48.86 -27.23
Poverty Reduction Efficiency (Percentage of Total Cost that Reduces Poverty Gap)
Recipients -5.10 -3.68 -4.42 -29.85 -8.86 -2.04 -6.23 -9.31
Children -5.10 -6.01 -5.59 -29.85 -8.86 -2.04 -6.23 -9.31
Total Population -11.63 -14.11 -12.11 -68.10 -20.14 -5.05 -14.06 -17.01
[image:19.842.92.766.113.495.2]Table 2: Cash Transfer Schemes Costing approximately 1 Per cent of GDP in 2006/2007 (LKR 32.6 billion or US$ 303.7 million) Characteristics of Cash Transfer Scheme ∆ in Poverty
Headcount Ratio (%)
∆in Poverty Gap Index (%) ∆
in Poverty Severity Index (%)
Impact on Social Welfare Function (%)
Cat Max Age
Benefit Level
(As a % of official poverty line)
Children All Children All Children All Children All
POO 15 88 -72.34 -52.87 -83.17 -64.51 -88.81 -71.79 0.72 0.39
POO 16 80 -72.61 -53.03 -83.46 -64.69 -89.40 -72.18 0.72 0.39
POO 17 76 -74.77 -54.64 -84.91 -65.96 -90.43 -73.21 0.73 0.40
POO 18 70 -74.13 -54.21 -84.78 -66.03 -90.61 -73.54 0.72 0.39
PRO 13 68 -21.61 -15.84 -32.03 -24.57 -38.31 -30.20 0.48 0.27
PRO 14 62 -22.10 -16.03 -33.13 -25.29 -39.77 -31.29 0.50 0.28
PRO 15 54 -21.91 -15.78 -32.89 -24.86 -39.70 -31.00 0.49 0.27
PRO 16 50 -22.49 -16.03 -33.32 -25.09 -40.08 -31.23 0.50 0.27
PRO 17 46 -22.52 -15.92 -32.91 -24.74 -39.80 -30.98 0.50 0.27
THR 14 50 -25.17 -14.62 -36.66 -22.28 -44.87 -28.40 0.59 0.26
THR 15 44 -25.65 -14.78 -36.43 -22.15 -44.52 -28.19 0.58 0.26
THR 18 36 -26.11 -15.14 -36.97 -22.41 -44.83 -28.29 0.60 0.26
RUR 08 58 -16.32 -12.63 -23.91 -18.73 -30.19 -24.39 0.40 0.24
RUR 13 26 -20.52 -14.79 -29.48 -21.73 -37.36 -28.49 0.45 0.25
URB 15 58 -6.75 -5.45 -7.12 -5.84 -7.54 -6.42 0.31 0.18
URB 16 52 -6.78 -5.34 -7.00 -5.70 -7.42 -6.26 0.30 0.17
PRI 05 170 -10.06 -8.06 -12.24 -9.92 -14.26 -11.58 0.32 0.20
PRI 07 56 -12.52 -9.71 -19.33 -15.44 -24.32 -19.96 0.36 0.22
SEC 10 170 -14.19 -9.71 -17.86 -12.61 -21.19 -15.42 0.40 0.22
SEC 15 28 -18.02 -12.00 -25.58 -17.92 -32.38 -23.33 0.45 0.24
ALL 05 170 -10.06 -8.06 -12.24 -9.92 -14.26 -11.58 0.32 0.20
ALL 18 12 -16.17 -11.48 -24.27 -17.86 -31.02 -23.46 0.42 0.23
Source: Own Calculations based on Sri Lanka HIES 2006/2007
Table 3: The Most Effective Child Cash Transfer Scheme under Different Budget Levels Characteristics of Cash Transfer Scheme ∆ in Poverty
Headcount Ratio (%) ∆
in Poverty Gap
Index (%) ∆
in Poverty Severity Index (%)
Impact on Social Welfare Function (%) Total Cost
as % of GDP in 2006/2007
Cat Max
Age
Benefit Level as a % of
official Poverty Line
Children All Children All Children All Children All
0.25 POO 18 18 -24.80 -17.67 -34.61 -25.58 -43.18 0.21
POO 11 36 -32.99 0.12
PRO 13 18 -4.64 -8.57 0.08
PRO 12 20 -11.95
THR 17 10 -12.34 -16.94 0.17
THR 06 84 -7.78
0.50 POO 18 36 -45.08 -32.46 -59.18 -44.47 -69.12 -53.89 0.40 0.22
PRO 15 28 -15.09 -20.31 0.15
PRO 10 52 -9.01
THR 18 18 -14.32 -21.88 -28.61 0.31
1.00 POO 18 70 -66.03 -90.61 -73.54
POO 17 76 -74.77 -54.64 -84.91 0.73 0.40
PRO 14 62 -25.29 -31.29 0.28
PRO 12 78 -16.45
THR 18 36 -36.97 -44.83 0.60
THR 17 38 -26.26
1.50 POO 18 105 -88.60 -66.74 -94.42 -76.01 -96.85 -80.85 0.99 0.55
PRO 18 64 0.39
PRO 15 82 -31.74
PRO 14 92 -22.55
RUR 12 44 -38.39
THR 13 86 -34.50 -44.82 -51.30 0.85
Figure 1: Varying the Maximum Eligible Age for a Universal Cash Transfer Scheme with Benefits of 50 Per cent of the Official Poverty Line for the Children Aged from five to 18 years.
[image:22.595.141.501.167.496.2]Figure 2: Varying the Benefit Level for a Universal Cash Transfer Scheme with Benefits for All Children Aged from five to 18 years.
[image:23.595.268.502.161.484.2]Table 4: Choices for the Cash Transfer Program Costing Approximately 1 Per cent of GDP in 2006/2007 (LKR 32.6 billion or US$ 303.7 million)
Cat Max Age
Benefit Level as a Percentage of Official
Poverty Line
Estimated Percentage Change
in Probability of Attending School for
Recipients
Estimated Percentage Change in Overall School Attendance
ALL 18 12 0.19 0.37
ALL 16 14 0.15 0.26
ALL 07 56 0.24 0.10
PRI 07 56 0.24 0.10
PRI 06 84 0.52 0.13
PRI 05 170 2.00 0.19
SEC 15 28 0.21 0.21
SEC 14 34 0.17 0.14
SEC 13 42 0.13 0.09
PRO 17 46 0.70 0.39
PRO 16 50 0.61 0.32
PRO 15 54 0.50 0.24
POO 18 70 2.00 0.65
POO 17 76 1.83 0.59
POO 16 80 1.54 0.48
POO 15 88 1.27 0.38
THR 18 36 0.80 0.54
THR 17 38 0.72 0.47
THR 15 44 0.49 0.28
THR 14 50 0.40 0.21
URB 18 44 0.48 0.25
URB 17 48 0.41 0.21
RUR 13 26 0.13 0.13
RUR 07 78 0.36 0.11
Source: Own Calculations based on Sri Lanka HIES 2006/2007
[image:24.595.82.513.134.562.2]Table 5: The Impact of Cash Transfer Programs on School Attendance: Results for the Best Program Under Varying Budget Levels
Total Cost as a Percentage
of GDP 2006/2007
Cat Maximum Age
Benefit Level as a Percentage of Official Poverty
Line
Estimated Percentage Change
in Probability of Attending School
for Recipients
Estimated Percentage Change in School
Attendance
0.25 POO 18 18 0.60 0.20
THR 17 10 0.20 0.13
0.50 POO 18 36 1.13 0.37
THR 18 18 0.42 0.29
1.00 POO 18 70 2.00 0.65
THR 18 36 0.80 0.54
1.25 POO 18 88 2.37 0.78
THR 18 44 0.96 0.65
1.50 POO 18 105 2.72 0.89
PRO 18 64 1.12 0.63
Source: Own Calculations based on Sri Lanka HIES 2006/2007
References
Arunatilake, N. (2006) Education Participation in Sri Lanka-Why all are not in School. International Journal of Educational Research, 45(3) (2006), pp. 137-152.
Barber S.L. and Gertler P.J. (2010) Empowering women: how Mexico’s conditional cash transfer program raised prenatal care quality and birth weight. Journal of Development Effectiveness, 2(1), pp. 51-73.
Barrientos, A. and Dejong, J. (2004) Child Poverty and Cash Transfers. CHIP Report, No.4, Childhood Poverty Research and Policy Centre, London.
Bourguignon, F., Ferreira, F.H.G., and Leite, P.G. (2002) Ex-ante Evaluation of Conditional Cash Transfer Programs: The Case of Bolsa Escola. World Bank Policy Research Working Paper, No. 2916, Washington, DC.
Central Bank of Sri Lanka (2009) Annual Report (Colombo: Central Bank of Sri Lanka).
Department of Census and Statistics of Sri Lanka (2008) Final Report on Household Income and Expenditure Survey (HIES) 2006/2007, Colombo.
Forster, M.E. and Toth, I.G. (2001) Child Poverty and Family Transfers in the Czech Republic, Hungary, and Poland. Journal of European Social Policy, 11(4), pp. 324-341
Foster, J., Greer, J., and Thorbecke, E. (1984) A Class of Decomposable Poverty Measures. Econometrica, 52(3), pp.761-766
Garcia S. and Hill J. (2010) Impact of conditional cash transfers on children’s school achievement: evidence from Colombia. Journal of Development Effectiveness, 2(1), pp.117-137.
Giang, L.T. and Pfau, W.D. (2009) Ageing, Poverty and the Role of a Social Pension in Vietnam. Development and Change, 40(2), pp. 333-360.
Glinskaya E. (2000) An Empirical Evaluation of Samurdhi Program. Sri Lanka Poverty Assessment Report, No.22-535-CE, World Bank, Washington, DC.
ILO (2000) World Labour Report, International Labour Office, Geneva, accessed at:
http://www.ilo.org/wcmsp5/groups/public/---dgreports/---comm/documents/publication/kd00059.pdf
Kakwani, N., Soares, F., and Son, H.H. (2006) Cash Trasfers for School-Age Children in African Countries: Simulation of Impacts on Poverty and School Attendance. Development Policy Review, 24(5), pp. 553-569
Kakwani, N., Soares, F., and Son, H.H. (2005) Conditional Cash Transfers in African Countries. Working Paper, No.6, International Poverty Centre, Brasilia.
Khanam, R. and Ross, R. (2005) Child Work and Other Determinants of School Attendance and School Attainment in Bangladesh. MPRA Paper, No. 9397, Munich, Germany. Accessed at: http://mpra.ub.uni-muenchen.de/9397/
Maluccio, J.A., Murphy A., Regalia F. (2010) Does supply matter? Initial schooling conditions and the effectiveness of conditional cash transfers for grade progression in Nicaragua. Journal of Development Effectiveness, 2(1), pp.87-116.
Rawlings, L. and Rubio, G.M. (2005) Evaluating the Impact of Conditional Cash Transfer Programs. World Bank Research Observer, 20(1), pp. 129-155.
Son, H.H. and Florentino, J. (2008) Ex-anteImpact Evaluation of Conditional Cash Transfer Program on School Attendance and Poverty: The case of Philippines. ADB Economics Working Paper Series, No.142, Asian Development Bank, Manila.
Soares F.V., Soares S., Medeiros M., Osorio R.G. (2006) Cash transfer programs in Brazil: impacts on poverty and inequality. International Poverty Centre Working Paper, No.21, Brasilia.
Tabor, S.R. (2002) Assisting the poor with Cash: Design and Implementation of Social Transfer Programs. Social Protection Discussion Paper, No. 0223, World Bank, Washington, DC.
UNESCO (2008) Data Tables of School Enrolment Ratios by ISCED Level. Paris, France. Accessed at: http://stats.uis.unesco.org/unesco/TableViewer/tableView.aspx?ReportId=178
UNICEF (2000) Poverty Reduction Begins with Children. New York. Accessed at: http://www.unicef.org/publications/files/pub_poverty_reduction_en.pdf
UNICEF (2009) Child Poverty: A Role for Cash Transfers? West and Central Africa. UNICEF Regional Office for West and Central Africa, Dakar. Accessed at:
http://www.unicef.org/wcaro/wcaro_UNICEF_ODI_3_Cash_Transfers.pdf
United Nations (2009) World Population Prospects: The 2008 Revision Population Database. United Nations Population Division, New York. Accessed at: http://esa.un.org/unpp/
White, H. (2009) Theory-based impact evaluation: principles and practice. Journal of Development Effectiveness, 1(3), pp.271-284.
Appendix 1. Data Description
The Sri Lanka Household Income and Expenditure Survey [Sri Lanka HIES] 2006/2007 covers all the districts in Sri Lanka except the Northern Province and Trincomalee district in the Eastern Province. According to the DCS (2008), the data were collected through direct personal interviews using a schedule consisting of sections of demographic characteristics, health, education, household expenditures, and household income. Some information is available at the individual level, while other data are available only at the household level. For instance, the data on demography, schooling health, and income earned from various sources are collected and recorded at the individual level. However, the data on expenditures, inventory of durable goods, debts, basic facilities, and housing are available only at the household level. The survey captures information for 76,723 individuals from 18,544 households in Sri Lanka. Among these are 19,104 school-age children (age from five years to 18 years) of whom 6,644 are of primary school age (age from five years to nine years) and 12,460 are of secondary school age (age from 10 years to 18 years).
Appendix 2. Details on Poverty Measures and Poverty in Sri Lanka
are computed by the Department of Census and Statistics, and they range from LKR 1959 to LKR 2623 on a per-capita basis across regions.
Regarding the FGT poverty measures, the poverty headcount ratio is the proportion of the population whose per-capita expenditures are below their official poverty line. The poverty gap index measures the extent to which household expenditures fall below the poverty line (it is zero for the non-poor), and the total poverty gap indicates the total amount of expenditures necessary to remove all people from poverty. Poverty severity puts extra weight on those experiencing more extreme poverty by averaging the squares of the poverty gap index values.
Table A1 presents the poverty status for children in Sri Lanka. Among children (age from five years to 18 years), approximately 17.22 per cent are living below the official poverty line, though the same figure for the whole population is 13.53 per cent. The poverty gap index and poverty severity index are higher for children as well.
//Table A1 About Here//
The poverty status among children varies across socio-economic subgroups including ethnicity, living area in terms of urban-rural division and provincial division, and whether the child attends school. As can be observed in Table A1, when compared with the children of other ethnicities, Tamil children are considerably poorer. Approximately 27.34 per cent of Tamil children are living below the official poverty line, while the matching figure for children in the Sinhala ethnic group is 15.55 per cent. In addition, poverty among children living in rural areas is far higher than that among urban children. The poverty headcount index for rural children is approximately 2.68 times higher than their urban counterparts. Across provinces, the Sabaragamuwa province reports the highest child poverty headcount ratio, with more than one-third of children living in poverty. Poverty among children not attending school is higher as well, as such children experience a poverty rate of about 22.1 per cent, compared to 16.4 per cent for children in school.
Appendix 3. Determinants of School Attendance
Otherwise 0, ) ( if
1 ' ' '
= > + + + + + = i i i i ci pi i i attend c PCE
attend δ β Ζ θΖ γ Η α ε
With the assumption of ~ (0, 2)
σ εi N :
)) ( ( ) , , , | 1
Pr(attendi = Ζpi Ζci Ηi PCEi =Φ ϕi +β'Zpi +θ'Zci +γ'Hi +α PCEi (A1)
where (.)Φ is the cumulative standard normal distribution.
In Equation A1, PCEiis the per-capita expenditure per month of child i’s household,
and it is removed from Ηito emphasize its importance. The variable attendiis a binary
variable which takes one when a child attends school and zero when a child does not attend school. The parameter of interest isα , which shows the impact of per-capita
expenditures on the school attendance of children. We specifically seek the marginal effect of PCEi onattendi as follows:
α α γ θ β ϕ
φ( )
) , , , | 1 ( on of effect Marginal ' ' '
i pi ci i i
i i i ci pi i PCE PCE PCE attend pr attend PCE + + + + = ∂ = ∂ = H Z Z H Z Z (A2)
where (.)φ is the standard normal distribution.
We can simulate the average difference in probability to attend school ( Pr∆ ) for any cash transfer program as follows:
) ~ ( ) ( Pr ) , ~ | 1 ( ) , | 1 ( Pr 0
0 X X
X X
X pce
X
pce pce pce
e pc attend pr pce attend pr ∧ ∧ ∧ ∧ ∧ ∧ ∧ ∧ + + Φ − + + Φ = ∆ = − = = ∆ β β β β β β (A3) Where pce~ and pce are per-capita expenditures before and after the cash transfer scheme and X is the vector of other explanatory variables except per-capita expenditures. The difference between pce and pce~ is the added per-capita
Lanka Sri in Attendees School
Total * Sample in
Attendees School
Total
Pr
1
∑
=∆
n
i i
(A4)
Where i represents each school-age child under each cash transfer program. The increase in school attendance is calculated as a percentage of the number of actual school attendees.
Before providing the probit model estimates, we will first describe the general background for school enrolment in Sri Lanka. The public sector of Sri Lanka is operating a system for formal education through a nation-wide network of approximately 10,000 public schools, in which approximately 3.9 million pupils are studying at the primary and secondary levels. More than 99 per cent of the schools are public schools, leaving a minor role for the private sector. Since the free education legislation of 1945, education has been free up to the first degree university level. However, in spite of the large sums spent by the government, Sri Lanka has not achieved universal school enrolment for children aged from five to 18 years. As shown in Table A2, the school attendance rate for children aged from five to 18 years is 84.9 per cent. Further, it is 89.4 per cent for primary school-age children and 82.6 per cent for secondary school-age children. Table A2 also shows that school attendance rates vary across socio-economic subgroups in terms of gender, ethnicity, sector, poverty status, province, and age.
//Table A2 About Here//
Females and urban children are slightly more likely to attend schools. The Tamil ethnic group and poor households are found to be less likely to send children to school. There are also some differences across provinces. The rate of school attendance also differs depending on the age of children. The pattern in the percentage of children not attending schools by age exhibits a U-shape curve, as the percentage of children not attending schools falls from five to seven years, is steady at a low level between eight and 11 years, and rises sharply afterward.
//Table A3 About Here//
The results of a link test show that the models are correctly specified for the primary and secondary schooling equations, though a specification problem arises in the overall schooling equation. The Link test is used after probit estimation to examine whether the model is properly specified. In our models, “_hat” is significant for all cases. However, “_hatsq” is significant for the overall schooling model (P-value=0.00), while it is not significant for the primary and secondary schooling models (P-values are 0.12 and 0.68, respectively). This means that the overall schooling model has some specification errors. Moreover, Chow test results show that the impacts of explanatory variables on school attendance are different for primary and secondary schooling. The Chow test examines whether parameters for one group are different from those of another group. The null hypothesis that the parameters are the same is tested with the pooled dataset. The computed F-statistic for the test is 51.94. Since the corresponding critical value of F is 1.57, the null hypothesis is rejected at the 5 percent significance level in favour of two separate estimations for primary and secondary school. Thus, there is no reason to assume that both levels of schooling have the same coefficients for their explanatory variables. Accordingly, this explains why we estimate the determinants of school attendance separately for primary school-age children and for secondary school-age children.
The empirical results for the determinants of school attendance are reported in Table A4. In order to facilitate the interpretation of results, the marginal impacts are shown together with the corresponding robust standard errors.
//Table A4 About Here//
Table A1: Poverty Status of School-Age Children
Percentage of Total School-Age
Children (%)
Poverty Headcount
Index (%)
Poverty Gap Index
Poverty Severity Index
School Children 100.00 17.22 3.55 1.10
Gender Male 49.99 16.83 3.38 1.03
Female 50.01 17.62 3.71 1.18
Ethnicity Sinhala 69.37 15.55* 3.16 0.97
Tamil 16.62 27.34* 6.15 2.01
Other 14.01 13.49* 2.38 0.69
Sector Urban 26.44 7.68* 1.40 0.40
Rural 73.56 20.65* 4.32 1.36
Province Western 25.80 9.00* 1.72 0.50
Central 12.47 21.61* 4.59 1.38
Southern 19.80 14.20* 2.58 0.72
Eastern 9.50 14.66* 2.60 0.72
North Western 9.78 16.10* 2.93 0.90
North Central 6.24 16.86* 3.53 1.11
Uva 8.18 31.09* 7.64 2.77
Sabaragamuwa 8.23 34.33* 7.72 2.53
Age Group Primary (5-9) 34.78 17.70 3.77 1.19
Secondary(10-18) 65.22 16.97 3.43 1.06
Status of Schooling
Attending Not Attending
84.95 15.05
16.40* 22.10*
3.33 4.76
1.02 1.57
Sample Size 19,104
Source: Own Calculations based on Sri Lanka HIES 2006/2007
Note: Official district poverty lines have been used for determining poverty status. Poverty measures are
calculated using the official per-capita expenditure equivalence scale. According to our calculations, the
headcount ratio, poverty gap index, and poverty severity index for Sri Lanka at the national level are
13.53 per cent, 2.65, and 0.80, respectively.
Table A2: Percentage of Children Attending School for Key Characteristics
Overall Schooling
18 5≤age≤
Primary Schooling
9 5≤age≤
Secondary Schooling
18 10≤age≤
Sri Lanka 84.9 89.4 82.6
Gender Male 84.4* 89.1 81.9*
Female 85.5* 89.6 83.3*
Ethnicity Sinhala 86.7* 90.1* 84.9*
Tamil 78.4* 85.5* 74.6*
Other 84.0* 90.3* 80.2*
Sector Urban 85.8* 90.2 83.6
Rural 84.6* 89.1 82.2
Poverty Status Poor Households 80.7* 87.6* 76.9*
Non-poor Households 85.8* 89.7* 83.8*
Province Western 85.1* 90.4* 82.1*
Central 85.5* 86.6* 84.9*
Southern 85.8* 89.9* 83.6*
Eastern 84.8* 91.0* 81.4*
North Western 83.1* 87.9* 80.4*
North Central 87.8* 91.4* 86.0*
Uva 85.3* 90.2* 82.9*
Sabaragamuwa 81.6* 86.6* 79.3*
Age (in years) 5 52.4*
6 97.8*
7 99.0*
8 98.6*
9 99.5*
10 98.9*
11 98.3*
12 97.6*
13 96.9*
14 94.4*
15 89.1*
16 69.1*
17 55.4*
18 42.8*
Sample Size 19,104
Source: Own calculations based on Sri Lanka HIES 2006/2007
Table A3: Descriptions for Variables
Variable Description Mean
attend If an school-age child is attending school=1, otherwise=0 0.85
gender Gender of individuals (Male=1 Female=0) 0.50
age Age of individuals in years 11.56
age_sq (age-mean age)^2 16.22
child_of hhh Biological relationship to the household head (Child of household head=1, otherwise=0)
0.82
ethnic_sinhala Ethnicity of individual is Sinhala=1, otherwise=0 0.69
ethnic_tamil Ethnicity of individual is Tamil=1, otherwise=0 0.17 ethnic_other Ethnicity of individual is neither Sinhala nor Tamil=1,
otherwise=0
0.14
head_age Age of household head in years 46.97
head_age_sq (head_age-mean of head_age)^2 131.43
head_gender Gender of household head (Male=1, Female=0) 0.80 hh_primary Household head is schooled only up to primary level=1,
otherwise=0
0.30
hh_secondary_and_above Household head’s level of education is secondary level or more=1, otherwise=0
0.65
hh_no_sch Household head has no schooling=1, otherwise=0 0.06
hh_emp_formal Household head is employed in the formal sector=1, otherwise=0
0.52
hh_emp_informal Household head is employed in the informal sector=1, otherwise=0
0.46
hh_emp_employer Household head is an employer=1, otherwise=0 0.03
sector urban=1, rural=0 0.26
no_elderly_dependents Number of people in each household whose age is 65 or above 0.21
no_children Number of people in each household whose age is 18 or below 2.55
livelihood_emp Household’s main livelihood is salaried employment=1, otherwise=0
0.50
livelihood_agri Household’s main livelihood is agriculture=1, otherwise=0 0.16
livelihood_other Household’s main livelihood is neither employment nor agriculture=1, otherwise=0
0.34
pce Per-capita expenditure per month in Sri Lankan Rupees 5150.05
ln_pce Natural logarithm of “pce” 8.30
Table A4: School Attendance at Overall, Primary, and Secondary Schooling Levels (Marginal Effects from the Probit Regression)
Variable Overall Schooling
Primary Schooling
Secondary Schooling
gender (M=1, F=0) -0.01*** -0.0004 -0.02***
(0.0037) (0.0033) (0.0047)
age -0.01*** -0.17*** -0.04***
(0.0005) (0.01) (0.0031)
age_sq -0.01*** -0.02*** -0.0037***
(0.0002) (0.0018) (0.0006)
child_of_hhh 0.07*** 0.02* 0.07***
(0.01) (0.01) (0.01)
Ethnicity ethnic_sinhala 0.04*** -0.0013 0.06***
[Base
ethnic_others]
(0.01) (0.0050) (0.01)
ethnic_tamil -0.01 -0.02** 0.01
(0.01) (0.01) (0.01)
head_age 0.0022*** 0.0006** 0.0027***
(0.0002) (0.0002) (0.0003)
head_age_sq -0.0000 0.0000 -0.0000
(0.0000) (0.0000) (0.0000)
head_gender (M=1 F=0) 0.0039 -0.0021 0.01
(0.01) (0.0045) (0.01)
Household hh_primary 0.04*** 0.03*** 0.03***
Head’s Education (0.01) (0.01) (0.01)
[Base hh_no_sch] hh_secondary_and_above 0.10*** 0.05*** 0.11***
(0.01) (0.01) (0.01)
Household Head’s hh_emp_formal 0.03* 0.02* 0.02
Employment (0.01) (0.01) (0.02)
[Base
hh_emp_employer]
hh_emp_informal 0.02
(0.01)
0.02 (0.01)
0.01 (0.02)
sector (urban=1 rural=0) 0.01 0.0016 0.01
(0.0046) (0.0040) (0.01)
no_elderly_dependents 0.0030 0.0009 0.01
(0.0050) (0.0046) (0.01)
no_children 0.0019 -0.0006 0.0031
(0.0017) (0.0017) (0.0021)
Main Livelihood of livelihood_emp -0.02** -0.0003 -0.02***
Household (0.01) (0.0047) (0.01)
[Base
livelihood_other]
livelihood_agri 0.01
(0.01)
0.0016 (0.01)
0.01 (0.01) ln_pce 0.03*** 0.01** 0.05***
(0.0038) (0.0033) (0.0049)
Log likelihood -5322.19 -1264.50 -3668.91
Sample Size 19,104 6,644 12,460
Source: Own Calculations based on Sri Lanka HIES 2006/2007