Empirical Modelling of Solid-blocking Effect in a Blazka
Respirometer for Gag, a Large Demersal Reef Fish
Richard J. Kline
1,*, Daryl C. Parkyn
2, Debra J. Murie
21Marine & Coastal Sciences, University of Texas Rio Grande Valley, USA
2Program of Fisheries & Aquatic Sciences, School of Forest Resources & Conservation, University of Florida, USA *Corresponding Author: [email protected]
Copyright © 2015 by authors, all rights reserved. Authors agree that this article remains permanently open access under the terms of the Creative Commons Attribution License 4.0 International License
Abstract
The effect of solid-body blocking in a large (257 l) Blazka-style respirometer was examined in gagMycteroperca microlepis. Gag ranging from 376-690 mm total length were tested at velocities from 10 to 91 cm s-1. The solid blocking effect (SBE) due to fish size, swimming speed, and water temperature was investigated by direct measurement of flow velocity at the area of the fish’s maximum girth as compared to measurements at the rear (center) of the swimming chamber. Three models were compared as corrections for the SBE: the standard Bell and Terhune (BT), a novel modification of the Bell and Terhune (MBT) developed in this study, and the Bernoulli equation. Although the fit was good, the commonly used BT model consistently underestimated solid-blocking effect over the speeds tested (R2adj = 0.980) whereas the MBT and Bernoulli models provided better fits (both with R2adj = 0.993). The MBT model, with refined parameters for the fish body shape coefficient and fractional surface area exponent, yielded the best fit for observed data across all speeds for which gag were tested. This study also demonstrated that in Blazka-style respirometers, corrections were needed to account for SBE where fish occupied >10% of the cross-sectional area of the swimming chamber.
Keywords
Solid-blocking, Respirometry, Swimming Energetics, Blazka Respirometer, Gag, Grouper,Mycteroperca
1. Introduction
Metabolic rates for fishes are most commonly quantified using swim tunnel respirometers, following the designs of either Brett[1] or Blazka et al. [2] (for a review of respirometer designs, see Brett [3]). The Brett-style respirometer consists of a single, closed-circuit loop of water driven by a pump or propeller (e.g., [1,4]). In contrast, the Blazka-respirometer uses a propeller to drive the water in a concentric, tube within a tube, design [2,5,6]. This design,
while less frequently employed than the Brett respirometer, is useful when a lower volume of water or a smaller footprint is needed. For example, a measurable drop in oxygen content of the water is obtained more quickly during swimming trials in a Blazka-respirometer because of the smaller water volume. This can be useful with fish that have a relatively low metabolic demand (e.g., relatively sedentary demersal fishes).
This consideration is important when studying many larger reef fishes, such as the groupers and snappers, which typically have moderately compressed body forms that present a relatively large cross-sectional area at the point of maximum girth.
In addition, the effect of temperature on water flow velocities and SBE due to changes in water viscosity have not been addressed in previous studies. Temperature may need to be considered when calibrating a swimming chamber for SBE for larger reef fishes that would naturally experience wide ranges in water temperature. Gag Mycteroperca microlepis is well-suited to test for temperature effects in solid-blocking during swimming trials because it is a relatively large reef fish that typically experiences seasonal temperature fluctuations of 15 °C or more on shallow reefs in the Gulf of Mexico [18].
The present study provides the first quantification of solid-blocking effect in a Blazka respirometer and compares the efficacy of several models to correct for the effects of this phenomenon. Theoretically-derived models of Bell and Terhune [4] and Bernoulli [19] are compared to a novel multivariate derivation of the Bell and Terhune model that is developed in the present study to assess relative fit and biases. Gag, a warm-temperate grouper species with a moderately compressed body shape and a relatively low metabolic scope [18], is used as a model reef fish species to calibrate the SBE.
2. Materials and Methods
2.1. Respirometer Design
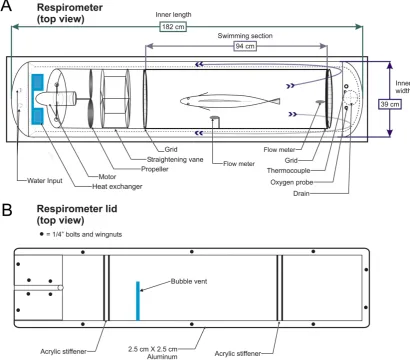
The respirometer used in this study (Figs. 1A and B) was a modification of that presented by Blazka et al. [2]. The volume of the respirometer and diameter of the swimming chamber were selected to accommodate fish over a large range in size, while still permitting measurable decreases in dissolved oxygen consumption within a 30-min swimming trial [18]. The swimming chamber was a 30.5 cm diameter translucent fiberglass tube, 94 cm in length (Fig. 1A), with removable grids (6.5 cm2 mesh) at each end of the swimming section to prevent escape of thefish. A strip of black plastic mesh (10 cm wide) was affixed around the circumference of the swimming tube to provide a visual spatial reference for the fish. The outer shell was constructed from plywood and
foam insulation, coated with fiberglass. All surfaces were coated with non-toxic epoxy paint (Sweetwater PT8, Apopka, FL, USA). The inner dimensions of the outer shell were 39 cm x 182 cm. A variable-speed trolling motor with a maximum thrust of 100 J (74 ft-lbs) (Minn Kota Riptide Rt74, Mankato, MN, USA) was used to move the water, powered by two 12 volt batteries. The motor was mounted in front of the swimming section (Fig. 1A) to a 60 cm section of 30.5 cm diameter PVC pipe, which allowed for the removal and re-installation of the swimming section without moving the motor assembly. A heat-exchanger around the motor housing was used to remove excess heat generated from the motor (Fig. 1A). The respirometer had a volume of 257 l when fully assembled.
The outer wall was sealed using a 6.4 mm flat acrylic lid and gasket (Fig. 1B) attached with wing nuts and bolts. A vent (Fig. 1B) was cut in the lid to purge bubbles trapped in the respirometer as they travelled throughout the outer jacket of the respirometer. When all visible bubbles were evacuated from both chambers, the vent was closed using an acrylic cover and neoprene seal affixed with stainless wing nuts and bolts.
The pattern of flow inside the swimming chamber was modified from helical to rectilinear flow [3] using a 6-bladed vane made of 3 mm PVC (Fig. 1A). Water flow characteristics were observed with plastic streamers attached to the front grate. Water velocity in the swimming section was measured (± 1 cm s-1) using an electromagnetic flow meter (Marsh McBirney Flo-Mate, Model 2000, Frederick, MD, USA) with the probe affixed near the outflow (rear) at the center of the swimming section (Fig. 1A). A second Model 2000 flow meter probe was affixed to the left of the holding position of fish during swimming (Fig. 1A). To compare the flow meter readings between the two positions (forward and rear), ten paired measurements were taken at each speed with no fish present.
Figure. 1. Modified Blazka respirometer for gag showing (A) insulated outer shell, interior and swimming chamber for the fish, with a total volume of 257 l, as well as the placement of flow meters, thermocouple and oxygen probe and (B) acrylic lid with aluminum support-frame, perpendicular acrylic stiffeners and the bubble vent that was sealed during swimming trials.
2.2. Study Animals
Eight gag Mycteroperca microlepis were captured in the eastern Gulf of Mexico near Steinhatchee, FL, and transported to the University of Florida, Fisheries and Aquatic Sciences Aquatic Facility in Gainesville. Fish were fed a ration of chopped fish every other day. All fish were anaesthetized with 150 mg l-1 tricaine methanosulfate (MS-222), measured for total mass (M, to the nearest g), maximum total length (TL, to the nearest mm), and maximum girth (G, to the nearest mm). Fish were injected with a Passive Integrated Transponder tag (Biomark, Boise, ID, USA) in the coelomic cavity for subsequent individual identification. Fish ranged in size from 0.6 - 3.6 kg (1.276 ± 1.628 kg, mean ± SE) and 376 - 690 mm TL (580 ± 108 mm). Gag was tested at two temperatures, 15 and 28°C. Fish were acclimated to each temperature using a change of 1°C per day, followed by a 1-week acclimation period. All fish used in this study were treated in accordance with the animal care and use protocols required by the University of Florida.
2.3. Effect of Solid Blocking
Fish were placed in the swimming chamber of the
respirometer and acclimated overnight at a low rate of flow (10 cm s-1) while the respirometer was run as a flow-through system. The respirometer was closed the next morning, purged, and shielded from any activity in the room using drapes hung from the ceiling. A video camera centered over the fish in the swimming chamber continuously recorded the fish’s activity during each trial. During swimming trials, which started with a water velocity of 10 cm s-1, all reference speeds were measured at the rear center of the swimming chamber. Water velocity measurements were taken every 10 s at the forward and rear flow meters only when the fish was swimming adjacent to the forward flow meter. Water velocity was then increased to 20, 35, 50, 65, and 80 cm s-1, with flow measurements taken at each speed. Gag could not swim in a sustained manner at velocities greater than 80 cm s-1 as measured at the rear center of the chamber so this velocity was therefore set as the maximum water velocity used in all swimming trials. Mean values were calculated for the forward and rear flow data for each tested water velocity for each fish. Swimming behavior and position of the fish were confirmed from video recordings.
for each fish at 15 and 28°C. Any potential difference between temperatures was tested using analysis of covariance (ANCOVA) following a test of slopes [20].
Three blocking-effect models were fit to the data: the standard Bell and Terhune [4] model (BT); our novel modification of the Bell and Terhune (1970) model (MBT) with empirically derived estimates for the surface area coefficient and the fractional area exponent; and a model based on the Bernoulli principle [19]. The BT blocking-effect model was applied to the data as:
(1) where VF is the water velocity at the position of the fish’s maximum girth, VR is the water velocity at the rear the flume, and ∈S is the error due to solid blocking. ∈S was calculated as:
(2)
where τ is a dimensionless factor for tunnel cross-sectional shape (0.8), and λ is a factor for the shape of the fish, where λ= shape coefficient (length/thickness). The shape coefficient was set at 0.5 for a streamlined shape, length is TL, and thickness was calculated as Gp−1. Α
0= the
cross-sectional area of the fish was calculated as: 0.25G2p−1 and AT was the cross-sectional area of the
swimming chamber calculated as pr2 where the radius (r) was 152 mm, and a fractional area exponent (Aexp) of 1.5.
The MBT blocking-effect equation was fit to the data using a nonlinear regression method and an iterative Levenberg-Marquart least squares algorithm (Proc NLIN, v.
8.0, SAS Institute Inc., Cary, NC) to estimate the λ shape
coefficient and the fractional area exponent (Aexp), rather than using fixed values. All other parameters in the MBT model were calculated in the same manner as the BT model.
A third model, based on the Bernoulli principle, was applied to the data as:
(3) where all parameters were defined as in Equations 1 and 2 above.
All three models were assessed for goodness of fit to the data by comparison of adjusted coefficients of determination (adjusted-R2 (R2adj)) values [21] and examination of the model residual plots.
2.4. Precision of Oxygen Consumption Measurements
To assess the measurement of oxygen consumption as a function of water velocity in the respirometer, three gag ranging in size from 1.6 - 3.1 kg (2.345 ± 0.424 kg) and 512 - 625 mm TL (577 ± 59 mm )were used in swimming trials. These fish were held at their capture temperature, 30°C until volitional feeding resumed, typically within 3 - 4 days. All
fish were fasted 36 to 48 h before testing to ensure that any previous meal was evacuated from their gut tract and fish were in a standard state (Brett, 1995). On initiation of each swimming trial, the oxygen electrode (Microelectrodes USA) was calibrated in a 250 ml beaker. Zero calibration of the oxygen electrode was performed using filtered seawater purged for 10 min with nitrogen via an aquarium bubble stone diffuser, and verification that the probe voltage reading was very close to zero. Filtered seawater that was aerated vigorously with an air pump and an aquarium bubble stone for 10 min was considered to be 100% saturated. Calibration temperature was maintained within ± 0.1°C of the respirometer temperature by a temperature-controlled water bath. Dissolved oxygen (DO) saturation values were calculated with DO saturation equations for seawater based on salinity, temperature, and barometric pressure (Benson and Krause, 1984). The oxygen electrode was connected to an A/D interface (Strathkelvin 928, Glasgow, UK) and computer for data logging. Temperature was monitored with a thermocouple and meter (Physitemp BAT-12, Clifton, NJ). Changes in dissolved oxygen concentration were recorded for each gag in swimming trials for six successive 30-min periods of 10, 20, 35, 50, 65 and 80 cm s-1. A 20-min rest period of 12 to 15 cm s-1was given between speeds ≥ 20 cm s-1 to allow the respirometer to be replenished to >95% saturation. The oxygen electrode was recalibrated at each rest period. Water velocity was measured every 10 s during the first ~5 min of each speed trial and rechecked at the end of each trial to ensure that the speed had been maintained. When DO approached 80% saturation, DO measurement was concluded; however, the fish continued to complete the swim period with the respirometer valves opened to standardize swimming time at each speed. Each swimming trial was concluded when 30 min of swimming was completed at each speed or the fish was no longer able to swim against the water current (i.e., fish positioned itself on the back grid of the swimming section).
Oxygen consumption rate (VO2) in mg O2 h-1 was calculated at each water velocity by linear regression from a timed portion of the swimming trial where the fish was swimming in a consistent manner for 15 min. Biological oxygen demand (BOD) was measured immediately after the fish was removed from the respirometer. The BOD rate was subtracted from the calculated oxygen consumption rate, for each speed. The respirometer and the reservoir were drained and cleaned with a 5% solution of bleach (NaOCl) and neutralized with sodium thiosulfate (NaHSO2) following each series of swim trials.
To calculate oxygen consumption rate in relation to body mass, gag were anesthetized with seawater-buffered MS-222 (Argent Laboratories, Redmond, WA) at a concentration of 50 mg-1 after the swimming trials and measured for weight and TL. Oxygen consumption data was scaled by dividing by weight. Swimming speed in cm s-1 was scaled to body length (BL) s-1 by dividing by fish individual TL measurements. Data of oxygen consumption (mgO2kg-1) as a function of swimming speed (TL s-1) were then fit with separate
(
1
)
F R S
V
=
V
+ ∈
exp 0 A S T
A
A
τλ
∈ =
(
)
F T R
exponential functions.
As a test of the repeatability of oxygen consumption measures on gag, three fish were tested twice, after an intervening per of 4 d. Fish were fed at least once during this period before retesting and were treated in the same fashion as the first swimming trial. Individual fish data for two different days were plotted together on a chart and each day was fit with an exponential regression line.
3. Results
3.1. Respirometer Performance
Video of the flow characteristics of the empty flume with streamers attached to the front grid revealed rectilinear and slightly turbulent flow, as recommended by Brett [3]. Empty, the respirometer could achieve velocities ranging from 0 cm s-1 to 110 cm s-1. Gag readily swam in the respirometer after an overnight acclimation period. Swimming behavior ranged from positive rheotaxis at 10 cm s-1 to steady swimming at the highest speeds. The addition of a black plastic mesh as a
positioning reference greatly improved the consistency of positioning of the fish in the swimming chamber. Gag invariably adjusted their location in the swimming chamber so that the head was obscured within the region of the band of mesh. Temperature control for all experimental trials was maintained within ± 0.3°C of the starting value via the solenoid-regulated heat-exchanger coil.
3.2. Respirometer Calibration
When fish were not present in the swimming chamber, there were no observed differences between measured flow rates at the forward and rear probes (Paired T-test: t=-1.3,
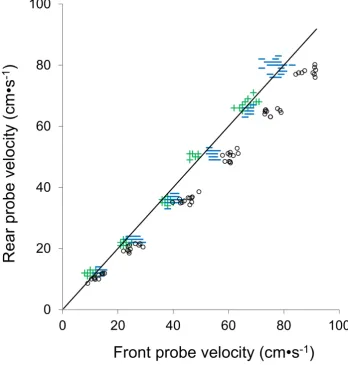
[image:5.595.122.471.357.723.2]P=0.19). The proportion of the cross-sectional area of the swimming chamber (A0/AT) blocked by gag ranged from 6 to 16 %. The two smallest fish (376 and 471 mm TL) occupied 6% and 8% of the cross-sectional area, respectively, and revealed no trends in SBE with water velocity changes from 10 to 80 cm s-1 (Fig. 2). These fish were therefore excluded from further analysis and corrections for SBE.
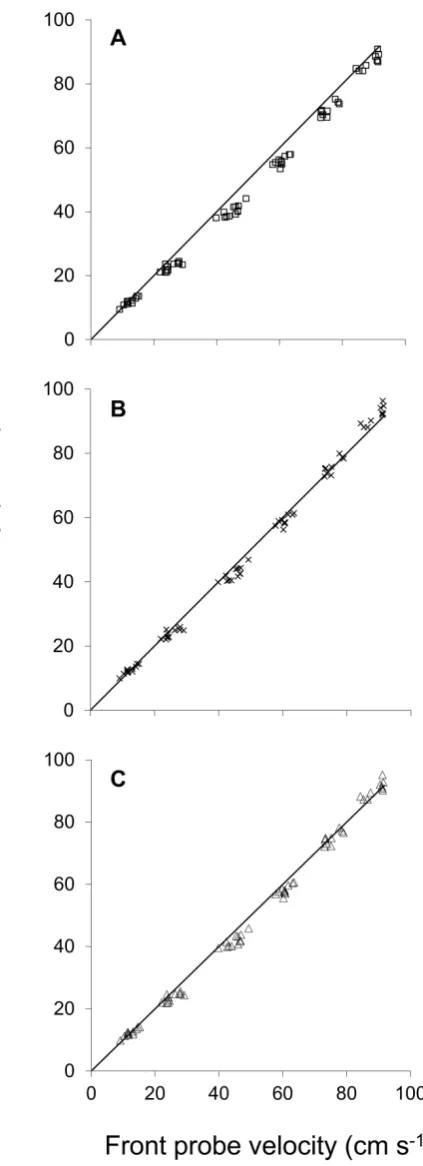
The effect of temperature on measured front and rear flow meter water velocities with fish present were not significantly different (ANCOVA: slopes F = 0.17, P = 0.68; elevations F = 2.00, P = 0.16). Therefore, the three blocking models were applied using the pooled data from both test temperatures, Figs. 3A-C.
Water velocities measured at the forward flow meter were higher than at the rear for all gag occupying >10% of the cross-sectional area of the swimming chamber (Fig. 2) and ranged from 1 cm s-1 greater at 10 cm s-1 water velocity for a gag blocking 11% of the cross-sectional area of the flume to 16 cm s-1 greater for a gag blocking 16% of the swimming chamber at a water velocity of 80 cm s-1.
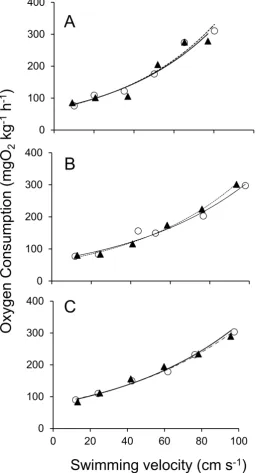
All three blocking-effect models improved the fit of the front to rear speed measurements compared to a simple linear regression model, based on the residual sum of squares (RSS) (RSS = 5137 for the linear model versus ≤882 for the blocking-effect models). The Bell and Terhune (BT) model, with a λ-body shape coefficient of 0.5 and surface area exponent (Aexp) of 1.5, consistently underestimated the water velocity (RSS = 882, R2 adj = 0.980) (Figs. 3A, 4).
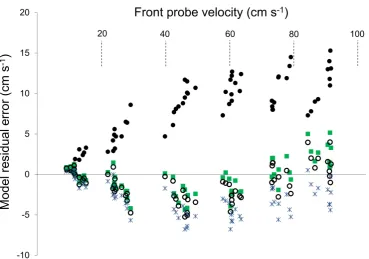
The greatest observed bias for all models occurred at 35 cm s-1where mean residual error for the BT model was -4.7 cm s-1 (-13.5% difference), The Modified Bell and Terhune (MBT) model, based on an iterated fit of coefficients for λ-body shape coefficient 0.5 and Aexp of 1.27, best fit the data (RSS = 317, R2adj = 0.993) and showed the least bias (Fig. 3B), with maximum residual error occurring between 20 and 40 cm s-1 (Fig. 4). A maximum observed residual for the
MBT model was 2.4 cm s-1 (-7% difference). Similarly, the Bernoulli model also showed a good fit to the data (R2 adj = 0.993) (Fig. 3C), with only slightly higher RSS (358). The maximum residual error based on the Bernoulli model was greatest at rear flow speeds between 20 and 50 cm s-1 with a maximum observed residual difference of -3.0 cm s-1 (-9% difference) (Fig. 4).
Based on the overall model fit with reduced RSS and mean % error, the MBT model blocking error term was selected to correct rear water velocity measurements due to blocking effect as:
exp
1 2 1
0.25
1 0.8*
A
corrected rear
T
G
G
V
V
TL
A
p
λ
p
− −
=
+
(4) where: Vcorrected = predicted swimming speed of the fish in the swimming chamber and Vrear = the measured water velocity
at the rear of the swimming chamber. The resulting λ shape
coefficient was 0.5 and the fractional area exponent (Aexp) was 1.27.
Figure 4. Residual error plots of observed flow velocity at the front probe versus uncorrected rear probe velocity (•), and rear probe velocity corrected with
[image:7.595.106.476.392.651.2]3.3. Oxygen Consumption and Repeatability
Dissolved oxygen decreased linearly at any given velocity and decreased with time relative to blank controls (where fish were not present in the respirometer). Similarly, V. 02, the mass-scaled rate of oxygen consumption (mgO2kg-1h-1) of three individual gag of a range of sizes (1.5, 2.4 and 3.1 kg) increased as a function of swimming speed (cm s-1) at 30°C and were best fitted by exponential regressions (Fig. 5A-C) (all R2adj > 0.95).
Figure 5. Mass-specific rate of oxygen consumption (mgO2 kg-1 h-1) for repeated measures at swimming speed (cm s-1) for different sizes of gag grouper (a, b and c correspond to 1.5, 2.4, and 3.1 kg fish, respectively). Initial swimming trials are given by the solid line and circle whereas the repeated trials after a minimum of 4 days are given by the dashed line and open circle.
[image:8.595.159.416.159.633.2]4. Discussion
While studies have commonly utilized the corrections for solid blocking published by Bell and Terhune [4] in both Brett and Blazka-style respirometers, [e.g., 9,10,22,23], to the authors’ knowledge, this is the first study to empirically measure and model the effect of solid blocking in a Blazka respirometer. The employment of two flow meters, simultaneously at the front and rear positions, facilitated the development of a more predictive model for the correction of flow velocity encountered by gag during swimming trials. The inconsistent and small changes in measured water velocity for fish that occupy <10% of the swimming chamber’s cross-sectional area verifies the common practice used in Brett-style respirometers of excluding those size classes from corrections for the SBE [4] for the Blazka-style respirometer.
While the application of the Bell and Terhune model [4] with standard coefficients provided an improved fit to the data as compared to linear regression, it resulted in a consistent underestimation. It is possible that this may be a result of this correction being formulated for use with a Brett-style respirometer. However, from the standpoint of practicality, the simple Bernoulli model provided an improved fit and could be used in cases where flow speed is only measured at the rear center of the swimming chamber. Overall, however, the Modified Bell and Terhune model developed in the present study from iterated estimates for λ and Aexp provided the best fit to the data. Values of the λ-shape coefficient reported in the literature range from 0.50-0.53 [4,8,10,24]. The λ-shape coefficient in this study was 0.5, confirming its use for the fusiform body shape of the grouper species used in this study. The area coefficient exponent (Aexp) value of 1.27 estimated in this study was lower than the value of 1.5 suggested by Bell and Terhune (1970) and used universally in other studies [7,8,10]. This lower value could result from parameters unaccounted for in the standard Bell and Terhune model, such as changes in inertial drag due to the swimming motion of the fish with corresponding changes in flow velocity, relative to an empty flume.
How these models perform when correcting for the blocking effect in fishes of other shapes, such as anguilliform, highly compressed, globiform, etc., remains to be studied. Regardless, with the increasing availability of accurate electronic flow meters, it is now possible to quickly and easily verify and calibrate the blocking effect for each new respirometer design constructed and species tested.
While the forward-positioned flow meter facilitated the accurate measurement of water speeds at the area of maximum girth and the development of a corrective model to better predict the actual swimming speed of the fish, the continuous use of the forward positioned flow meter at the area of maximum girth during tests of maximum swimming speed is not advised. At maximum swimming speeds during labored or burst swimming, the fish could collide with the flow meter; we therefore recommend using a rear-centered
flowmeter with corrective equations as the best alternative. In addition to quantifying the SBE of the Blazka-style respirometer, the present study also verified the use of the respirometer in measuring oxygen consumption of actively swimming gag. The repeatability of results from individual fish and the similarity of trends among fish of different sizes lent validity to the use of this respirometer in swimming energetics of gag and potential application to other relatively large, demersal reef fishes.
The large-sized Blazka-style respirometer developed in this study was capable of measuring oxygen consumption over a wide range of grouper sizes and flow rates. This design, while sufficient for demersal fish like gag, may not be the best choice of design for fusiform pelagic fish such as tunas and mackerels, which can maintain higher speeds than the respirometer in the current study could achieve. These pelagic fishes also have higher metabolic rates that would rapidly deplete the oxygen levels of the smaller volume apparatus [25]. Nevertheless, the use of a high thrust trolling motor was novel, economical, and enabled swimming speeds sufficient to exhaust many gag tested in a 30 min trial at 30°C and with speeds comparable to other studies [3,6]. Although the maximum water speed for the respirometer (110 cm s-1) was reduced relative to many Brett-style respirometers, this did not impose functional limitations because gag were not capable of swimming in a sustained manner above 80 cm s-1 for the duration required in the experimental trials. In light of this, the Blazka-style respirometer used for gag would most likely also be of use with various other demersal fishes such as snappers (Lutjanidae), drums (Sciaenidae) and Porgies (Sparidae).
Acknowledgements
We thank the many people that aided in the collection and maintenance of gag, including E. Leonard, E. J. Berens, J. M. Debicella, and R. Francis-Floyd. S. M. Baker (UF) and E. Nagid (Florida Fish and Wildlife Conservation Commission, FWCC) provided extended loans of equipment. In addition, we thank P. O’Day, and J. Kao for their help with the design and construction of the respirometer. Financial support was provided through the Program of Fisheries and Aquatic Sciences, University of Florida. All gag were captured under a Scientific Activity License issued by the FWCC and maintained in accordance with University of Florida Animal Care.
List of Symbols and Abbreviations
VF is the water velocity at the position of the fish’s maximum girth, VR is the water velocity at the rear of swimming chamber, AT is the cross-sectional area of the
swimming chamber calculated as πr2 where the radius (r) is
152.5 mm, A0 is the cross sectional area of the fish
maximum total length, ∈S is the error due to solid blocking, τ is a dimensionless factor for tunnel cross-sectional shape defined as 0.8, λ is a factor for the shape of the fish defined as: shape coefficient (length/thickness). Aexp is the fractional area exponent. BT is the standard Bell and Terhune (1970) model, MBT is the modified Bell and Terhune model with iterated coefficients for Aexp and shape coefficient developed in this study.
REFERENCES
[1] Brett JR (1964) Respiratory metabolism and swimming performance of young sockeye salmon. Journal of the Fisheries Research Board of Canada 1183-1226.
[2] Blazka P, Volf M, Cepela M (1960) A new type of respirometer for the determination of the metabolism of fish in an active state. Physiologia Bohemoslovenica 9: 553-558. [3] Brett JR (1995) Energetics. In: Groot C, Margolis L, Clarke
WC, editors. Physiological Ecology of Pacific Salmon. Vancouver: UBC Press. pp. 3-68.
[4] Bell WH, Terhune LDB (1970) Water tunnel design for fisheries research. J FishResBoard Can Tech Rep 195: 1-69. [5] Cech JJ (1990) Respirometry. In: Schreck CB, Moyle PB,
editors. Methods for Fish Biology. Bethesda: American Fisheries Society. pp. 335-362.
[6] Leonard JBK, Leonard DR, Ueda H (2000) Active metabolic rate of masu salmon determined by respirometry. Fisheries Science 66: 481-484.
[7] Farrell AP, Lee CG, Tierney K, Hodaly A, Clutterham S, et al. (2003) Field-based measurements of oxygen uptake and swimming performance with adult Pacific salmon using a mobile respirometer swim tunnel. Journal of Fish Biology 62: 64-84.
[8] Claireaux G, Couturier C, Groison A (2006) Effect of temperature on maximum swimming speed and cost of transport in juvenile European sea bass (Dicentrarchus labrax). Journal of Experimental Biology 209: 3420-3428. [9] Korsmeyer KE, Steffensen JF, Herskin J (2002) Energetics of
median and paired fin swimming, body and caudal fin swimming, and gait transition in parrotfish (Scarus schlegeli) and triggerfish (Rhinecanthus aculeatus). J Exp Biol 205: 1253-1263.
[10] Graham JB, Laurs RM (1982) Metabolic rate of the albacore tuna Thunnus alalunga. Marine Biology 72: 1-6.
[11] Parsons GR, Sylvester JL, Jr. (1992) Swimming Efficiency of the White Crappie, Pomoxis annularis. Copeia 4: 1033-1038. [12] Bårdgard AJ, Salhus H, Brix O (1989) An automated
transportable high speed tunnel respirometer. Comparative Biochemistry and Physiology Part A: Physiology 93: 577-581.
[13] Jones DR, Kiceniuk JW, Bamford OS (1974) Evaluation of swimming performance of several fish species from Mackenzie River. Journal of the Fisheries Research Board of Canada 31: 1641-1647.
[14] Alsop DH, Kieffer JD, Wood CM (1999) The effects of temperature and swimming speed on instantaneous fuel use and nitrogenous waste excretion of the Nile tilapia. Physiological and Biochemical Zoology 72: 474-483. [15] Peake S, McKinley RS, Scruton DA (2000) Swimming
performance of walleye (Stizostedion vitreum). Canadian Journal of Zoology-Revue Canadienne De Zoologie 78: 1686-1690.
[16] Sepulveda CA, Dickson KA, Graham JB (2003) Swimming performance studies on the eastern Pacific bonito Sarda chiliensis, a close relative of the tunas (family Scombridae) I. Energetics. Journal of Experimental Biology 206: 2739-2748. [17] Smith LS, Newcomb TW (1970) A modified version of
Blazka respirometer and exercise chamber for large fish. Journal of the Fisheries Research Board of Canada 27: 1321-&.
[18] Kline RJ (2004) Metabolic rate of the gag grouper (Mycteroperca microlepis) in relation to swimming speed body size and seasonal temperature. . University of Florida, Gainesville, FL, USA: Thesis (M.S.). .
[19] Bernoulli D (2005) Hydrodynamica (Hydrodynamica, sive de viribus et motibus fluidorum commentarii). In: Grattan-Guiness I, editor. Landmark writings in Western mathematics Oxford: Elsevier. pp. 131-143.
[20] Sokal RR, Rolf FJ (1995) Biometry: 3rd Edition. San Fransisco: W.A. Freeman and Sons.
[21] Healy MJR (1984) The use of R2 as a measure of goodness of fit. Journal of the Royal Statistical Society Series a-Statistics in Society 147: 608-609.
[22] Gehrke PC, Fidler LE, Mense DC, Randall DJ (1990) A respirometer with controlled water-quality and computerized data acquisition for experiments with swimming fish. Fish Physiology and Biochemistry 8: 61-67.
[23] Briggs CT, Post JR (1997) Field metabolic rates of rainbow trout estimated using electromyogram telemetry. Journal of Fish Biology 51: 807-823.
[24] Jain KE, Farrell AP (2003) Influence of seasonal temperature on the repeat swimming performance of rainbow trout Oncorhynchus mykiss. J Exp Biol 206: 3569-3579.