www.wjpr.net Vol 4, Issue 05, 2015.
2550
DEVELOPMENT AND VALIDATION OF HPTLC METHOD FOR
ESTIMATION OF ZOLPIDEM IN PHARMACEUTICAL DOSAGE
FORMS
Deepali A. Bansode*, and K.R.Mahadik, Principal
Department of Pharmaceutical Chemistry, Bharati Vidyapeeth University, Poona College of
Pharmacy, Pune, Maharashtra, India-411038.
ABSTRACT
Objective: This paper describes a new, simple, precise, accurate and specific HPTLC method for estimation of zolpidem as a bulk drug and
in tablet dosage forms. Methods: Chromatographic separation of the drug was performed on aluminum plates pre-coated with silica gel 60
F254 as the stationary phase and a mobile phase comprising of water:
methanol: acetic acid (8.0: 2.7: 0.3v/v/v). Densitometric quantification
of zolpidem was carried out at 245 nm. Zolpidem was detected
satisfactorily with an Rf value 0.42±0.03. Results: The accuracy and
reliability of the method was assessed by evaluation of linearity
(100-1000 ng/spot), precision (intra-day RSD 0.52% and inter-day RSD
0.91%), accuracy (99.12-100.10%) and specificity according to ICH
guidelines. Conclusion: The proposed HPTLC method is simple, precise, accurate, specific, reproducible and less economic without
interference from the excipients. The developed method is suitable for routine analysis of
zolpidem in bulk and as a tablet dosage form.
KEYWORDS: Zolpidem, HPTLC, Densitometric estimation, Method development, Validation.
INTRODUCTION
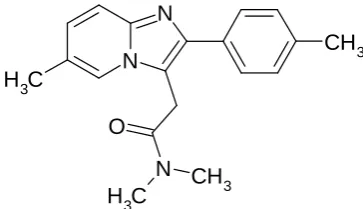
Zolpidem chemically is,
N,N,6-trimethyl-2-(4-methylphenyl)-imidazo(1,2-a)pyridine-3-acetamide (Fig.1), and is a short-acting nonbenzodiazepine hypnotic that potentiates
gamma-aminobutyric acid (GABA), an inhibitory neurotransmitter, by binding to benzodiazepine
receptors which are located on the gamma-aminobutyric acid receptors. Its chemical formula
Volume 4, Issue 5, 2550-2561. Research Article ISSN 2277– 7105
Article Received on 14 March 2015,
Revised on 06 April 2015, Accepted on 29 April 2015
*Correspondence for Author
Dr. Deepali A. Bansode Department of
Pharmaceutical Chemistry,
Bharati Vidyapeeth
University, Poona College
of Pharmacy, Pune,
www.wjpr.net Vol 4, Issue 05, 2015.
2551
is (C19H21N3O)2,C4H6O6 with a molecular weight of 764.9 g/mol. It is white hygroscopic
crystalline powder slightly soluble in water, practically insoluble in dichloromethane,
sparingly soluble in methyl alcohol. Its hypnotic effects are similar to those of the
benzodiazepine class of drugs, but it is molecularly distinct from the classical benzodiazepine
molecule and is actually classified as an imidazopyridine. Flumazenil, a benzodiazepine
receptor antagonist, which is used for benzodiazepine overdose, can also reverse zolpidem's
sedative/hypnotic effects. As an anticonvulsant and muscle relaxant, the beneficial effects
start to emerge at 10 and 20 times the dose required for sedation, respectively. For that
reason, it has never been approved for either muscle relaxation or seizure prevention.[1-2]
Literature survey reveals, selective potentiometric determination of zolpidem hemitartrate in
tablets and biological fluids by using polymeric membrane electrodes, determination of
zolpidem in human plasma using LC with fluorescence detection, LC-tandem mass
spectrometry method for the simultaneous determination of 26 benzodiazepines and
metabolites, zolpidem and zopiclone, in blood, urine, and hair, determination and in-process
control of zolpidem synthesis by LC, Rapid and simple method for the determination of
zolpidem in human plasma by high-performance liquid chromatography and determination of
zolpidem hemitartrate by quantitative HPTLC and LC have been reported.[3-7] Zolpidem was
determined by HPLC methods together with other drugs, in biological fluids and stability
indicating LC, TLC method. To the best of our knowledge no method is reported for
determination by HPTLC, hence the primary aim was to develop and validate a HPTLC
method for the rapid quantitation of the drug for routine analysis. The present study illustrates
development and validation of simple, accurate, economical and reproducible method for
determination of zolpidem by HPTLC as bulk and tablet dosage forms as compared to the
other methods. The proposed method was validated as per ICH guidelines.
N
N CH3
N O
C
H3 CH3
C
[image:2.595.205.387.599.703.2]H3
www.wjpr.net Vol 4, Issue 05, 2015.
2552 MATERIALS AND METHODS
Reagents and chemicals
Pharmaceutical grade zolpidem was kindly supplied as a gift sample by Shreeji Pharma
International, Vadodara, India. It was certified to contain 99.85% (w/w) on dry basis and was
used further without purification. All other chemicals and reagents used were analytical grade
and were supplied from Merck Chemicals, India.
INSTRUMENTATION
The samples were spotted in the form of bands of width 6 mm with a Camag 100 µl sample
(Hamilton, Bonaduz, Switzerland) syringe, on silica gel pre-coated aluminum plate 60 F254
plates (10×10 cm) with 250 µm thickness; (E. Merk, Darmstadt, Germany), supplied by
Anchrom technologist, Mumbai using a Camag Linomat V (Switzerland) sample applicator .
The plates were prewashed with methanol and activated at 110°C for 5 min prior to
chromatography. A constant application rate of 0.1 µl/s was used and the space between two
bands was 6 mm. The slit dimension was kept at 5 mm × 0.45 mm and the scanning speed
was 10 mm/s. The monochromatic band width was set at 20 nm and 320 cut off filter; each
track was scanned three times and baseline correction was used. The mobile phase consisted
of water: methanol: acetic acid (8.0: 2.7: 0.3; v/v/v) and 11.0 ml of mobile phase was used
per chromatography run. Linear ascending development was carried out in a 20 cm × 10 cm
twin trough glass chamber (Camag, Muttenz, Switzerland) saturated with the mobile phase.
The optimized chamber saturation time for mobile phase was 20 min at room temperature
(25°C±2) at relative humidity of 60% ±5. Each chromatogram was developed over a distance
of 8 cm. Following the development, the TLC plates were dried in a stream of air with the
help of hair dryer in a wooden chamber with adequate ventilation. Densitometric scanning
was performed using a Camag TLC scanner III in the reflectance- absorbance mode at 245
nm and operated by Wincats software (v 3.15, Camag). The source of radiation used was
deuterium lamp emitting a continuous UV spectrum between 200 and 400 nm. Evaluation
was performed by linear regression of peak areas determined by UV absorption as a function
of sample analysis.
HPTLC METHOD AND CHROMATOGRAPHIC CONDITIONS Preparation of standard stock solutions
Standard solutions were prepared by dilution of the stock solution with methanol to give
www.wjpr.net Vol 4, Issue 05, 2015.
2553
concentration was spotted six times on the TLC plate. The peak areas were plotted against the
corresponding concentrations to obtain calibration graphs.
Prewashing of plates
Densitometric estimation was carried out on 20×10 cm pre-coated silica gel 60 F254
pre-coated plates from E. Merck. The plates were pre-washed with methanol, dried and activated
for 30 min at 110°C.
Sample application
The standard and formulation samples of zolpidem were spotted on pre-coated TLC plates in
the form of narrow bands of length 6 mm, with 10 mm from the bottom and left margin and
10 mm distance between two bands. Samples were applied under continuous drying stream of
nitrogen gas at constant application rate of 150 ml/s.
Optimization of mobile phase
Initially various solvent systems like (a) water: methanol (5.0: 5.0; v/v) (b) chloroform:
methanol (6.0: 4.0; v/v) (c) water: methanol (7.0: 3.0; v/v) (d) water: methanol (8.0: 2.0; v/v)
in varying ratio were tried to separate and resolve spot of zolpidem from its impurities and
other excipients of formulation. The mobile phase water: methanol: acetic acid (8.0: 2.7: 0.3;
v/v/v) gave good resolution at 245 nm with Rf value 0.42±0.03 for zolpidem. Pre-saturation
of TLC chamber with mobile phase for 30 min assured better reproducibility in migration of
zolpidem and better resolution. Well defined spots were obtained when the chamber was
saturated with the mobile phase for 30 min at room temperature (Fig. 2).
www.wjpr.net Vol 4, Issue 05, 2015.
2554 METHOD VALIDATION
The developed HPTLC method was validated as per the ICH guidelines Q2 9(R1) for
linearity, accuracy, precision, limit of detection, limit of quantification, repeatability,
specificity and robustness.[8-11]
Linearity and calibration curve
Linearity was evaluated by determining six standard working solutions containing 100-1200
ng/ spot of zolpidem (n=6) twice in replicate for HPTLC. The calibration curves were
developed by plotting peak area versus concentration with the help of Win-CATS software.
The plate was developed in a twin through glass chamber, using 20 min chamber saturation
time. The length of the run was 80 mm. The developed plates were air-dried. Scanning was
performed in UV mode at 245 nm. The slit dimension was kept at 5 × 0.45 mm at scanning
speed of 100 nm/s. After completion of scanning, peak areas were noted. Peak areas were
plotted against corresponding concentration and least square regression analysis was
performed to generate the calibration equation.
Precision
System repeatability was determined by six replicate applications and measurements of peak
area for active compound and was expressed in terms of relative standard deviation (% RSD)
and standard error (S.E). Method repeatability was obtained from R.S.D. value by repeating
the assay of zolpidem as standard six times, on same day for (intra day precision).
Intermediate precision was assessed by the assay; six sample sets on different days (inter day
precision). The intra and inter day precision studies for determination of zolpidem was
carried out at three different concentration levels 300, 600, 900 ng/spot.
Accuracy
Recovery studies of the drug were carried out for determining accuracy of the developed
method. It was done by mixing known quantity of standard drug with the sample formulation
and the contents were analyzed by the proposed method. Recovery studies were carried out at
80-120% levels. The percentage recovery and percentage RSD were calculated.
Limit of detection and limit of quantitation
In order to estimate the limit of detection (LOD) and lower limit of quantitation (LOQ), blank
methanol was spotted six times following the same method. The signal to noise ratio (S/N)
www.wjpr.net Vol 4, Issue 05, 2015.
2555
by taking different concentrations. The peak was detected at 10 ng/spot with a signal-to-noise
ratio of 3:1. The LOQ was done by taking different concentrations .The peak was detected
with quantifiable area with a signal-to-noise ratio of 10:1.
Specificity
The specificity of the method was ascertained by analyzing standard drug. The peak purity of
zolpidem was assessed by comparing the spectra of the standard and the sample at three
different levels, i.e. peak start (S), peak apex (S) and peak end (E) positions of the spot.
Recovery studies
Recovery studies were carried out by applying the method to preanalysed standard sample to
which known amount of zolpidem corresponding to 80, 100, 120% of the label claim
(Standard addition method). At each level of the amount, six determinations were performed
and the results obtained were compared with the expected results.
Analysis of the marketed formulation
To determine the content of zolpidem in conventional tablets, ZOLDEM (label claim: 5
mg/tablet) the tablets were weighed and powder equivalent to 5 mg of zolpidem was
weighed. The drug from the powder was extracted with methanol to ensure complete
extraction of the drug, it was sonicated for 30 min and volume was made upto 100 ml. 4 µl of
the resulting solution was diluted to 10 ml with methanol. The resulting solution was
centrifuged at 3000 rpm for 5 min and supernatant was analyzed for drug content. 40 µl of the
filtered solution 20 µg/ml was spotted and scanned into the HPTLC system the analysis was
repeated in triplicate.
Robustness
As defined by ICH, the robustness of an analytical procedure describes to its capability to
remain unaffected by small and deliberate variations in method parameters. The parameter
selected for the robustness study were mobile phase composition, amount of mobile phase,
temperature, relative humidity, plate pretreatment, time from spotting to chromatography,
time from chromatography to scanning. It was observed that there were no marked changes in
www.wjpr.net Vol 4, Issue 05, 2015.
2556 Stability in sample solution
Spot stability
The time the sample is left to stand in the solvent prior to chromatographic development can
influence the stability of separated spots and are required to be investigated for validation.
Two dimensional chromatography using same solvent system was used to find out any
decomposition occurring during development. In case, if decomposition occurs during
development, peak(s) of decomposition product (s) shall be obtained for the analyte both in
the first and second direction of the run. No decomposition was observed during spotting and
development.[12-14]
RESULT AND DISCUSSION Linearity
Linearity was evaluated by determining six standard working solutions containing 100-1200
ng/ spot of zolpidem (n=6) twice in replicate for HPTLC. Peak areas were plotted against
corresponding concentration and least square regression analysis was performed to generate
the calibration equation.
A representative calibration curve was obtained by plotting peak area of compound against
the concentration over the range of 100-1000 ng/spot. The slope, intercept and correlation
co-efficient values showed good correlation between regression coco-efficient and concentration of
the drug. The results are depicted in Table 1.
Table 1: Linear regression data for the calibration curves.
Parameters HPTLC
Linearity range 100-1000 ng/spot r2 ± S.D. 0.999 ± 0.21 Slope ± S.D. 0.18 ± 0.08 Intercept ± S.Db 0.12 ± 0.07
Precision
System repeatability was determined by six replicate applications and measurements of peak
area for active compound and was expressed in terms of relative standard deviation (%RSD)
and standard error (S.E). The intra and inter day precision studies for determination of
www.wjpr.net Vol 4, Issue 05, 2015.
2557
The repeatability of sample application and measurement of peak area were expressed in
terms of % RSD and found to be 0.91 and 0.52 respectively. The % RSD for within and day
to day analysis was found to be <2%. The results are depicted in Table 2.
Table 2: Results of precision studies.
Intra day Inter day
S.D RSD S.E S.D RSD S.E
1.36 0.51 0.39 1.49 0.91 0.21
Accuracy
Recovery studies were carried out at 80-120% levels. The percentage recovery and
percentage RSD were calculated.
The percent recovery of zolpidem was 99.12-100.10% (at 80%, 100% and 120%
respectively), which was found to be satisfactory. The result of recovery studies indicated
that the proposed method was accurate for estimation of drug in a tablet dosage form. The
results are depicted in Table 3.
Table 3: Recovery studies of zolpidem tablet. Excess drug added to
the analyte (%)
Recovery (%)
(% ) RSD
(%) SE
80 100 120
99.12 98.01 100.10
0.31 0.64 0.94
1.01 0.29 1.19
LOD and LOQ
In order to estimate the limit of detection (LOD) and lower limit of quantitation (LOQ), blank
methanol was spotted six times following the same method. The signal to noise ratio (S/N)
was determined. LOD was considered as 3:1 and LOQ as 10:1.
The signal to noise ratios 3:1 and 10:1 were considered as LOD and LOQ respectively. The
LOD and LOQ were found to be 10 and 30 ng/spot.
Specificity
Specificity was checked for the interference of excipients in the analysis. When the Zoldem
tablets were analysed, sharp and well defined peak was obtained at Rf 0.42±0.03 when
www.wjpr.net Vol 4, Issue 05, 2015.
2558
The peak purity of zolpidem was assessed by comparing the spectra of standard at peak start,
peak apex and peak end positions of the spot i.e., r (start, middle) = 0.9997 and r (middle,
end) = 0.9996. Good correlation (r=0.9997) was also obtained between standard and sample
[image:9.595.122.471.168.360.2]spectra of zolpidem. The densitogram of zoldem tablet is as shown in Fig.3.
Fig.3: Densitogram of zolpidem formulation (Zoldem Tablet).
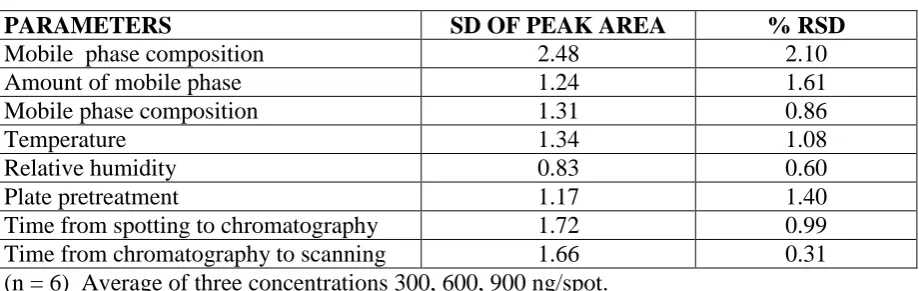
Robustness
Robustness of an analytical procedure describes to its capability to remain unaffected by
small and deliberate variations in method parameters. The parameter selected for the
robustness study were mobile phase composition, amount of mobile phase, temperature,
relative humidity, plate pretreatment, time from spotting to chromatography, time from
chromatography to scanning.
The standard deviation of peak area was calculated for each parameter and %R.S.D. was
found to be less than 2%. The results are depicted in Table 4.
Table 4: Robustness testing for HPTLC method
PARAMETERS SD OF PEAK AREA % RSD
Mobile phase composition 2.48 2.10
Amount of mobile phase 1.24 1.61
Mobile phase composition 1.31 0.86
Temperature 1.34 1.08
Relative humidity 0.83 0.60
Plate pretreatment 1.17 1.40
Time from spotting to chromatography 1.72 0.99
Time from chromatography to scanning 1.66 0.31
[image:9.595.70.530.619.764.2]www.wjpr.net Vol 4, Issue 05, 2015.
2559 Spot stability
The time the sample is left to stand in the solvent prior to chromatographic development can
influence the stability of separated spots and are required to be investigated for validation.
Two dimensional chromatography using same solvent system was used to find out any
decomposition occurring during development.
Three different concentrations of zolpidem 300, 600, 900 ng/spot were prepared and stored at
room temperature for 3 days, respectively. They were then applied on the same TLC plate,
after development the densitogram were evaluated for additional spots if any. There was no
instability in the sample solution. The results are depicted in Table 5.
Table 5: Stability of zolpidem in sample solutions.
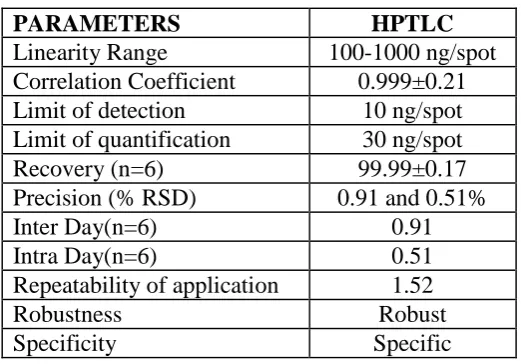
Method Validation
The developed HPTLC method is validated as per the ICH guideline. The summary of
[image:10.595.168.429.480.662.2]validation parameters is shown in Table 6.
Table 6: Summary of validation parameters.
CONCLUSION
The developed HPTLC method for quantitative analysis of zolpidem in pharmaceutical
formulations is simple, precise, accurate, specific, reproducible and less economic without
interference from the excipients. The method was validated in accordance with ICH
guidelines. The method reduces analysis time compared with other methods and seems to be
PARAMETERS HPTLC
S.D of Area 1.45
% R.S.D 1.32
S.E. 0.11
PARAMETERS HPTLC
Linearity Range 100-1000 ng/spot
Correlation Coefficient 0.999±0.21
Limit of detection 10 ng/spot
Limit of quantification 30 ng/spot
Recovery (n=6) 99.99±0.17
Precision (% RSD) 0.91 and 0.51%
Inter Day(n=6) 0.91
Intra Day(n=6) 0.51
Repeatability of application 1.52
Robustness Robust
www.wjpr.net Vol 4, Issue 05, 2015.
2560
suitable for routine analysis of pharmaceutical formulations in quality-control laboratories,
where economy and speed are essential.
ACKNOWLEDGEMENT
Pharmaceutical grade zolpidem was kindly supplied as a gift sample by Shreeji Pharma
International, Vadodara, India.
REFERENCES
1. Zeany El, Moustafa BA, Farid AA, Determination of hemitartartarte by quantitative
HPTLC and LC. J Pharm Biomed Anal., 2003; 15; 33(3): 393-401.
2. Laviana L, Mangas C, Fernández-Marí F, Bayod M, Blanco D, Determination and
in-process control of zolpidem synthesis by high-performance liquid chromatography. J
Pharm Biomed Anal., 2004; 36(4): 925-8.
3. Ring, P.R., Bostick, J.M., Validation of a method for the determination of zolpidem in
human plasma using LC with fluorescence detection. J Pharm Biomed Anal, 2000; 22(3):
495-504.
4. Ptácek P, Macek J, Klíma J, Rapid and simple method for the determination of zolpidem
in human plasma by high-performance liquid chromatography. J Chromatogr B Biomed
Sci Appl., 1997; 4; 694(2): 409-13.
5. Khadiga M. Kelani., Selective potentiometric determination of zolpidem hemitartrate in
tablets and biological fluids by using polymeric membrane electrode. J AOAC., 2004;
87(6): 1309-1318.
6. Piergies AA, Sweet J, Johnson M, Roth-Schechter BF, Allard S, The effect of
co-administration of zolpidem with fluoxetine: pharmacokinetics and pharmacodynamics. Int
J Clin Pharmacol Ther. 1996; 34(4):178-83.
7. Quintela O, Sauvage FL, Charvier F, Gaulier JM, Lachâtre G, Marquet P, Clin Chem,
Liquid chromatography-tandem mass spectrometry for detection of low concentrations of
21 benzodiazepines, metabolites, and analogs in urine: method with forensic applications.
Clin Chem., 2006; 8, 52(7): 1346-55.
8. Chatwal GR, Aanad SK. Instrumental Methods of Chemical Analysis, 5th edition:
Himalaya Publishing House; Mumbai 400004; 2002.
9. Beckett AH. Stenlake JB. Practical Pharmaceutical Chemistry, 4th edition: Part 2 CBS
www.wjpr.net Vol 4, Issue 05, 2015.
2561
10.Maryadele JO, Neil (Eds). The Merck Index: An Encyclopedia of Chemicals Drugs and
Biologicals; Merck Research Laboratories, Division of Merck co., Inc, Whitehouse
Station, New Jersey., 2006.
11.Maryadele J, Heckelaman PE, Koch CB, the Merk Index: An Encyclopedia of Chemicals,
Drugs and Biologicals, Merck Research Laboratories, 14th edition: USA., 2006.
12.ICH Harmonized Tripartite Guidelines, Validation of Analytical Procedure: Text and
Methodology Q2 (R1)., 2005.
13.ICH. Q2B Validation of analytical procedure: Methodology. International Conference on
Harmonization, Geneva., 1996.
14.ICH Harmonized Tripartite Guideline, Validation of Analytical Procedure: Methodology