RESEARCH ARTICLE
Pitx1
directly modulates the core limb development program
to implement hindlimb identity
Stephen Nemec1,2, Maëva Luxey1, Deepak Jain1,3, Aurélie Huang Sung1, Tomi Pastinen4and Jacques Drouin1,2,3,*
ABSTRACT
Forelimbs (FLs) and hindlimbs (HLs) develop complex musculoskeletal structures that rely on the deployment of a conserved developmental program. Pitx1, a transcription factor gene with expression restricted to HL and absent from FL, plays an important role in generating HL features. The genomic mechanisms by whichPitx1effects HL identity remain poorly understood. Here, we use expression profiling and analysis of direct Pitx1 targets to characterize the HL- and FL-restricted genetic programs in mouse and situate thePitx1-dependent gene network within the context of limb-specific gene regulation. We show that Pitx1 is a crucial component of a narrow network of HL-restricted regulators, acting on a developmental program that is shared between FL and HL. Pitx1 targets sites that are in a similar chromatin state in FL and HL and controls expression of patterning genes as well as the chondrogenic program, consistent with impaired chondrogenesis in Pitx1−/− HL. These findings support a model in which multifactorial actions of a limited number of HL regulators redirect the generic limb development program in order to generate the unique structural features of the limb.
KEY WORDS: Limb specification, Regulatory network, Expression profiling, ChIPseq, Tbx5, Mouse
INTRODUCTION
In tetrapods, forelimbs (FLs) and hindlimbs (HLs) develop complex musculoskeletal structures within the framework of a common three-segment organization. Despite differences in structure and utility, the FLs and HLs of mice and humans both contain a proximal one-bone stylopod, an intermediate zeugopod segment with two bones, and a distal autopod with five digits. The arrangement of cartilage, bone, muscle and tendon within this framework, however, depends on the reproducible implementation of an underlying developmental program, and the differences in pattern between limbs arise from limb-specific modifications of this program, itself a derivation of the fin program of the lobe-finned fish ancestral to all tetrapods (Petit et al., 2017; Pieretti et al., 2015; Shubin et al., 1997).
Limb-specific transcription factors (TFs) are important elements
of the limb program: paired-like homeodomain 1 (Pitx1) is an
HL-restricted TF gene that is expressed throughout the posterior
mesoderm and consequently in the early HL bud but not in FL (Lanctôt et al., 1997; Lamonerie et al., 1996). Genetics experiments in mice suggest that Pitx1 is an important upstream regulator of HL
patterning: Pitx1−/− mice develop HLs that lack several key HL
characteristics (Lanctôt et al., 1999; Szeto et al., 1999). This role is
conserved in evolution (Chan et al., 2010). Strikingly,Pitx1−/−HLs
fail to develop the load-bearing architecture of the knee: they lack a patella and have elbow-like bone contacts between the two bones of the zeugopod and the femur, which is twisted and shortened. At the
molecular level,Pitx1−/−HLs are deficient in the expression of another
limb type-restricted TF gene:Tbx4(Lanctôt et al., 1999). Rescuing
Tbx4 expression via a Prx1-driven Tbx4 transgene rescues some
features lost in thePitx1−/−HL, including femur length and certain
qualitative muscle patterning characteristics (Ouimette et al., 2010). In chick, leg and wing patterning has been correlated by various
means with the expression of Tbx4 and the closely related
FL-restricted Tbx5 (Gibson-Brown et al., 1998; Ohuchi et al.,
1998; Rodriguez-Esteban et al., 1999; Takeuchi et al., 1999), but the capacity of these proteins to sufficiently determine HL versus FL morphology of the skeleton in the mouse is, however, less definitive
(Ouimette et al., 2010).Pitx1plays a prominent role in patterning the
skeleton and has the capacity to generate HL-like features in FL:
ectopic expression of Pitx1in the FL of mice leads to structural
changes in the FL skeleton, as well as ectopic expression of the
HL-restricted TFHoxc10(DeLaurier et al., 2006; Minguillon et al.,
2005). In humans, mutations leading to ectopicPITX1expression in
the FL cause Liebenberg syndrome, a disease in which the FLs of patients display HL-like patterning features (Spielmann et al., 2012).
The breadth and characteristics of thePitx1-directed HL program
are not well understood: what is the extent ofPitx1-dependent gene
regulation and to what extent is this Pitx1-dependent gene
regulatory network unique to the HL? Here, we use expression profiling of morphologically stage-matched FL and HL, combined with profiles of chromatin marks in these limbs, to illustrate the gene regulatory networks that drive FL and HL development. We also
isolate the Pitx1-directed elements of the HL program through
expression profiling ofPitx1−/−mice and ChIPseq of Pitx1 in E11.5
HL. We show that the programs that drive FL and HL development are very similar, marked by the expression of relatively few limb
type-restricted genes. We also show thatPitx1largely acts upon a
chromatin landscape and genetic program that are common between
FL and HL. Although the chromatin landscape of select Pitx1
-dependent genes varies in accordance with their enriched expression
in HL versus FL, thePitx1−/−phenotype is principally defined by an
expression loss of genes common to both limbs. In conjunction with
the loss of anterior skeletal features in thePitx1−/−HL, we observe
direct Pitx1 targeting of chondrogenic genes in the HL, suggesting that Pitx1 generates HL-specific features by targeting common limb elements involved in chondrogenic expansion during early HL development.
Received 15 May 2017; Accepted 4 August 2017
1Institut de Recherches Cliniques de Montréal, Montréal, QC, H2W 1R7 Canada. 2Department of Experimental Medicine, McGill University, Montreal, QC, H4A 3J1
Canada.3Department of Biochemistry, McGill University, Montreal, QC, H3G 1Y6
Canada.4Department of Human Genetics, McGill University and Genome Quebec
Innovation Centre, Montreal, QC, H3A 0G1 Canada.
*Author for correspondence ( [email protected])
J.D., 0000-0001-8226-5691
DEVEL
O
RESULTS
The HL and FL programs are defined by a limited number of limb type-restricted genes
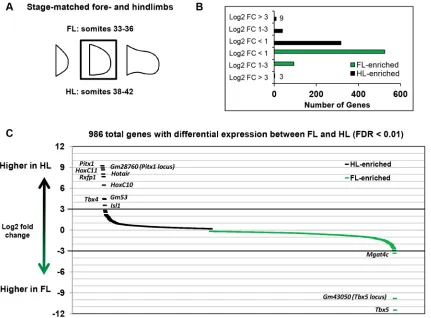
In order to examine the extent of the limb-specific developmental programs, we compared the transcriptomes of morphologically stage-matched FL and HL by RNAseq analysis. Targeting an early, comparable stage of development between FL and HL, we chose to evaluate E10.5 FL and E11.0 HL, stages at which the limb bud has completely emerged from the flank but before the bud acquires any hint of a paddle-like morphology. At this stage, the anterior and posterior margins of the bud are parallel to each other and perpendicular to the flank, which corresponds to a somite count of 33-36 somites in FL and 38-42 somites in HL, stages that will henceforth be referred to as E10.5 and E11.0, respectively (Fig. 1A). Using a false discovery rate (FDR) cutoff of 0.01, we observe 986 genes that are differentially expressed between FL and HL, although the vast majority of these differences are low-magnitude expression changes, i.e. less than 2-fold changes (Fig. 1B, Fig. S1). These low-magnitude changes, however, are not
biologically spurious: for example, HLs show a 27% reduction inGli3
expression and a corresponding 66% increase inShhexpression, and
subtle changes in gene dosage of these anterior-posterior patterning
genes have been previously associated with limb-specific
morphological changes (Li et al., 2014).
We observe a relatively narrow network of genes that are
expressed in a limb type-restricted manner, defined here as a log2
fold change greater than 3 (Fig. 1B,C). The extent of the
FL-restricted gene network is effectively limited to Tbx5 and the
predicted geneGm43050, an antisense transcript present at theTbx5
locus (Fig. 1C). In HL, the network of restricted genes is slightly
more extensive, consisting ofPitx1,Tbx4,Isl1, and several of the 5′
HoxCgenes. Much is known about these prominent genes of the
limited HL-specific network: Pitx1 and Isl1 are genetically
complementary, as both are upstream of Tbx4, although Pitx1
contributes to the development of anterior HL structures while
Isl1−/− mice fail to develop posterior HL elements, such as the
ischium and zeugopod (Itou et al., 2012).Hoxc10andHoxc11, in
conjunction with their paralogs in theHoxAandHoxDclusters, are
necessary in HL for the development of the stylopod and zeugopod,
respectively (Wellik and Capecchi, 2003). Gm53, a long
non-coding RNA located 5′ofHoxb9, shows HL-restricted expression,
althoughHoxb9itself, which was previously shown to be expressed
preferentially in the leg of chick (Nelson et al., 1996), plays a role
with the otherHox9paralogs in the establishment of the posterior
limb field in FL exclusively (Xu and Wellik, 2011).Rxfp1, a relaxin
family peptide receptor gene that shows HL-restricted expression, is not known to be associated with limb patterning defects, although its ligand, relaxin, is associated with negative regulation of collagen
turnover, TGFβsignaling, and fibrosis (Samuel et al., 2005). The
presence of these known limb regulators in the differentially expressed dataset, although accompanied by a few novel limb type-restricted genes, validates the results of our transcriptomic approach.
ThePitx1gene regulatory network partially overlaps with
the network of limb-enriched gene expression
[image:2.612.94.525.385.703.2]With a thorough characterization of FL versus HL gene regulatory networks in hand, revealing extensive low-magnitude expression
Fig. 1. Very few genes are limb type restricted in mouse embryos.(A) Representation of stage-matched FL and HL used for expression profiling by RNAseq. (B) Distribution of differentially expressed genes between FL and HL, binned according to log2fold changes (FC). (C) Rank order by log2fold change of all
differentially expressed genes between FL and HL.
DEVEL
O
changes and very few limb type-restricted genes, we sought to
characterize thePitx1gene regulatory network at E11.0 to better
understand its role in the HL program. We performed expression
profiling of E11.0Pitx1−/− versus wild-type (wt) HL and
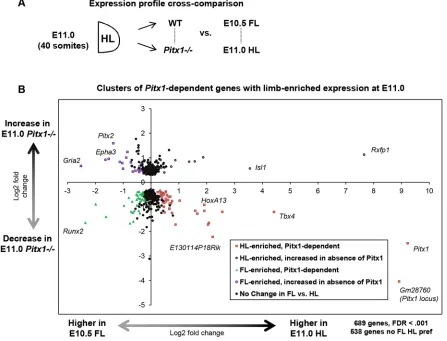
cross-compared this with our stage-matched FL versus HL expression profiling analysis (Fig. 2A). Using a conservative threshold
(FDR<0.001) we identified 689 genes that are Pitx1 dependent.
Of these, most are not expressed in a limb-specific manner: 538 genes show no preference between FL and HL at FDR<0.01 (Fig. 2B). The genes that do show limb-enriched expression can be
separated into four categories: Pitx1-dependent genes with
HL-enriched expression; Pitx1-dependent genes with FL-enriched
expression; HL-enriched genes that show increased expression in the Pitx1−/− HL; and FL-enriched genes that show increased
expression in thePitx1−/−HL. Of these groups, the set of Pitx1
-dependent HL-enriched genes and the set of FL-enriched genes that
show an increase in expression in thePitx1−/−HL define the
limb-specific components of thePitx1gene regulatory network.
The set ofPitx1-dependent HL-enriched genes is notably marked
by positive controls Pitx1 and Tbx4, but in addition to these
expected genes we findHoxa13and several other 5′genes of the
HoxA cluster, including Evx1, Evx1os and Hottip (Fig. 2B,
Table S1). Also prominently featured in this group is
E130114P18Rik, which encodes a long non-coding RNA of unknown function; this gene shows a 4-fold preference in expression in HL, and a 4-fold decrease in HL expression in the
absence of Pitx1. The Pitx1-dependent HL-enriched genes
constitute the largest category with a limb-enriched expression
profile, which also includes Tgfb3, Gtf2ird1 and, interestingly,
Hand2, which is important for the establishment of limb bud
polarity and the onset ofShhexpression (Galli et al., 2010).
FL-enriched genes that show an increase in expression inPitx1−/−
HL represent potential components of the limb program that are normally downregulated in the endogenous HL developmental
program, where Pitx1 is normally expressed. Pitx2 is notably
present on this list, as are several genes that are typically expressed
in anterior compartments of the wt FL, includingEpha3andGria2
(Fig. 2B, Table S2A). The set of genes that show HL-enriched
expression as well as increased expression in the absence ofPitx1
constitutes a small list that most prominently includesIsl1, a known
genetic parallel of Pitx1, as well as the HL-specific Rxfp1
(Table S2B). It is likely that the genes in this list are components
of the Isl1-dependent posterior HL developmental program that
persists unimpeded by the loss ofPitx1.
The last set of genes, showingPitx1-dependent and FL-enriched
expression, are a peculiar group as they represent components that are more prominently featured in the FL program that are
nonetheless significantly decreased in thePitx1−/−HL (Table S3).
This group contains genes known to be involved in diverse processes, from proximal limb development and chondrogenesis to, interestingly, many genes associated with the establishment of
[image:3.612.84.531.365.706.2]anterior domains in anterior-posterior limb patterning. Shox2, an
Fig. 2. Relation between limb-restricted expression and dependence onPitx1.(A) Expression profiling comparisons, matching stage-matched wt FL and HL andPitx1−/−HL analyses. (B) The log
2fold changes of gene expression in FL versus HL (x-axis) versus log2fold change in E11.0Pitx1−/−versus wt HL
(y-axis). All genes with FDR<0.001 in the E11.0Pitx1−/−versus wt comparison are shown.
DEVEL
O
important gene for proximal development of both HLs and FLs, is
an upstream regulator ofRunx2(Cobb et al., 2006); both of these
genes are FL enriched andPitx1dependent.Gli3andCdon, which
have an antagonistic genetic relationship withShh, are also present
in this set, indicating Pitx1-dependent expression despite the
relative suppression of these genes in wt HL versus FL (Mo et al., 1997; Probst et al., 2011; Cardozo et al., 2014). Taken together,
these data highlight the complex nature of thePitx1-dependent gene
network, as manyPitx1-dependent genes in these four categories
have different or even opposing functions.
Pitx1 targets a limb program that is already primed for use in FL
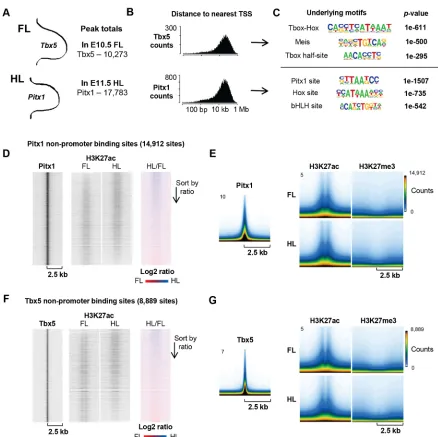
In order to investigate the direct targets of Pitx1, we performed ChIPseq of Pitx1 in E11.5 HL. We also performed ChIPseq of the FL-restricted TF Tbx5, with the aim of using the targets of these limb-specific TFs as seeds for the investigation of limb-specific enhancer elements. In total, we isolated 10,273 peaks in our Tbx5 dataset and over 50,000 peaks in our Pitx1 dataset. For Pitx1, however, we isolated the peaks that match a corresponding ChIPseq replicate, performed using a different antibody in the same tissue (Infante et al., 2013). This corresponding dataset shows fewer total peaks, but of the 25,025 present 71% are covered by our data. This final list of 17,783 peaks thus represents a highly reliable list of Pitx1 target sites (Fig. 3A). We find that Pitx1 and Tbx5 predominantly bind gene-distant, non-promoter regions (Fig. 3B). Interestingly, the top-scoring underlying motif for Tbx5
is not a T-box half-site (TCACACCT), but a composite T-box–
Hox site that contains five bases of the T-box half-site directly abutting the six core bases of a Hox binding site (Fig. 3C). Pitx1 sites are principally enriched for the canonical TAATCC Pitx1 binding site, as well as Hox and bHLH sites; unlike Tbx5, however, these Hox sites are randomly dispersed around the principal Pitx1 motif and not in a sequence-specific orientation (data not shown).
In addition to the expression profiles of stage-matched FL and HL, we also generated a library of chromatin mark data in these limbs. Using the targets of Pitx1 and Tbx5 as seeds for a screen of possible limb-specific enhancer regions, we evaluated the profiles of chromatin modifications associated with active and repressed chromatin (Fig. 3D-G), namely acetylation of lysine 27 of histone H3 (H3K27ac) and trimethylation of lysine 27 of histone H3 (H3K27me3), respectively, in stage-matched FL and HL (Cao et al., 2002; Shlyueva et al., 2014; Cotney et al., 2012). For these analyses, only Pitx1 and Tbx5 peaks at least 2.5 kb from the nearest transcription start site (TSS) were used so as to avoid contaminating our analysis with promoter regions, which have a different chromatin organization compared with enhancers. These TSS-proximal peaks represent 16% and 13% of the total, respectively. We found that the chromatin surrounding direct Pitx1 and Tbx5 targets is in largely the same state in both FL and HL (Fig. 3D-G), comprising a bimodal H3K27ac peak and a depletion of H3K27me3, an indication of enhancer chromatin in an active state. The ratio of H3K27ac signal between FL and HL is similar at sites of Pitx1 or Tbx5 binding: in fact, between limbs and comparing 100 bp bins across the entire genome, all chromatin marks that we evaluated correlate with each other very strongly,
with an average Pearson’s correlation coefficient of 0.94
(Fig. S1B). In light of this similarity, it is clear that Pitx1 does not globally change the epigenetic state of the limb development program, but rather acts upon genomic targets of an epigenetic state shared between FL and HL.
A small set of Pitx1 targets and Hox loci show limb-enriched chromatin profiles
Although the overall pattern of Pitx1 targets suggests a common state between limbs, there are 129 non-promoter Pitx1 targets that show a 2-fold enrichment in H3K27ac signal in the 2 kb window spanning the Pitx1 peak summit. We isolated these sites, assigned them to their putative target genes using the GREAT tool (McLean et al., 2010), and then cross-referenced this list of putative targets with our set of HL-enriched genes at FDR<0.01 (Fig. 4A). The GREAT tool associates ChIPseq peaks with nearby genes within a 5 kb to 1 Mb dynamic genomic window. The sites most enriched for
H3K27ac in HL are at the truly HL-restricted genes, namelyPitx1,
Tbx4,Isl1and theHoxCcluster, although several genes of theHoxA
cluster also show HL-enriched H3K27ac at Pitx1 targets in conjunction with HL-enriched expression (Fig. 4B). This pattern
corresponds with an enrichment of H3K4me3 over the 5′side of the
HoxAlocus in HL, as well as a depletion of H3K27me3 over the
same region (Fig. S2). This pattern of chromatin marks and
HL-enriched gene expression is also apparent at theHoxDlocus
(Fig. S3). To varying extents, all Hox loci show a preference for HL
expression in the 5′ side of the cluster and a corresponding
preference for FL expression in the 3′side of the cluster, although
the boundaries at which expression becomes FL-enriched or HL-enriched vary by cluster (Figs S2-S5).
Of these enriched genes near Pitx1 sites that show
HL-enriched H3K27ac signal, only half arePitx1dependent. Pitx1 sites
nearCol5a1,Hoxc10andHand2are shown as representative loci (Fig. 4C). Interestingly, in light of the fact that Pitx1 has been shown
to be present at and driveHoxc10andHoxc11expression (Infante
et al., 2013; Park et al., 2014; DeLaurier et al., 2006),Hoxc10shows
only a limited degree ofPitx1dependence, with a 25% reduction in
expression at E11.0 inPitx1−/−HL (FDR=0.006), whileHoxc11is
notPitx1dependent at E11.0 and the expression of neither gene is
Pitx1dependent at E11.5 (Fig. 4B, Fig. S5A). These results reveal putative enhancers where Pitx1 action may increase active
chromatin marks, but also highlight the complementary,
interrelated nature of the HL-restricted gene network.
Pitx1 directly targetsSox9and regulates the chondrogenic program in HL
In an effort to isolate the most certain and direct targets of Pitx1, we
sought to find genes withPitx1-dependent expression in HL at both
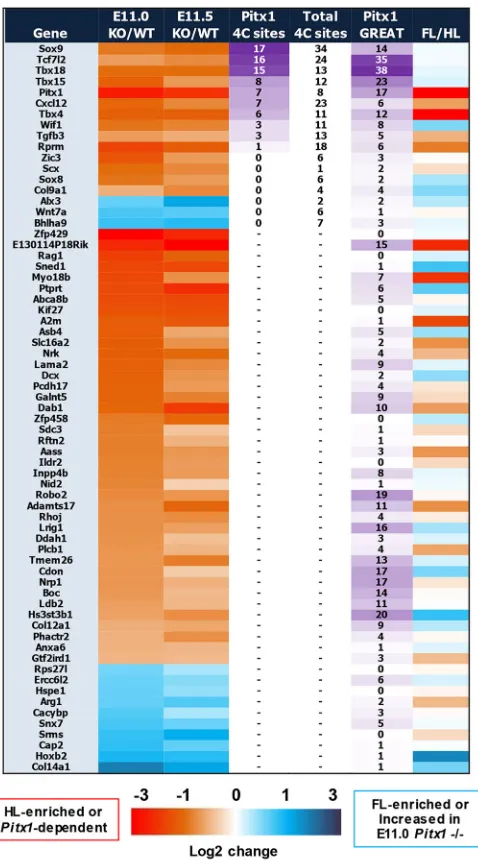
E11.0 and E11.5 at a highly significant threshold, and then to focus on these differentially expressed genes that show evidence of Pitx1 binding within the associated locus. We used two strategies to correlate Pitx1 binding sites with target genes: published 4C contacts data, at loci for which it is available (Andrey et al., 2017), as well as the aforementioned GREAT tool. Using FDR<0.00001 in
both the E11.0 and E11.5Pitx1−/−expression profiles reveals 67
genes, the overwhelming majority of which show decreased
expression inPitx1−/−: 54 genes are downregulated, whereas only
13 genes show increased expression in thePitx1−/−HL (Fig. 5). The
top four Pitx1-dependent genes most frequently targeted by Pitx1 at
regions of established enhancer-promoter contact areSox9,Tcf7l2,
Tbx15andTbx18(Fig. S1C): Pitx1 is found at a total of 41 regions that contact these genes (Fig. 5).
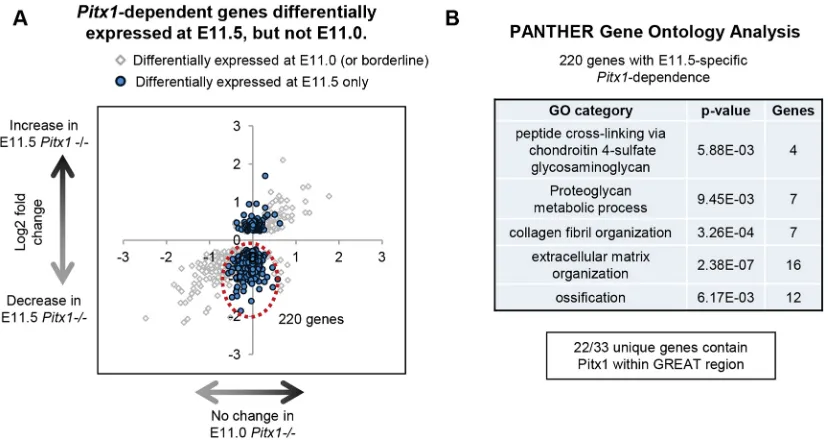
To assess the dynamic gene expression changes over the course of development, we also isolated the set of genes that are
differentially expressed in thePitx1−/−HL at E11.5 that show no
differential expression at E11.0 (Fig. 6A). We found that twice as many genes show decreased versus increased expression in the
Pitx1−/− HL: 220 versus 102, respectively (Fig. 6A). Gene
DEVEL
O
Ontology analysis shows that this larger set of Pitx1-dependent genes is enriched for genes associated with proteinaceous extracellular matrix, as well as collagens; in other words, genes associated with chondrogenesis and other tissues such as tendons, ligaments and muscle connective tissue (Fig. 6B).
We assayed the expression pattern ofSox9in E11.5 wt andPitx1−/−
HL byin situhybridization in order to assess the spatial changes in
expression that correspond to the quantitative changes we observe in our E11.0 and E11.5 expression profiles. We see a prominent patch of
Sox9expression in the anterior proximal wt HL that is absent in the
Pitx1−/−HL (Fig. 7A). We also tracked the skeletal phenotype of wt
and Pitx1−/− HL, as well as wt FL, over the course of their
development from E12.5 to E14.5, staining for cartilage with Alcian
Blue 8GX (Fig. 7B). We see that this anterior patch of Sox9
expression corresponds to regions of the HL that develop into the robust elements of the distal femur and proximal tibia, corresponding
to the regions most affected in thePitx1−/−HL. This large anterior
condensation never forms in the Pitx1−/−, and a weak pattern of
condensation patterned in the basic Y-shape of the FL still lacks intensity relative to the FL skeletal phenotype (Fig. 7B). These condensations are thin and undeveloped at E13.5, and by E14.5 there
is a visible kink in the developing femur of thePitx1−/−HL, a contrast
[image:5.612.84.522.70.507.2]to the patch of cells that migrate down from the shoulder to form the deltoid tuberosity in the humerus (Blitz et al., 2013), and an
Fig. 3. Conserved epigenetic landscape at putative enhancer loci in FL and HL.(A) Total number of peaks in Tbx5 and Pitx1 ChIPseq, performed in E10.5 FL and E11.5 HL, respectively. (B) Histogram of all Tbx5 and Pitx1 peaks, binned by peak distance to the TSS of the nearest gene. Up to one megabase, distance to the TSS is divided into 200 bins and set to a log10scale. (C)De novomotif search results, ordered byP-value, for Tbx5 and Pitx1 ChIPseq peaks. (D,F) Heatmaps of ChIPseq signal at Pitx1 non-promoter sites, i.e. at least 2.5 kb from the nearest TSS. Each heatmap covers a 5 kb window, charting the tag intensity of Pitx1 (D) and Tbx5 (F) along with the H3K27ac signal in stage-matched FL and HL, followed by the ratio of HL/FL tags. Each heatmap is sorted in the order of the HL/FL H3K27ac ratio. (E,G) Condensed profiles of ChIPseq signals for Pitx1 (E) and Tbx5 (G), as well as the H3K27ac and H3K27me3 profiles in FL and HL. The condensed profiles are merged views of the chromatin profiles surrounding every ChIPseq peak. They-axis indicates the normalized signal of the ChIPseq data, while the color scale corresponds to how many TF binding sites have a chromatin profile of the indicated intensity.
DEVEL
O
indication that the early chondrogenic defects observed in the
Pitx1−/−result ultimately in failed long-bone formation in the stylopod.
Pitx1 direct targeting ofSox9(Fig. 7C) and related chondrogenic genes
at earlier stages of limb development might thus be responsible for the
many skeletal defects observed in thePitx1−/−HL at later stages.
DISCUSSION
The FL and HL of tetrapods evolved from the pectoral and pelvic fins, respectively, during the fin-to-limb transition 360 million years ago
(reviewed by Clack, 2009). The role ofPitx1in generating differences
between posterior and anterior appendages has far-reaching evolutionary implications and is not unique to tetrapod limbs: the
expression ofPitx1has been associated with the presence or absence
[image:6.612.88.526.60.548.2]of pelvic fins in species of stickleback, which are ray-finned fish with distinct ancestry relative to the lobe-finned predecessors of modern tetrapods (Chan et al., 2010). Recent studies suggest that, between species, the early-stage limb development program is robustly conserved between divergent mammalian species (Sears et al., 2015). The classical model follows that FLs and HLs are serial homologs, although recently an alternative hypothesis has been put
Fig. 4. Active epigenetic marks are enriched at limb-specific loci.(A) Heatmaps and condensed profiles of the H3K27ac signal in FL and HL for the 129 Pitx1 non-promoter sites that show a ratio of HL/FL signal greater than 2. The condensed profile of Pitx1 at these sites is also shown. (B) Pitx1-targeted genes that show HL-enriched expression at FDR<0.01, along with the degree ofPitx1dependence of these associated genes. The log2fold change of gene expression is shown by heatmap for the stage-matched FL versus HL, as well as E11.0Pitx1−/−(KO) versus wt HL comparisons. The chart is sorted by the FDR of differential
gene expression in the E11.0Pitx1−/−versus wt comparison. (C) Three Pitx1-bound loci showing a 2-fold enrichment of H3K27ac in HL relative to FL.
DEVEL
O
forth that the extensive similarities between FLs and HLs are the result of convergent evolution during the fin-to-limb transition. Regardless of the origin of the similarity between the developmental programs of FLs and HLs, however, it is clear that the responsibility of generating limb-specific features of the FL and HL programs rests with a narrow network of limb-specific elements of this program. Our results match these evolutionary constraints, with few limb type-restricted genes and a broadly conserved developmental program.
HL patterning is largely implemented by transcriptional, not epigenetic, actions
Pitx1, a prominent HL-restricted gene, can manifest its role in HL patterning by tinkering with the established and common limb
program or by directly effecting skeletal pattern by regulation of the amount, timing and placement of chondrogenic condensation during limb development. It is clear, in light of our results and the abundance of data across species, that there is not an extensive, limb
type-restricted network downstream ofPitx1. Our results indicate
that Pitx1 binds to developmental enhancers that are ready to use in FL, which is to say that Pitx1 does not appear to engage in extensive remodeling of the chromatin state of its targets. This common state between FL and HL suggests that Pitx1 acts by direct transcriptional regulation rather than chromatin remodeling. The fact that the
preponderance of genes misregulated in the Pitx1−/− HL are
downregulated, as opposed to derepressed in its absence, combined with the active chromatin profile around Pitx1 target sites, suggests that Pitx1 predominantly functions to activate its transcriptional targets. Finally, the fact that Pitx1 targets a region with an
HL-enriched chromatin profile near thePitx1gene itself might suggest
autoregulation and, indeed, positive autoregulation of Pitx1
expression has been shown in the pituitary (Goodyer et al., 2003). Transcriptional activation is usually accompanied by enhancement of active enhancer chromatin marks, but this is different from an action such as that of pioneer factors which instill chromatin accessibility where there was none. Our data do not support a significant pioneer role for Pitx1. Rather, the data indicate that Pitx1 acts as a classical TF at enhancers in an active chromatin state (Fig. 7D).
Pitx1 modifies the common limb program as a member of a narrow HL-specific network
Previous analyses suggest a limited overlap between the
HL-specific components of the HL program:Isl1partially drivesTbx4
expression early in limb development, but is not necessary forTbx4
expression upon HL bud outgrowth, nor is it required forPitx1or
Hoxc10expression (Itou et al., 2012; Kawakami et al., 2011). Our
analysis confirms the parallel and independent nature ofPitx1and
Isl1, asIsl1expression is even increased in the absence ofPitx1. The
prominent target of Isl1, however, which is known to beHand2
(Itou et al., 2012), is shown here at E11.0 to bePitx1-dependent. We
do not see the complete abrogation ofShhexpression in thePitx1−/−
HL, however, as is the case inHand2−/−HL (Galli et al., 2010) and
Isl1−/−HL (Itou et al., 2012), although there is a 40% reduction in
Shh expression in the E11.0 Pitx1−/− HL (FDR=0.007). These
results further complement transgenic experiments in which ectopic
Pitx1expression in the FL suppressesShhsignaling pathways and
posteriorly expands the territory of Gli3 expression (DeLaurier
et al., 2006).
At the same time, Pitx1 regulates components of the anterior
patterning program, including Gli3, which are disrupted in the
absence ofPitx1. Although much of the research onShhandGli3
focuses on digit patterning in the autopod, it was shown thatGli3−/−
HLs display a reduction in femur size (Litingtung et al., 2002). The
decrease in femur length in thePitx1−/−might in part be due to the
decreased expression ofGli3in these HLs. In related work,Irx3and
Irx5were shown to have HL-specific contributions to anterior limb
pattern in a manner that is dependent on the interplay betweenShh
signaling and anterior patterning genes such asGli3(Li et al., 2014).
Irx5is not differentially expressed inPitx1−/−HL at E11.0 or E11.5,
however, and Irx3 shows only a slight decrease in expression in
Pitx1−/− HL above the threshold of significance taken here
(FDR=0.014). It is therefore likely that Pitx1 and Irx3/5 both
contribute to the development of anterior structures in HL, but not interdependently.
[image:7.612.56.295.56.487.2]Tbx15 andTbx18 are revealed in this study as direct targets of Pitx1, with Pitx1-dependent expression in the HL, although both
Fig. 5. Cross-stage analysis ofPitx1-dependent genes linked to genomic landscape.Pitx1-dependent genes that show highly significant changes at both E11.0 and E11.5, using FDR<0.00001 for both comparisons. The log2 fold change of gene expression is shown by heatmap at both stages, as well as for stage-matched FL versus HL (last column). The total number of 4C sites (Andrey et al., 2017) and the number of Pitx1 binding sites present in these 4C contact regions are indicated for each gene. The number of Pitx1 binding sites that occur within the GREAT-defined window of region-gene associations is also shown for each gene.
DEVEL
O
genes are also expressed in the FL.Tbx15and Tbx18are closely
related members of the Tbx1 subfamily of T-box genes
(Papaioannou, 2014). Tbx15 is strongly expressed in the core
mesenchyme of the developing limb bud andTbx15−/−mice show
skeletal defects in both FL and HL, including reduced femur size
(Singh et al., 2005). Tbx18is expressed in the anterior-proximal
limb mesenchyme (Kraus et al., 2001), although there are no
morphological effects on the limb inTbx18−/−mice (Bussen et al.,
2004). In light of the fact thatPitx1is necessary for the expression of
Tbx4, Tbx15 and Tbx18, it is possible that there is a degree of functional redundancy between these genes, and that Pitx1 exerts an influence in the early HL mesenchyme by coordinating the expression of all three genes.
Our data also show thatPitx1directly targetsSox9(Fig. 7D), and
there is a marked loss ofSox9expression in the earlyPitx1−/−HL in
regions that correspond to the most prominent skeletal defects in the
fully formedPitx1−/−HL. Ultimately, bones do form in thePitx1−/−
HL, so the chondrogenic cascade is not completely disrupted and
Pitx1is not explicitly necessary for condensation and skeletogenesis
in the HL. This does not preclude a role of Pitx1expression in
directly controlling the total number of cells that condense in the anterior HL. Pitx1 might alter the rate of proliferation of
uncommitted mesenchymal progenitors, directly stimulate
commitment to theSox9-positive chondrogenic lineage, influence
proliferation of Sox9-positive cells, or any combination of these
possibilities. This direct manner of regulation might occur
complementarily to, or in concert with, Pitx1-dependent
regulation of T-box family genes and anterior-posterior patterning genes. Further, expression of these regulators in the early HL bud (Marcil et al., 2003) is consistent with the present interpretation.
How to make a different limb
In summary, the broad set of Pitx1 targets suggests a role as a major modulator of the limb development program. This action is
implemented through transcriptional regulation ( primarily
activation) of a large set of target genes. These target genes are for
the most part expressed in both FL and HL and therefore the effect of Pitx1 action (and of the downstream Tbx4, or of Tbx5 in FL) is to reorganize the gene expression patterns throughout the developing
bud. It is this reorganized program–the sum of small changes that
create a distinction in aggregate–that defines HL identity.
MATERIALS AND METHODS
Chromatin immunoprecipitation (ChIP)
All animal experimentation was approved by the IRCM Animal Ethics Review Board and followed Canadian guidelines. ChIP was performed using limb bud tissue collected from CD1 mice ordered from Charles River Laboratories or bred in the animal facilities of the IRCM. Embryonic day (E) 0.5 was designated to be noon of the day on which a plug was found. Pitx1 ChIPseq was performed with HL tissue from mice staged at E11.5, while Tbx5 ChIPseq was performed on the FL of mice staged at E10.5. Limb buds were collected in cold 1× PBS, cross-linked with 1% formaldehyde for 14 min, and chromatin was sheared using a manual sonication probe. Previously validated homemade rabbit antibodies against Pitx1 (Lamonerie et al., 1996; Tremblay et al., 1998; Marcil et al., 2003) and Tbx5 (Georges et al., 2008) were used, and all ChIPs were performed with equal amounts of Protein A and Protein G Dynabeads (Invitrogen). These TF ChIPseq samples were sequenced on an Illumina HiSeq 4000 platform, yielding 50 bp, paired-end reads, which were then mapped to mm10 using Bowtie2 version 2.2.6 (Langmead et al., 2009). Peaks were called using MACS2 with default parameters for paired-end reads (Zhang et al., 2008), and peaks with summits present in genome-wide RepeatMasker or an Encode-sourced comprehensive empirical blacklist of regions with artificially high signal were removed, as were summits whose loci contained anomalous input signal (RepeatMasker Open-3.0, http://www.repeatmasker.org) (ENCODE Project Consortium, 2012). Pitx1 summits from our data that appeared at any region within a peak defined in Infante et al. (2013) were considered to be present in both datasets.De novomotif searches were performed on peaklists using HOMER with default parameters (Heinz et al., 2010). Non-promoter sites are defined as summits greater than 2.5 kb from the nearest TSS present in the gene annotation from Encode version M11 (Ensembl 86). ChIPseq tracks for visualization were created in HOMER and displayed using Integrated Genome Viewer (IGV) (Thorvaldsdottir et al., 2013).
[image:8.612.100.514.57.277.2]For the chromatin profiles of stage-matched FL and HL, samples were sequenced on the Illumina HiSeq 4000 platform, yielding 50 bp, single-end
Fig. 6. Identification of HL stage-specificPitx1-dependent genes.(A) Two-dimensional representation of genes showingPitx1-dependent gene expression at E11.5 but not at E11.0. Thex-axis indicates the log2fold change of gene expression in the E11.0Pitx1−/−versus wt HL, while they-axis indicates the log2fold change of gene expression in the E11.5Pitx1−/−versus wt HL. The genes in blue show no significant change in expression at E11.0 (FDR>0.1) but show highly significant changes at E11.5 (FDR<0.001). Genes in gray have a FDR<0.1 at E11.0. (B) The newly misexpressed genes encircled in red in A were isolated and submitted for PANTHER-sourced GO analysis, sorted by hierarchy, i.e. from the most specific GO subcategory to the most general.
DEVEL
O
reads. These single-end read datasets were mapped to mm10 using Bowtie version 1.1.2 (Langmead et al., 2009). Genome-wide correlations were performed using EASeq (Lerdrup et al., 2016). Heatmaps, computed over a 5 kb window divided into 500 10-bp bins, as well as corresponding fillplots, were also created in EAseq.
Expression profiling by RNAseq
For stage-matched E10.5 FL versus E11.0 HL comparisons, limb tissue was collected from wt CD1 mice. Somites were counted for each embryo: 33-36 somite FLs were taken as E10.5 FLs and 38-42 somite HLs were taken as E11.0 HLs. Both E11.0 and E11.5Pitx1−/−versus wt HL comparisons were performed in a Balb/c background. All animal experimentation was approved by the IRCM Animal Ethics Review Board and followed Canadian guidelines.
RNA samples were collected via silica gel spin-column purification. For E10.5 FL versus E11.0 HL, one replicate was prepared using a strand-specific ribosomal RNA-depleted RNAseq kit from Illumina (TruSeq Stranded Total RNA). One replicate of E11.0Pitx1−/−versus wt HL was prepared using only the left HL, using a strand-specific ribosomal RNA-depleted KAPA kit (KAPA Stranded RNA-Seq Library) with Ribozero Gold (Epicentre), and one replicate of E11.5 Pitx1−/− versus wt HL was prepared using an unstranded, TruSeq mRNA enrichment library prep kit (Illumina). Two additional replicates of E10.5 FL versus E11.0 HL and E11.0 Pitx1−/− versus wt HL were prepared using the strand-specific ribosomal RNA-depleted KAPA kit with Ribozero Gold (Epicentre), and two additional replicates of E11.5
[image:9.612.81.530.55.533.2]Pitx1−/− versus wt HL were prepared using an mRNA-enrichment kit
Fig. 7. Chondrogenesis is regulated by Pitx1.(A)Sox9expression, detected byin situhybridization at E11.5 in FL, wt HL andPitx1−/−HL. (B) Alcian Blue
cartilage staining in FL, wt HL andPitx1−/−HL. (C) ChIPseq tracks of Pitx1, HL input (control), as well as Pitx1 peak-calling hits and 4C contact regions
(Andrey et al., 2017) in the 2 Mb region surrounding theSox9gene. TheSox9TAD (Franke et al., 2016) is indicated. (D) Model of Pitx1 role in HL program. For implementation of HL identity, Pitx1 targets limb enhancers that are in a similar active chromatin state in both FL and HL. The chondrogenic program is a major target of Pitx1 action.
DEVEL
O
from NEB [NEBnext poly(A) mRNA magnetic isolation] and the KAPA Stranded RNA-Seq Library.
For each comparison, three total replicates were fused for an experimental design with two conditions and two batches for each condition. All reads were mapped to the genome using STAR (Dobin et al., 2013). Transcript features were counted using featureCounts (Liao et al., 2014). All RNAseq experiments were analyzed using edgeR with robust dispersion estimates, likelihood ratio testing, and a generalized linear model (GLM), allowing us to accommodate batch effects between replicates (Robinson et al., 2010; McCarthy et al., 2012; Zhou et al., 2014).
In situhybridization and cartilage stains
In situ hybridization was performed using anti-digoxigenin and probes
generated fromSox9cDNA plasmid digested withBamHI. Cartilage stains of E12.5 through E14.5 mouse embryos were performed by fixing embryos in Bouin’s fluid, bleaching embryos in 70% ethanol/0.1% ammonium hydroxide, staining with 0.05% Alcian Blue 8GX in 5% acetic acid, and clearing embryos with 2:1 benzyl benzoate:benzyl alcohol solution, similar to Nagy et al. (2009).
Acknowledgements
We thank Isabelle Brisson, Dimitar Dimitrov and Sara Demontigny for their work in the IRCM animal care facility; Amandine Bemmo for helpful assistance with bioinformatics analyses; Mona Nemer, University of Ottawa, for the gift of Tbx5 antibody; and Évelyne Joyal and Tabasum Abdul-Rasul for secretarial work.
Competing interests
The authors declare no competing or financial interests.
Author contributions
Conceptualization: S.N., J.D.; Methodology: S.N., J.D.; Formal analysis: S.N.; Investigation: S.N., M.L., A.H.S.; Resources: T.P., J.D.; Data curation: S.N., D.J.; Writing - original draft: S.N.; Writing - review & editing: S.N., J.D.; Visualization: S.N.; Supervision: J.D.; Project administration: J.D.; Funding acquisition: T.P., J.D.
Funding
This work was supported by grants (MOP-123213, CEEHRC EP1-120608) from the Canadian Institutes of Health Research (CIHR).
Data availability
ChIPseq and RNAseq data have been deposited at Gene Expression Omnibus under accession number GSE100734.
Supplementary information
Supplementary information available online at
http://dev.biologists.org/lookup/doi/10.1242/dev.154864.supplemental
References
Andrey, G., Schöpflin, R., Jerković, I., Heinrich, V., Ibrahim, D. M., Paliou, C., Hochradel, M., Timmermann, B., Haas, S., Vingron, M. et al. (2017). Characterization of hundreds of regulatory landscapes in developing limbs reveals two regimes of chromatin folding.Genome Res.27, 223-233.
Blitz, E., Sharir, A., Akiyama, H. and Zelzer, E.(2013). Tendon-bone attachment unit is formed modularly by a distinct pool of Scx- and Sox9-positive progenitors. Development140, 2680-2690.
Bussen, M., Petry, M., Schuster-Gossler, K., Leitges, M., Gossler, A. and Kispert, A.(2004). The T-box transcription factor Tbx18 maintains the separation of anterior and posterior somite compartments.Genes Dev.18, 1209-1221.
Cao, R., Wang, L., Wang, H., Xia, L., Erdjument-Bromage, H., Tempst, P., Jones, R. S. and Zhang, Y.(2002). Role of histone H3 lysine 27 methylation in Polycomb-group silencing.Science298, 1039-1043.
Cardozo, M. J., Sánchez-Arrones, L., Sandonis, A., Sánchez-Camacho, C., Gestri, G., Wilson, S. W., Guerrero, I. and Bovolenta, P.(2014). Cdon acts as a Hedgehog decoy receptor during proximal-distal patterning of the optic vesicle. Nat. Commun.5, 4272.
Chan, Y. F., Marks, M. E., Jones, F. C., Villarreal, G., Jr, Shapiro, M. D., Brady, S. D., Southwick, A. M., Absher, D. M., Grimwood, J., Schmutz, J. et al.(2010). Adaptive evolution of pelvic reduction in sticklebacks by recurrent deletion of a Pitx1 enhancer.Science327, 302-305.
Clack, J.-A.(2009). The fin to limb transition: new data, interpretations, and hypotheses from paleontology and developmental biology. Annu. Rev. Earth Planet. Sci.37, 163.
Cobb, J., Dierich, A., Huss-Garcia, Y. and Duboule, D.(2006). A mouse model for human short-stature syndromes identifies Shox2 as an upstream regulator of Runx2 during long-bone development. Proc. Natl. Acad. Sci. USA 103, 4511-4515.
Cotney, J., Leng, J., Oh, S., Demare, L. E., Reilly, S. K., Gerstein, M. B. and Noonan, J. P.(2012). Chromatin state signatures associated with tissue-specific gene expression and enhancer activity in the embryonic limb.Genome Res.22, 1069-1080.
DeLaurier, A., Schweitzer, R. and Logan, M. (2006). Pitx1 determines the morphology of muscle, tendon, and bones of the hindlimb.Dev. Biol.299, 22-34.
Dobin, A., Davis, C. A., Schlesinger, F., Drenkow, J., Zaleski, C., Jha, S., Batut, P., Chaisson, M. and Gingeras, T. R.(2013). STAR: ultrafast universal RNA-seq aligner.Bioinformatics29, 15-21.
ENCODE Project Consortium (2012). An integrated encyclopedia of DNA elements in the human genome.Nature489, 57-74.
Franke, M., Ibrahim, D. M., Andrey, G., Schwarzer, W., Heinrich, V., Schopflin, R., Kraft, K., Kempfer, R., Jerkovic, I., Chan, W. L. et al.(2016). Formation of new chromatin domains determines pathogenicity of genomic duplications. Nature538, 265-269.
Galli, A., Robay, D., Osterwalder, M., Bao, X., Bénazet, J.-D., Tariq, M., Paro, R., Mackem, S. and Zeller, R.(2010). Distinct roles of Hand2 in initiating polarity and posterior Shh expression during the onset of mouse limb bud development.PLoS Genet.6, e1000901.
Georges, R., Nemer, G., Morin, M., Lefebvre, C. and Nemer, M.(2008). Distinct expression and function of alternatively spliced Tbx5 isoforms in cell growth and differentiation.Mol. Cell. Biol.28, 4052-4067.
Gibson-Brown, J. J., Agulnik, S. I., Silver, L. M., Niswander, L. and Papaioannou, V. E. (1998). Involvement of T-box genes Tbx2-Tbx5 in vertebrate limb specification and development.Development125, 2499-2509.
Goodyer, C. G., Tremblay, J. J., Paradis, F. W., Marcil, A., Lanctôt, C., Gauthier, Y. and Drouin, J.(2003). Pitx1in vivopromoter activity and mechanisms of positive autoregulation.Neuroendocrinol.78, 129-137.
Heinz, S., Benner, C., Spann, N., Bertolino, E., Lin, Y. C., Laslo, P., Cheng, J. X., Murre, C., Singh, H. and Glass, C. K.(2010). Simple combinations of lineage-determining transcription factors prime cis-regulatory elements required for macrophage and B cell identities.Mol. Cell38, 576-589.
Infante, C. R., Park, S., Mihala, A. G., Kingsley, D. M. and Menke, D. B.(2013). Pitx1 broadly associates with limb enhancers and is enriched on hindlimb cis-regulatory elements.Dev. Biol.374, 234-244.
Itou, J., Kawakami, H., Quach, T., Osterwalder, M., Evans, S. M., Zeller, R. and Kawakami, Y.(2012). Islet1 regulates establishment of the posterior hindlimb field upstream of the Hand2-Shh morphoregulatory gene network in mouse embryos. Development139, 1620-1629.
Kawakami, Y., Marti, M., Kawakami, H., Itou, J., Quach, T., Johnson, A., Sahara, S., O’leary, D. D. M., Nakagawa, Y., Lewandoski, M. et al. (2011). Islet1-mediated activation of the beta-catenin pathway is necessary for hindlimb initiation in mice.Development138, 4465-4473.
Kraus, F., Haenig, B. and Kispert, A.(2001). Cloning and expression analysis of the mouse T-box gene Tbx18.Mech. Dev.100, 83-86.
Lamonerie, T., Tremblay, J. J., Lanctôt, C., Therrien, M., Gauthier, Y. and Drouin, J.(1996). PTX1, abicoid-related homeo box transcription factor involved in transcription of pro-opiomelanocortin (POMC) gene. Genes Dev. 10, 1284-1295.
Lanctôt, C., Lamolet, B. and Drouin, J.(1997). Thebicoid-related homeoprotein Ptx1 defines the most anterior domain of the embryo and differentiates posterior from anterior lateral mesoderm.Development124, 2807-2817.
Lanctôt, C., Moreau, A., Chamberland, M., Tremblay, M. L. and Drouin, J.
(1999). Hindlimb patterning and mandible development require thePtx1gene. Development126, 1805-1810.
Langmead, B., Trapnell, C., Pop, M. and Salzberg, S. L.(2009). Ultrafast and memory-efficient alignment of short DNA sequences to the human genome. Genome Biol.10, R25.
Lerdrup, M., Johansen, J. V., Agrawal-Singh, S. and Hansen, K.(2016). An interactive environment for agile analysis and visualization of ChIP-sequencing data.Nat. Struct. Mol. Biol.23, 349-357.
Li, D., Sakuma, R., Vakili, N. A., Mo, R., Puviindran, V., Deimling, S., Zhang, X., Hopyan, S. and Hui, C. C.(2014). Formation of proximal and anterior limb skeleton requires early function of Irx3 and Irx5 and is negatively regulated by Shh signaling.Dev. Cell29, 233-240.
Liao, Y., Smyth, G. K. and Shi, W.(2014). featureCounts: an efficient general purpose program for assigning sequence reads to genomic features. Bioinformatics30, 923-930.
Litingtung, Y., Dahn, R. D., Li, Y., Fallon, J. F. and Chiang, C.(2002). Shh and Gli3 are dispensable for limb skeleton formation but regulate digit number and identity. Nature418, 979-983.
Marcil, A., Dumontier, É., Chamberland, M., Camper, S. A. and Drouin, J.
(2003). Pitx1 and Pitx2 are required for development of hindlimb buds.
Development130, 45-55.
DEVEL
O
McCarthy, D. J., Chen, Y. and Smyth, G. K.(2012). Differential expression analysis of multifactor RNA-Seq experiments with respect to biological variation.Nucleic Acids Res.40, 4288-4297.
McLean, C. Y., Bristor, D., Hiller, M., Clarke, S. L., Schaar, B. T., Lowe, C. B., Wenger, A. M. and Bejerano, G. (2010). GREAT improves functional interpretation of cis-regulatory regions.Nat. Biotechnol.28, 495-501.
Minguillon, C., Del Buono, J. and Logan, M. P.(2005). Tbx5 and Tbx4 are not sufficient to determine limb-specific morphologies but have common roles in initiating limb outgrowth.Dev. Cell8, 75-84.
Mo, R., Freer, A. M., Zinyk, D. L., Crackower, M. A., Michaud, J., Heng, H. H., Chik, K. W., Shi, X. M., Tsui, L. C., Cheng, S. H. et al.(1997). Specific and redundant functions of Gli2 and Gli3 zinc finger genes in skeletal patterning and development.Development124, 113-123.
Nagy, A., Gertsenstein, M., Vintersten, K. and Behringer, R.(2009). Alcian blue staining of the mouse fetal cartilaginous skeleton.Cold Spring Harb. Protoc.2009, pdb.prot5169.
Nelson, C. E., Morgan, B. A., Burke, A. C., Laufer, E., Dimambro, E., Murtaugh, L. C., Gonzales, E., Tessarollo, L., Parada, L. F. and Tabin, C.(1996). Analysis of Hox gene expression in the chick limb bud.Development122, 1449-1466.
Ohuchi, H., Takeuchi, J., Yoshioka, H., Ishimaru, Y., Ogura, K., Takahashi, N., Ogura, T. and Noji, S.(1998). Correlation of wing-leg identity in ectopic FGF-induced chimeric limbs with the differential expression of chick Tbx5 and Tbx4. Development125, 51-60.
Ouimette, J.-F., Lavertu Jolin, M., L’honoré, A., Gifuni, A. and Drouin, J.(2010). Divergent transcriptional activities determine limb identity.Nat. Commun.1, 35.
Papaioannou, V. E.(2014). The T-box gene family: emerging roles in development, stem cells and cancer.Development141, 3819-3833.
Park, S., Infante, C. R., Rivera-Davila, L. C. and Menke, D. B.(2014). Conserved regulation of hoxc11 by pitx1 in Anolis lizards.J. Exp. Zool. B Mol. Dev. Evol.322, 156-165.
Petit, F., Sears, K. E. and Ahituv, N.(2017). Limb development: a paradigm of gene regulation.Nat. Rev. Genet.18, 245-258.
Pieretti, J., Gehrke, A. R., Schneider, I., Adachi, N., Nakamura, T. and Shubin, N. H.(2015). Organogenesis in deep time: a problem in genomics, development, and paleontology.Proc. Natl. Acad. Sci. USA112, 4871-4876.
Probst, S., Kraemer, C., Demougin, P., Sheth, R., Martin, G. R., Shiratori, H., Hamada, H., Iber, D., Zeller, R. and Zuniga, A.(2011). SHH propagates distal limb bud development by enhancing CYP26B1-mediated retinoic acid clearance via AER-FGF signalling.Development138, 1913-1923.
Robinson, M. D., McCarthy, D. J. and Smyth, G. K.(2010). edgeR: a Bioconductor package for differential expression analysis of digital gene expression data. Bioinformatics26, 139-140.
Rodriguez-Esteban, C., Tsukui, T., Yonei, S., Magallon, J., Tamura, K. and Izpisua Belmonte, J. C.(1999). The T-box genes Tbx4 and Tbx5 regulate limb outgrowth and identity.Nature398, 814-818.
Samuel, C. S., Zhao, C., Bathgate, R. A., Du, X. J., Summers, R. J., Amento, E. P., Walker, L. L., McBurnie, M., Zhao, L. and Tregear, G. W.(2005). The relaxin gene-knockout mouse: a model of progressive fibrosis.Ann. N. Y. Acad. Sci.1041, 173-181.
Sears, K. E., Capellini, T. D. and Diogo, R.(2015). On the serial homology of the pectoral and pelvic girdles of tetrapods.Evolution69, 2543-2555.
Shlyueva, D., Stampfel, G. and Stark, A.(2014). Transcriptional enhancers: from properties to genome-wide predictions.Nat. Rev. Genet.15, 272-286.
Shubin, N., Tabin, C. and Carroll, S.(1997). Fossils, genes and the evolution of animal limbs.Nature388, 639-648.
Singh, M. K., Petry, M., Haenig, B., Lescher, B., Leitges, M. and Kispert, A.
(2005). The T-box transcription factor Tbx15 is required for skeletal development. Mech. Dev.122, 131-144.
Spielmann, M., Brancati, F., Krawitz, P. M., Robinson, P. N., Ibrahim, D. M., Franke, M., Hecht, J., Lohan, S., Dathe, K., Nardone, A. M. et al.(2012). Homeotic arm-to-leg transformation associated with genomic rearrangements at the PITX1 locus.Am. J. Hum. Genet.91, 629-635.
Szeto, D. P., Rodriguez-Esteban, C., Ryan, A. K., O’Connell, S. M., Liu, F., Kioussi, C., Gleiberman, A. S., Izpisua-Belmonte, J. C. and Rosenfeld, M. G.
(1999). Role of the Bicoid-related homeodomain factor Pitx1 in specifying hindlimb morphogenesis and pituitary development.Genes Dev.13, 484-494.
Takeuchi, J. K., Koshiba-Takeuchi, K., Matsumoto, K., Vogel-Höpker, A., Naitoh-Matsuo, M., Ogura, K., Takahashi, N., Yasuda, K. and Ogura, T.(1999). Tbx5 and Tbx4 genes determine the wing/leg identity of limb buds.Nature398, 810-814.
Thorvaldsdottir, H., Robinson, J. T. and Mesirov, J. P. (2013). Integrative Genomics Viewer (IGV): high-performance genomics data visualization and exploration.Brief. Bioinform.14, 178-192.
Tremblay, J. J., Lanctôt, C. and Drouin, J.(1998). The pan-pituitary activator of transcription, Ptx-1 ( pituitary homeobox 1), acts in synergy with SF-1 and Pit1 and is an upstream regulator of the Lim-homeodomain gene Lim3/Lhx3. Mol. Endocrinol.12, 428-441.
Wellik, D. M. and Capecchi, M. R.(2003). Hox10 and Hox11 genes are required to globally pattern the mammalian skeleton.Science301, 363-367.
Xu, B. and Wellik, D. M.(2011). Axial Hox9 activity establishes the posterior field in the developing forelimb.Proc. Natl. Acad. Sci. USA108, 4888-4891.
Zhang, Y., Liu, T., Meyer, C. A., Eeckhoute, J., Johnson, D. S., Bernstein, B. E., Nusbaum, C., Myers, R. M., Brown, M., Li, W. et al.(2008). Model-based analysis of ChIP-Seq (MACS).Genome Biol.9, R137.
Zhou, X., Lindsay, H. and Robinson, M. D.(2014). Robustly detecting differential expression in RNA sequencing data using observation weights.Nucleic Acids Res.42, e91.