Changes in tendon spatial frequency
parameters with loading
Pearson, S, Engel, AJ and Bashford, GR
http://dx.doi.org/10.1016/j.jbiomech.2017.03.017
Title
Changes in tendon spatial frequency parameters with loading
Authors
Pearson, S, Engel, AJ and Bashford, GR
Type
Article
URL
This version is available at: http://usir.salford.ac.uk/id/eprint/42250/
Published Date
2017
USIR is a digital collection of the research output of the University of Salford. Where copyright
permits, full text material held in the repository is made freely available online and can be read,
downloaded and copied for noncommercial private study or research purposes. Please check the
manuscript for any further copyright restrictions.
1
Changes in tendon spatial frequency parameters with loading
1 2 3 4
Stephen J. Pearson1, Aaron J. Engel2, Gregory R. Bashford2
5 6 7
8
1Centre of Health, Sport and Rehabilitation Sciences Research, University of Salford, Manchester, M6
9
6PU, United Kingdom. 2Dept. of Biological Systems Engineering
10
University of Nebraska-Lincoln, USA
11
12
13
Corresponding author: Dr Stephen Pearson- [email protected]; Tel: 01612952673 14
15 16 17 18
Keywords: Mechanical properties, Patella Tendon, transverse strain, Ultrasound, Micro-morphology
19 20
2
Abstract
22
To examine and compare the loading related changes in micro-morphology of the patellar tendon. 23
Fifteen healthy young males (age 19 ± 3 yrs, body mass 83 ± 5 kg) were utilised in a within subjects 24
matched pairs design. B mode ultrasound images were taken in the sagittal plane of the patellar tendon 25
at rest with the knee at 90flexion. Repeat images were taken whilst the subjects were carrying out 26
maximal voluntary isometric contractions. 27
Spatial frequency parameters related to the tendon morphology were determined within regions of 28
interest (ROI) from the B mode images at rest and during isometric contractions. 29
A number of spatial parameters were observed to be significantly different between resting and 30
contracted images (Peak spatial frequency radius (PSFR), axis ratio, spatial Q-factor, PSFR amplitude 31
ratio, and the sum). These spatial frequency parameters were indicative of acute alterations in the 32
tendon micro-morphology with loading. 33
Acute loading modifies the micro-morphology of the tendon, as observed via spatial frequency analysis. 34
Further research is warranted to explore its utility with regard to different loading induced micro-35
morphological alterations, as these could give valuable insight not only to aid strengthening of this 36
tissue but also optimization of recovery from injury and treatment of conditions such as tendinopathies. 37
3
Introduction
40
Tendons are made up predominantly of collagen (60-85% of dry weight) (Józsa et al., 1989), with type I 41
collagen being the predominant type. There are also elastin elements 1 - 2 % (Kirkendall and Garrett, 42
1997), which are embedded with the collagen in a proteoglycan - water matrix. These elements give 43
tendons viscoelastic properties and as such they respond acutely to loading in a load (elastic) and time 44
(viscous) dependent way (Ker et al., 2000). 45
46
The collagen component of the tendon can be seen to be the main structural element and its structure 47
reflects the loading deformation characteristics seen, with a nonlinear 'toe' (beginning of loading 48
region) region as a consequence of the 'crimp' (bunching of collagen fibres) seen in resting collagen 49
structures (Diamant et al., 1972), to a then reasonably linear elastic region reflective of the elastin 50
structures within the tendon and sliding of the tropocollagen molecules and associated stretching of the 51
triple collagen helices (Folkhard et al., 1987). There is also interstitial fluid flow seen with loading of 52
tendons, possibly representing the viscous element (Hannafin and Arnoczky, 1994). The loading of 53
tendons can result in physiologic adaptations which may be beneficial or detrimental, dependant on the 54
loading. Tendons transfer the load via mechanotransduction from the cellular matrix to the tendon cells, 55
resulting in biochemical responses at cellular level. 56
57
Loading protocols have previously been investigated in an attempt to identify optimal strategies for 58
adaptation and or recovery from injury and conditions such as tendinopathies. For example, a number 59
of studies have measured tendon cross-sectional area (CSA) and observed any increases after a period of 60
loading. Of those that have utilized MRI to determine changes it was reported that short term loading 61
(12 weeks and 9 weeks respectively) can result in region specific hypertrophic changes (Kongsgaard et 62
4
to the tendon structure as indicated by increases in Young’s Modulus (Reeves et al., 2003;Bohm et al., 64
2014). In the Bohm et al. study, high strain rate loading was seen to be preferential in producing tendon 65
adaptation. 66
67
The mechanisms underlying adaptation are unclear. Studies examining acute cyclic loading have shown 68
changes in transverse strain. Here reductions in the tendon thickness are evident when loaded (Wearing 69
et al., 2013). The loading associated reduction in tendon thickness is suggested to be in part due to 70
fluid transfer out of the tendon. However, acute changes in thickness during loading are also indicative 71
of alterations of the tendon architecture. Here alignment and increased density of the collagen 72
structures occurs with tensile loading (York et al., 2014). Changes in the tendon component 73
arrangements can be indirectly described by the tendon stress/strain characteristic relationship. Below 74
2% strain (the toe region) represents the "stretching-out" of crimped tendon fibrils with tensile loading. 75
This typical mechanical observation due to the 'crimped' fibril pattern can change to some degree, due 76
to the differential crimp angle and crimp length between structures. With increased loading, a linear 77
region in the stress strain curve appears (up to approx 4-5 % strain). Here the collagen fibrils begin to 78
alter their conformation and align themselves in the direction of tensile loading. These characteristic 79
alterations in the tendon micro-morphology with loading may possibly be identified with ultrasound 80
imaging (Kostyuk et al., 2004). 81
82
Visualisation of the tendon using B-mode ultrasound shows an anisotropic speckle pattern in which the 83
pattern or image texture and brightness depends on the spatial distribution of the acoustic scatters 84
within the tendon. This characteristic pattern and intensity is affected by the tendon structure and 85
5
present has a spatial frequency signature with a significant magnitude element and narrow frequency 87
bandwidth about the peak spatial frequency (Bashford et al., 2008). 88
89
Analysis of tendon pathology had been previously performed in the frequency domain (Bashford et al., 90
2008). Previous work has shown peak spatial frequency radius (PSFR) in a tendon to be correlated with 91
tendon elasticity (Kulig et al., 2016). Tendon is made up of elastic polymers. At rest, the individual 92
polymer are more bundled, they can be stretched a finite length before breaking (Rigby et al., 1959). If 93
ultrasound frequency analysis is able to categorise tendon mechanical properties it may be useful to 94
examine whether this approach is sensitive enough to detect acute alterations in the tendon micro-95
architecture with loading. 96
97
Thus it can be seen that the acute loading and the mode of loading may influence the tendon response 98
with acute loading. Hence this study applies the use of spatial frequency analysis of the tendon B mode 99
images to examine indicators of acute changes within the tendon structure. 100
6
Materials & Methods
104
15 male participants all gave their written informed consent and were included in this study (age 19 ± 3 105
yrs, body mass 83 ± 5 kg). All experimentation was approved by the local ethics committee and all 106
procedures were in accordance with the world medical association Declaration of Helsinki (2013). 107
B-Mode ultrasound images ( 7.5 MHz 100mm linear array B-mode ultrasound probe (Mylab 70, Esaote 108
Biomedica, Italy) with a depth setting of 30mm were taken of the patellar tendon in the sagittal plane, 109
both whilst they were unloaded and during maximal voluntary isometric contractions (MVC), held for 110
approx 5 secs with the knee flexed to 900. A familiarisation isometric contraction was performed prior to
111
the test contraction for all subjects. Figure 1 shows an example of an unloaded and loaded tendon. For 112
each image pair, a region of interest (ROI) was selected corresponding to the tendon tissue seen within 113
the image. Within the ROI, Cohens d was calculated by 114
115
𝑑 = 𝑋̅
𝜎𝑋
116 117
where 𝑋 is the paired differences of the samples and 𝜎𝑋 is the standard deviation of the paired
118
differences. P-values were estimated using a permutation test on 𝑋. A total of 10000 permutations were 119
used. 120
121
𝑝 =∑ (𝑋̅̅̅̅ ≥ 𝑋𝑛 ̅̅̅) 0 10000
𝑛=1 10000
122 123
Here 𝑋̅̅̅0 is the observed average difference and 𝑋𝑛 is the n-th permutation of the observed data.
124 125 126
1
7 127
Image analysis and parameter extraction 128
Spatial frequency analysis was carried out in a manner similar to Bashford and co workers 2008 129
(Bashford et al., 2008). Briefly, digitally stored images in jpeg format were imported into MATLAB where 130
all analyses were completed with custom in-house algorithms. An ROI enclosing the tendon area of 131
interest was selected by cursor (See Fig 1). Within the ROI, every possible 2mm-square kernel 132
circumscribed by the ROI was analyzed. For each kernel, eight spatial frequency parameters were 133
extracted (see Table 1). The number of kernels circumscribed by the ROI was the number of 134
observations made of each parameter. 135
136
Statistical analyses 137
All statistical analyses were carried out in SPSS (Ver 20; IBM Corp) and MATLAB (ver 8.4, Mathworks, 138
Natick, MA). SPSS was used to calculate normality of data and determined by the Shapiro Wilks test. 139
Paired Student t-tests were utilised to determine any significant differences for tendon thickness and 140
between the frequency determinants for the ROI. Alpha level was set to 0.05. 141
MATLAB was used to analyze spatial frequency parameter statistics. Paired student t-tests were utilized 142
to determine any significant differences between the spatial frequency parameters between loaded and 143
unloaded tendons. The alpha level was set to 0.05. 144
145
8
Results
147
Table 2 shows the paired statistics for unloaded to loaded tendons. Here only the whole tendon data is 148
shown. The parameters that met statistically significant differences are the Peak Spatial Frequency 149
Radius, Axis Ratio, Mmax%, and the Sum where tendon loading produced an increase of 0.51, 0.67, 1.21 150
and decrease of 1.04 standard deviations of the estimate respectively. 151
9
Discussion
155
The results here show characteristic changes in the frequency analysis of the patellar tendon during 156
acute maximal isometric loading. In particular, increases in the peak spatial frequency radius, axis ratio, 157
and sum were seen with a concurrent decrease in normalized peak spatial frequency amplitude 158
(Mmax%) . To understand the change of PSFR, Axis Ratio, Mmax%, and the Sum (local intensity), it is 159
necessary to understand the natural structure of the tendon. Tendons are viscoelastic in nature due to 160
the composite elements (elastin/collagen and the proteoglycan water matrix). This viscoelastic 161
characteristic results in creep whereby elongation increases with a fixed load application, and stress 162
relaxation whereby the stress is reduced with a fixed elongation (Clatworthy et al., 1999; Ker et al., 163
2000). If the elongation is determined during application of force it can be seen to be a curvilinear 164
relationship. Here larger elongation is seen initially, probably due to the uncrimping of the collagen 165
fibrils in the direction of the applied stress and the beginning of increased lateral packing of the fibrils 166
(Diamant et al., 1972;Kirkendall and Garrett, 1997;Misof et al., 1997). After this initial elongation there 167
appears a quite linear portion, reflective of the stretching and further alignment of the collagen helices 168
and sliding of the tropocollagen molecules (Folkhard et al., 1987). These alterations in the tendon 169
structure during loading can explain an increase in the Peak Spatial Frequency Radius which is expected 170
as the collagen fibres straighten and move slightly closer together. This same process is responsible for 171
the increase in the Axis Ratio, but here it is predominantly influenced by the fibre straightening. 172
The increase in the sum measure may be reflective of alterations in the water content of the tendon. It 173
is well known that an inflamed tendon or muscle will have higher water content and will show up darker 174
on a B-Mode ultrasound scan. This is because water will decrease the scatterer density. Thus during 175
loading it may be that water or fluid is displaced temporarily through the intracellular spaces out of the 176
tendon (Hannafin and Arnoczky, 1994;Lanir et al., 1988), along with increased density/alignment of the 177
10
be stated that the likelihood of the suggested exchange of fluid between the interstitial spaces is 179
currently unknown during short term contractions such as here and is in need of further investigation. 180
181
In addition to the loaded tendon possibly increasing the overall density of the scatterers and hence the 182
observed increased brightness, the brighter speckle pattern is proposed based on the understanding of 183
its statistics. Initially, in a relaxed state the tendon extracellular matrix (ECM) is bundled with random 184
orientations, upon elongation the random kinks in the ECM become smoother and their scattering will 185
be coherent with the nearby ECM scattering. The probability density function for the speckle pattern of 186
the tendon, which is already a Rician distribution, becomes a stronger Rician distribution moving further 187
away from the standard Rayleigh distribution which defines the speckle pattern of unstructured tissue. 188
This explanation for the increase in speckle pattern brightness agrees with the explanation showing an 189
increase of the Peak Spatial Frequency and the Axis Ratio. 190
191
Tendons that are routinely 'loaded' become stiffer and show intrinsic modifications indicative of the 192
strengthening of the tendon as it adapts to the loads experienced (Wiesinger et al., 2015). Previous 193
work has indicated these increases in stiffness with exercise (Onambélé et al., 2008;Burgess et al., 2009). 194
In contrast, unloading can be seen to result in decrease in the tendon mechanical properties (de Boer et 195
al., 2007). Recently it has been shown that the tendon mechanical properties are related to the spectral 196
frequencies in the ultrasound image of degenerative tendons (Kulig et al., 2016). Here it was stated that 197
the peak spatial frequency radius showed a good relationship with the determined stiffness of the 198
Achilles tendon (r = 0.74). This relationship was not seen in healthy tendons however. It was not clear 199
from the study if the spatial parameters were determined with the tendon at rest or during loading. This 200
may be of importance as healthy tendon may not react the same to loading as degenerative tendon and 201
11
have been gained into the differences. Indeed here we show in healthy tendons using the same 203
approach, qualitative changes when going from unloaded to loaded as identified by the spectral 204
parameters. This approach could yield interesting information regarding the tendon adaptability to both 205
acute and chronic loading protocols. The ability to monitor tendon in this way may enable an index of 206
healthy tendon to be established, which may be able to detect when a tendon is beginning to maladapt. 207
Whilst we acknowledge that more work needs to be done to further validate this method i.e. 208
repeatability of measures and examination of the sensitivity under a variety of conditions to determine 209
its viability and limitations. 210
The potential information from this technique would allow changes to the training programme to be 211
made for instance in the case of an athlete. Where rehabilitation was being carried out it may give 212
valuable insight into the significance or effectiveness of the rehabilitation programme enabling 213
optimisation of the rehabilitation on an individual level. 214
215 216
Acknowledgements: No sources of funding are associated with this work. To the authors knowledge
217
there are no conflicts of interest. 218
12
References
223
Bashford, G.R., Tomsen, N., Arya, S., Burnfield, J.M., Kulig, K., 2008. Tendinopathy discrimination by use 224
of spatial frequency parameters in ultrasound b-mode images. IEEE Trans. Med. Imaging 27, 608– 225
615. doi:10.1109/TMI.2007.912389 226
Bohm, S., Mersmann, F., Tettke, M., Kraft, M., Arampatzis, A., 2014. Human Achilles tendon plasticity in 227
response to cyclic strain: effect of rate and duration. J. Exp. Biol. 217, 4010–7. 228
doi:10.1242/jeb.112268 229
Burgess, K.E., Graham-Smith, P., Pearson, S.J., 2009. Effect of acute tensile loading on gender-specific 230
tendon structural and mechanical properties. J. Orthop. Res. 27, 510–6. doi:10.1002/jor.20768 231
Clatworthy, M.G., Annear, P., Bulow, J.U., Bartlett, R.J., 1999. Tunnel widening in anterior cruciate 232
ligament reconstruction: a prospective evaluation of hamstring and patella tendon grafts. Knee 233
Surg. Sports Traumatol. Arthrosc. 7, 138–45. doi:10.1007/s001670050138 234
de Boer, M.D., Maganaris, C.N., Seynnes, O.R., Rennie, M.J., Narici, M. V, 2007. Time course of muscular, 235
neural and tendinous adaptations to 23 day unilateral lower-limb suspension in young men. J. 236
Physiol. 583, 1079–91. doi:10.1113/jphysiol.2007.135392 237
Diamant, J., Keller, A., Baer, E., Litt, M., Arridge, R.G., 1972. Collagen; ultrastructure and its relation to 238
mechanical properties as a function of ageing. Proc. R. Soc. London. Ser. B, Biol. Sci. 180, 293–315. 239
Folkhard, W., Christmann, D., Geercken, W., Knörzer, E., Koch, M.H., Mosler, E., Nemetschek-Gansler, H., 240
Nemetschek, T., 1987. Twisted fibrils are a structural principle in the assembly of interstitial 241
collagens, chordae tendineae included. Zeitschrift für Naturforschung. C, J. Biosci. 42, 1303–6. 242
Hannafin, J.A., Arnoczky, S.P., 1994. Effect of cyclic and static tensile loading on water content and 243
13
doi:10.1002/jor.1100120307 245
Józsa, L., Lehto, M., Kvist, M., Bálint, J.B., Reffy, A., 1989. Alterations in dry mass content of collagen 246
fibers in degenerative tendinopathy and tendon-rupture. Matrix 9, 140–6. 247
Kannus, P., 2000. Structure of the tendon connective tissue. Scand. J. Med. Sci. Sports 10, 312–20. 248
Ker, R.F., Wang, X.T., Pike, A. V, 2000. Fatigue quality of mammalian tendons. J. Exp. Biol. 203, 1317–27. 249
Kirkendall, D.T., Garrett, W.E., 1997. Function and biomechanics of tendons. Scand. J. Med. Sci. Sports 7, 250
62–6. 251
Kongsgaard, M., Reitelseder, S., Pedersen, T.G., Holm, L., Aagaard, P., Kjaer, M., Magnusson, S.P., 2007. 252
Region specific patellar tendon hypertrophy in humans following resistance training. Acta Physiol. 253
(Oxf). 191, 111–21. doi:10.1111/j.1748-1716.2007.01714.x 254
Kostyuk, O., Birch, H.L., Mudera, V., Brown, R.A., 2004. Structural changes in loaded equine tendons can 255
be monitored by a novel spectroscopic technique. J. Physiol. 554, 791–801. 256
doi:10.1113/jphysiol.2003.054809 257
Kulig, K., Chang, Y.-J., Winiarski, S., Bashford, G.R., 2016. ULTRASOUND-BASED TENDON 258
MICROMORPHOLOGY PREDICTS MECHANICAL CHARACTERISTICS OF DEGENERATED TENDONS. 259
Ultrasound Med. Biol. 42, 664–673. doi:10.1016/j.ultrasmedbio.2015.11.013 260
Lanir, Y., Salant, E.L., Foux, A., 1988. Physico-chemical and microstructural changes in collagen fiber 261
bundles following stretch in-vitro. Biorheology 25, 591–603. 262
Misof, k, Rapp, G., Fratzl, P., 1997. A new molecular model for collagen elasticity based on synchrotron 263
14
Onambélé, G., Maganaris, C., Mian, O., Tam, E., Rejc, E., McEwan, I., Narici, M., 2008. Neuromuscular 265
and balance responses to flywheel inertial versus weight training in older persons. - PubMed - 266
NCBI. J Biomech 41, 3133–8. 267
Reeves, N.D., Maganaris, C.N., Narici, M. V, 2003. Effect of strength training on human patella tendon 268
mechanical properties of older individuals. J. Physiol. 548, 971–81. 269
doi:10.1113/jphysiol.2002.035576 270
Rigby, B.J., Hirai, N., Spikes, J.D., Eyring, H., 1959. The Mechanical Properties of Rat Tail Tendon. J. Gen. 271
Physiol. 43, 265–83. doi:10.1016/j.jsb.2011.07.013 272
Seynnes, O.R., Erskine, R.M., Maganaris, C.N., Longo, S., Simoneau, E.M., Grosset, J.F., Narici, M. V, 2009. 273
Training-induced changes in structural and mechanical properties of the patellar tendon are 274
related to muscle hypertrophy but not to strength gains. J. Appl. Physiol. 107, 523–30. 275
doi:10.1152/japplphysiol.00213.2009 276
Tuthill, T., Rubin, J., Fowlkes, J., Jamadar, D., Bude, R., 1999. Frequency analysis of echo texture in 277
tendon. - PubMed - NCBI. Ultrasound Med Biol 25, 959–68. 278
Wearing, S.C., Hooper, S.L., Purdam, C., Cook, J., Grigg, N., Locke, S., Smeathers, J.E., 2013. The acute 279
transverse strain response of the patellar tendon to quadriceps exercise. Med. Sci. Sports Exerc. 280
45, 772–777. doi:10.1249/MSS.0b013e318279a81a 281
Wiesinger, H.-P., Kösters, A., Müller, E., Seynnes, O.R., 2015. Effects of Increased Loading on In Vivo 282
Tendon Properties: A Systematic Review. Med. Sci. Sports Exerc. 47, 1885–95. 283
doi:10.1249/MSS.0000000000000603 284
York, T., Kahan, L., Lake, S.P., Gruev, V., 2014. Real-time high-resolution measurement of collagen 285
15
doi:10.1117/1.JBO.19.6.066011 287
288
16
Figure caption
290 291
Figure 1. Typical saggital plane ultrasound image of the patellar tendon showing the enclosed ROI 292
rectangle box in green overlaying the patellar tendon. 293
17
Figures
296 297
18 Tables
304
305
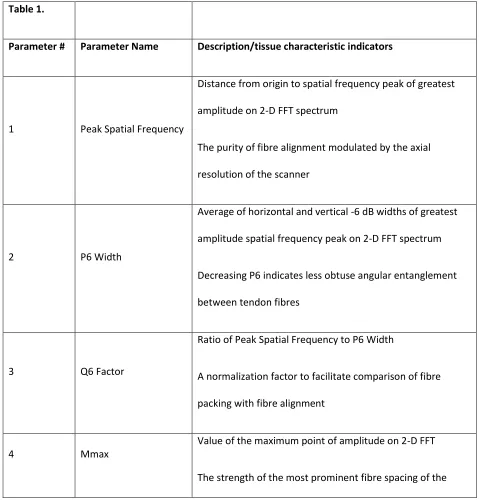
Table 1. Spatial frequency parameters analysed for the tendon images and descriptions 306
[image:19.612.69.548.218.718.2]307
Table 1.
Parameter # Parameter Name Description/tissue characteristic indicators
1 Peak Spatial Frequency
Distance from origin to spatial frequency peak of greatest amplitude on 2-D FFT spectrum
The purity of fibre alignment modulated by the axial resolution of the scanner
2 P6 Width
Average of horizontal and vertical -6 dB widths of greatest amplitude spatial frequency peak on 2-D FFT spectrum
Decreasing P6 indicates less obtuse angular entanglement between tendon fibres
3 Q6 Factor
Ratio of Peak Spatial Frequency to P6 Width
A normalization factor to facilitate comparison of fibre packing with fibre alignment
4 Mmax
Value of the maximum point of amplitude on 2-D FFT
19 tendon
5 Mmax Percent
Ratio of Mmax to the total intensity of pixels in the 2-D FFT
A comparison of fibres that are highly aligned with those aligned randomly
6 Sum
Sum of intensities of original image kernel pixels
Overall brightness of the image
7 Axis Ratio*
Major-to-minor axis ratio of ellipsoidal fit 16 X 16 center pixel region of 2-D FFT
Comparing the elongation of spatial frequencies in orthogonal directions – the higher this number, the more anisotropic the elongation is, indicating uniform alignment across the ROI
8 Ellipse Rotation*
Rotation from vertical axis of ellipsoid fit to 2-D FFT
The angle between the transducer axis and the most prominent alignment of tendon fibres
* indicates parameter used by Tuthill ((Tuthill et al., 1999))
308
309
20
Table 2. The paired statistics for unloaded to loaded tendons. Unloaded and Loaded data are mean 311
values. Parameters for which a significant change were observed are the Peak Spatial Frequency 312
Radius, Axis Ratio, Mmax%, and the Sum (shown in bold). 313
314
Whole Tendon (Paired Stats)
unloaded to loaded Unloaded Loaded Cohen’s d p-value Peak Spatial
Frequency Radius
2.195 2.282 0.51 0.03
P6 0.640 0.639 -0.04 0.43 Q6 28.05 29.26 0.50 0.04 MMax 1458 1455 -0.08 0.38 M-Max_% 2.456 2.153 -1.04 0.0006
Axis Ratio 4.269 4.494 0.67 0.01
Ellipse Rotation 89.81 89.85 0.26 0.17 Sum 60425 67841 1.21 0.0002