DATA ACQUISITION AND DISCRETIZATION FOR FLOOD
CORRELATION MODEL
1
NOR IDAYU AHMAD AZAMI, 2NOORAINI YUSOFF, 3KU RUHANA KU-MAHAMUD
1,2,3
School of Computing, UUM College of Arts and Sciences, Universiti Utara Malaysia, 06010 UUM Sintok, Kedah, Malaysia.
E-mail: [email protected], [email protected], [email protected]
ABSTRACT
Flood is among the natural disasters caused by complex factors such as natural, breeding, and environmental. Moreover, the variability of such factors on multiple heterogeneous spatial scales may cause difficulties in finding correlation or association between regions under study. The interaction between these factors may result in the provision of either diverse or repeated information, which can be detrimental to prediction accuracy. Therefore, in this study, a model has been developed to find the association between the factors that cause flood. In particular, a Bayesian Network-based method is proposed to quantify the dependency patterns in spatial data. It has been shown that although many factors may be important with respect to the flood for a particular region, the same factors may not be important for other regions. The probabilistic model has been successfully used in problems in which the dependency between the factors is of interest. Furthermore, the effect of the proposed fuzzy discretization on the association performance has also been investigated. The comparison between different data discretization techniques proved that the proposed method gives a better result with the precision of 0.992, F-measure of 0.980, and receiver operating characteristic of 0.984 for three correlation models, respectively.
Keywords: Natural Disaster, Bayesian Network, Spatial Data Mining, Fuzzy Discretization
1. INTRODUCTION
Natural disasters are events whereby the variability of natural factors exceeds the bear or adaptability of human society, thus affecting human life, property, and life security [1]-[6]. For example, exacerbated by evidence derived from other researchers, climate change such as rainfall patterns could increase the frequency of the occurrence of major storms and floods [7]-[10]. It motivates researchers from multiple disciplines of research including business, health sciences, environmental sciences, and computer science to study in the area of flood disaster management.
Floods are one of the natural hazards that commonly occur in many areas around the world
including Malaysia. Although Malaysia is
geographically located outside the “Pacific Rim of Fire”, Malaysia is nonetheless not spared from the flood hazard. Malaysia has experienced various extreme weather and climate events that can cause flood. Every year, the government allocates a large amount of expenses to manage flood events. In Malaysia, the flood occurrence in Kedah in 2010 have been among the most terrible flood events ever happened, which vary significantly depending to
place, severity, size, and area of extent [11] and [12]. The flood saw around 50,000 people evacuated and left at least four people dead, while shutting down major transport routes into the state. The number of flood victims evacuated were 29, 963 people from Kedah [13]. [14] reported that almost all types of transportation in and around the Kedah and Perlis states were shut down including the North-South Expressway.
The effects of each factor in various areas are significantly different. One of these challenges is to find the correlation of spatial data in multiple heterogeneous databases. As referred to [15], correlations are used to represent a relationship between two or more variables. In particular, this requires extracting patterns using the spatial association rule that is an offshoot from spatial data mining.
not only from the variability on spatial data, but also from the high number of variables involved.
In recent achievements, the use of Bayesian Network methods in the domain of disaster management has proven its efficiency in developing susceptibility models and risk models. Several studies can be seen, including works by various researchers [18]-[23] that present studies to develop flood models using Bayesian Network. Although Bayesian Network has to be highlighted as a powerful method to find dependencies, the challenge begins when dealing with the continuous variables [24]-[26]. Therefore, this study proposed the data discretization method in order to overcome this problem.
Data discretization is a process of converting continuous variables into intervals with selected cut points. The advantage of discretization on continuous data can lead to data reduction and the simplification of data. Subsequently, this process will make the learning faster and produce shorter and compact results. In spatial data mining, discretization has become one of the preprocessing techniques that is used to transform a continuous variable into a discrete one [27]. As presented by [27], the authors claimed that discretization has improved the performance of the data mining.
Several reviews of the discretization technique can be found in the literature [28]-[31]. The authors discussed an exhaustive survey on discretization methods from the most representative and newest discretizers in terms of the number of intervals obtained and inconsistency level of the data. The authors also suggest for a researcher or practitioner who decide to apply the discretization methods to know the main advantages of each discretizer depending upon the problem to be tackled and the data mining method to be used.
In this study, the discretization will be discussed as a preliminary condition for data preprocessing before feeding the data into Bayesian Network model. The presentations are focused to the supervised discretization methods. Supervised discretization methods relate class information to the selection of cut points, whereas unsupervised discretization methods do not consider class information. These methods have been presented widely for the discretization of spatial data. For instance, unsupervised methods such as equal interval (EI), natural breaks (NB), quantile (QU), and standard deviation (SD) are common in spatial data mapping and geovisualization [32] and [33].
Supervised methods are common in the research fields of classification, prediction, and data mining. For example, [34] used a supervised method called the Minimum Description Length
Principle (MDLP) to discretize continuous
environmental attributes and assess crop suitability for agricultural soils with rough set rule induction. [35] also used MDLP to discretize continuous risk factors of neural tube defects (NTD), and mined underlying rules between NTD and its risk factors.
[36] proposed an efficient supervised Bayesian discretization method to give better classification results from a high-dimensional biomedical dataset. [37] compared the impacts of three supervised
discretization methods on remote sensing
classification. Those works directly used supervised methods for spatial data discretization.
The natural breaks method that find values of class break has been introduced in [38]. The author presented the choropleth map classes using unsupervised method that improved inputs of choropleth map information system. [39] also used natural breaks method to identify the break points of total flood volume values. Although the method can be executed easily even from large volumes of spatial data, this method required predefined numbers of intervals before the discretization process. As explained by [40], the maximum number of intervals or the discretization should be limited in five states to improve the precision and the network structure.
In this paper, the location or area of interest is highlighted in the second section, followed by the data description of flood influenced factors. Next, the framework for spatial generic modelling using Bayesian Network is described. Subsequently, the proposed data discretization is illustrated and the performances of the correlation models are compared with other data discretization methods. Concluding remarks are provided in the last section.
2. STUDYAREA
The Kedah state is located in the northwest of Peninsular Malaysia between longitude 99° 40’ to 101° 8’ East and latitude 5° 5’ to 6° 35’ North. The study is carried out in the district of Padang Terap that is claimed to be the area most affected during the single flood event in 2010 [41]. These areas are identified as flood prone areas according to a report derived from the Department of Irrigation and Drainage (DID).
Therefore, the correlation obtained is more reliable and consistent. Thus, there was no question affecting the correlation due to the different river flows. The collection of the single historical flooded event that took place on 30th October 2010 at Kedah is obtained from DID. Figure 1 shows the historical flooded location.
Figure 1: Location Of Study Area With The Distribution Of Flood Events
3. DATADESCRIPTION
Various thematic data layers, namely rainfall, land use types, soil types, Digital Elevation Model (DEM), slope, Topographic Wetness Index (TWI), Stream Power Index (SPI), and river were prepared. These factors fall into a category of flood inducing factors, which are considered responsible for the occurrence of flood events in that particular area. With the variability of these factors, there is a need to investigate the correlations that could benefit and improve information. Thus, this study will provide a model that is able to extract the major impact factors of spatial data from many complex variables and determine the most significant flood inducing factors. In order to develop the correlation model, it is necessary to determine the distribution of flood events and factors that influence flood.
As deduced from the previous researches [42]-[47], nine factors that influence flood events are used as the input variables for the model development. Different thematic layers will carry out different spatial analyses. This is due to the different data format, projection, and resolution obtained from data acquisition.
3.1 Flood Data
An accurate detection of flood locations is extremely important for probabilistic analysis. It is essential for describing the relationship between the flood distribution and the inducing factors. The selection of the research area is based on a number of factors: the severity of flood events, no implementation of a flood mitigation system in the study area to ensure that the study area is only affected by natural factors, accessibility of data, and cost of procuring the actual required satellite image. For this study, 3 mukims, which are Padang Temak, Belimbing Kanan, and Belimbing Kiri, are considered.
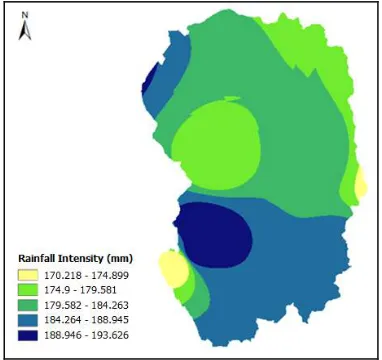
3.2 Rainfall Data
The historical data that includes 20 rainfall stations are obtained. However, the number of rainfall stations that are still operating is only 19 stations. One station has to be eliminated because there are too many missing values. In producing the mean annual rainfall intensity, this study relied heavily on the historical data as the primary source of information. There are 18 rainfall stations with mean annual rainfall for each station. The spatial distribution of rainfall data is illustrated in Figure 2.
Figure 2: Rainfall
3.3 Land Used Types
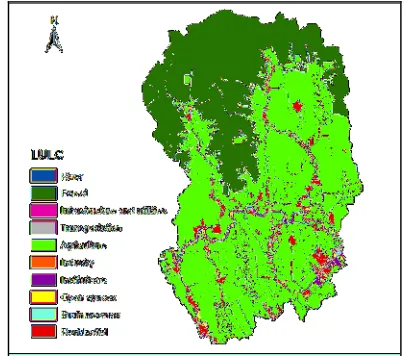
The changes of land use give effect on the rainfall runoff process. Therefore, land use type is considered as one of the factors that are responsible for flood events. The presence of the different surface of land use areas, for instance, the urban land use or vegetation areas, yields different impacts of flooding events in that area. To define
[image:3.612.322.513.421.601.2]this factor, the land use layer consists of river, institutions, residential, transportation, business areas, agriculture, and open spaces will be considered. Figure 3 shows the land use types for the study area.
Figure 3: Land Use
3.4 Soil Types
[image:4.612.324.511.306.487.2]Soil types are the factor that is significant for breeding disasters. The variability of soil types in the flood affected areas gives an impact of the spread of flood events. This is due to the absorption of water in particular areas depending on the soil type’s conditions. The study area is characterized by three different classes of soil series: (1) Durian-Malacca-Tavy; (2) Steepland; and (3) Telemong-Akob-Local Alluvium. Figure 4 shows the spatial distribution of major soil series.
Figure 4: Soil Types
Interferometric Synthetic Aperture Radar (IfSAR) is an active remote sensing technology that is able to rapidly collect data from huge areas. The resulted dataset is the base of digital surface and elevation models. Since the surface conditions are the leading factors that determine the formation of flood events, therefore, the use of high-resolution synthetic data is the perfect source to derive topographic factors of elevation, which is DEM, slope, curvature, SPI, TWI, and distance from river.
3.5 Digital Elevation Model
A Digital Elevation Model (DEM) was created first using the IfSAR data with a resolution of 10m x 10m. Using this DEM, the slope angle, curvature, SPI, TWI, and distance from river were calculated. Figure 5 shows the DEM data.
Figure 5: DEM
3.6 Slope
[image:4.612.101.289.519.701.2]Figure 6: Slope
3.7 Curvature
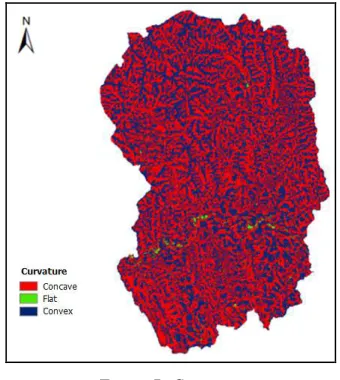
[image:5.612.320.512.119.310.2]In the case of the curvature, negative curvatures represent concave, zero curvature represents flat, and positive curvatures represent convex, respectively. The curvature map was produced using the DEM data. The curvature for the study is illustrated as shown in Figure 7.
Figure 7: Curvature
3.8 Stream Power Index
Stream Power Index (SPI) is the rate that the energy of flowing water is expended on the bed and banks of a channel. High stream power values generally correspond with steep, straight, scoured reaches, and bedrock gorges. Low stream power values occur in broad alluvial flats, floodplains, and slowly subsiding areas, where the valley fill is usually intact and deepening. The given equations
have calculated and generated SPIs as shown in Figure 8.
Figure 8: Stream Power Index
3.9 Topographic Wetness Index
[image:5.612.109.279.403.593.2]Topographic Wetness Index (TWI) is a steady-state wetness index. The value for each cell in the output raster (the TWI raster) is the value in a flow accumulation raster for the corresponding DEM. Higher TWI values represent drainage depressions; lower values represent crests and ridges. In creating the TWI, the following equation is calculated to produce the TWI. Figure 9 shows the TWI.
Figure 9: Topographic Wetness Index
3.10 River
[image:5.612.322.511.463.641.2]river in the study area was extracted using the IfSAR data. Next, the Euclidean Distance tool is used to create a raster of the distance from river. Figure 10 shows the distance from river.
Figure 10: River
[image:6.612.314.531.202.415.2]The individual factor maps have been combined into single datasets representing variables for a given flood condition as shown in Table 1.
Table 1: Various Data Available For Correlation Model Development
4. METHODOLOGY
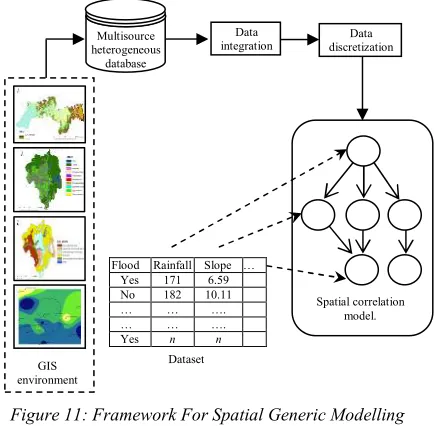
The framework for the correlation model development that consists of several phases is illustrated in Figure 11. This framework presents the procedure for the probability analysis in order to find the correlation between the influencing factors for flood events.
Figure 11: Framework For Spatial Generic Modelling Using Bayesian Network
The framework of spatial generic modelling is described by the following steps:
1) Analysis of data in the GIS environment using
different spatial analysis techniques for each
flood factor from the multisource
heterogeneous database.
2) Preprocessing the data into single datasets
representing variables according to the area of interest.
3) Discretizing the continuous variables of flood
inducing factors.
4) Building the Bayesian Network with discretize
variables obtained from the proposed fuzzy discretization method.
To construct a Bayesian Network method, the initial steps involved are identifying and defining the problem that lead to flood events, followed by the identification of the relevant variables constituting the problem being modelled. In total, there are two factors involved for this study. The first factors are related to exposure, which are directly related to the occurrence of natural disasters. For instance, heavy rainfall can cause flood. Most exposure related factors are natural and some are artificial or related with artificial activities.
Flood Rainfall Slope … Yes 171 6.59 No 182 10.11
… … ….
… … ….
Yes n n
Classification GIS data type
Data Factor Spatial database
Flood map Flooding area ARC/INFO
Grid
Rainfall records Rainfall data ARC/INFO Grid
Topographic map Land use types ARC/INFO Grid
Soil map Soil types ARC/INFO
Grid
IfSAR data
DEM ARC/INFO
Grid
Slope ARC/INFO
Grid
Curvature ARC/INFO
Grid
SPI ARC/INFO
Grid
TWI ARC/INFO
Grid
River ARC/INFO
Grid
GIS environment
Multisource heterogeneous
database
Data discretization Data
integration
2 3
1
Spatial correlation model.
[image:6.612.90.300.432.666.2]The other factors that are related to the influence of flood events refer to environmental factors. These factors are relevant to the environment that breeds the disasters. Most of these factors are physical or artificial and are able to mitigate the flood event.
The tree-augmented naive Bayes (TAN) BN structure was chosen as the searching strategy to construct the correlation model. According to [48], TAN provided a better representation of the correlation among the variables than other classic models such as the naive Bayes model.
5. DISCRETIZING THE CONTINUOUS FLOOD INDUCING FACTORS
[image:7.612.325.510.334.547.2]The main goal of discretization is to transform a set of continuous attributes into discrete ones. Among the nine selected flood inducing factors, the attribute values of rainfall, DEM, slope, SPI, TWI, and river need to be discretized and consequently fed into the BN model.
Figure 12 shows the flowchart for the proposed data discretization technique based on Fuzzy Logic.
Figure 12: Flowchart For Proposed Data Discretization Technique
The proposed data discretization technique consists of two activities, which are the conversion of the actual data to Min-Max normalization, and the development of membership function to obtain fuzzy discretization. For the development of membership function graph, the entropy method is used to find the threshold value in order to develop the graph.
In this study, the membership function graph in fuzzy logic has been used to discretize the continuous variables. The fuzzy set intervals for each flood factor are represented as linguistic variables to a maximum of five intervals, which are very low, low, moderate, high, and very high. Fuzzy logic is based on the theory of fuzzy sets that measure the ambiguity and believe all things admit of degrees [49]-[51] claimed that fuzzy logic presents the easier technique to clearly define the conclusion when it comes upon imprecise vague, ambiguous, noisy or missing input information.
6. EXPERIMENTALRESULT
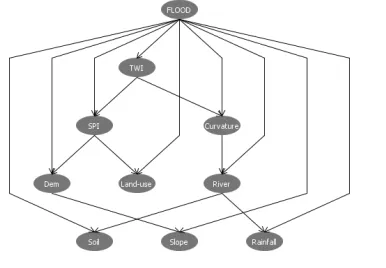
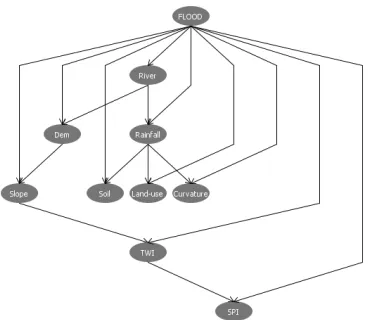
[image:7.612.150.247.396.576.2]The structure of the Bayesian Network correlation model for Padang Temak mukim, Belimbing Kanan mukim, and Belimbing Kiri mukim are displayed in Figures 13, 14, and 15, respectively.
Figure 13: Structure Of Bayesian Network Correlation Model For Padang Temak mukim
Yes
No Continuous
variable?
Min-max normalization
Development of MF graph
[image:7.612.326.519.605.739.2]Figure 14: Structure Of Bayesian Network Correlation Model For Belimbing Kanan mukim
Figure 15: Structure Of Bayesian Network Correlation Model For Belimbing Kiri Mukim
This structure presents the complexity of the relationship between the occurrences of flood events that link with the flood inducing factors. The flood is the root node of the BN structure, and each flood inducing factor is directly linked to it. In this study, five data discretization techniques for modelling the Bayesian Network have been compared, namely Fuzzy Discretization, Equal Width, Natural Breaks, Quantile, and Geometrical Interval.
In order to evaluate the performance, the precision scalar measurement is obtained through the Bayesian Network model using the comparison of the proposed fuzzy discretization technique with other data discretization techniques. Precision measures the proportion of true positives among the variables with the target classes, namely the absence or presence of flood occurrences. The precision obtained from the BN model is presented in a range of 0 to 1. A high precision with the value close to 1 reflects a good BN model.
[image:8.612.100.286.136.296.2]Besides precision, the performance of the correlation model is also evaluated using ROC. The ROC area is the area between the horizontal axis and the ROC curve, and it is a comprehensive scalar value representing the model’s expected performance. The ROC area is between 0.5 and 1, where a value close to 0.5 is less precise, while a value close to 1 is more precise. A larger ROC area indicates better prediction performance. The results are summarized in Table 2. The performance of the models is based on precision, F-measure, and receiver operating characteristic (ROC).
Table 2: Comparison Of Average Performance Assessment Of BN Models
Technique Precision F-Measure ROC Class
Fuzzy Discretization
0.992 0.875
0.980 0.917
0.984 0.984
YES
NO Equal Width 0.820
0.812
0.680 0.579
0.805 0.805
YES
NO Natural Breaks 0.831
0.531
0.669 0.578
0.803 0.803
YES NO
Quantile 0.839
0.529
0.661 0.578
0.813 0.813
YES NO Geometrical
Interval
0.819 0.535
0.682 0.578
0.814 0.814
YES
NO
Based from the experiments, it was found that the proposed fuzzy discretization method shows
better performance. The results from the
[image:8.612.314.522.396.532.2]performance metrics have shown that this method performed well as compared to other discretization methods. Subsequently, Figure 16 and Figure 17 illustrate the comparison graph of the average performance assessment of the Bayesian Network models for the presence and absence of flood, respectively.
[image:8.612.314.523.571.706.2]Figure 16: Comparison Graph Of Average Performance Assessment Of BN Model For The Presence Of Flood
7. CONCLUSION
The explosive growth of methods for data acquisition for the natural hazard analysis has resulted in the large spatial database collection. It became an urgent need to identify spatial patterns and spatial objects. For this reason, understanding these complex data and processes in order to provide the appropriate data input for analysis is crucial. Therefore, the Bayesian-based spatial correlation model for flood events is proposed. The Bayesian Network has been widely used to
represent the logical relationships between
variables.
However, many of the flood factors consist of continuous variables that introduce challenges for the data mining task. Hence, the proposed data discretization method contributes in the process to re-encode the continuous variables into discrete variables. Nevertheless, if too many intervals are unsuited to the learning process, this will lead to a loss of information; and if there are too few intervals, this can lead to the risk of losing some interesting information. In brief, incorporating the proposed fuzzy discretization with the Bayesian Network model for flood events provides better results.
Apart from using min-max normalization to transform the actual data, other techniques can also be used for data transformation such as z-score normalization and normalization by decimal scaling. Furthermore, geology map is not considered in this study as one of the flood factors that might contribute as the significant factors to identify flood events. Therefore, the combination of this data with other flood factors for future studies needs to be considered.
ACKNOWLEDGEMENTS
The authors wish to thank the Ministry of Higher Education Malaysia for funding this study under the Long Term Research Grant Scheme (LRGS/b-u/2012/UUM/ Teknologi Komunikasi dan Informasi).
REFRENCES:
[1] P. Luo, B. He, K. Takara, Y.E. Xiong, D. Nover, W. Duan, and K. Fukushi, “Historical assessment of Chinese and Japanese flood management policies and implications for
managing future floods”, Environmental
Science & Policy, 48, 2015, pp. 265–277.
[2] S.H.M. Fakhruddin, A. Kawasaki, and M.S. Babel, “Community responses to flood early warning system: Case study in Kaijuri Union, Bangladesh”, International Journal of Disaster Risk Reduction, 14, 2015, pp. 323–331.
[3] C.R. Valêncio, F.T. Ichiba, G.P. Daniel, R.C.G. da Souza, L.A. Neves, and A.C. Colombini, “Spatial data mining to support environmental management and decision making – A case study in Brazil”, Computer Technology and Application 5, No. 1, 2014.
[4] J. Shen, T.Z. Zeng, T. Li, and H. Zhao, “Research on emergency warning system for
natural disasters based on multi-sensor
information fusion”, In International Asia Conference on Industrial Engineering and
Management Innovation (IEMI2012)
Proceedings, Springer Berlin Heidelberg, 2013, pp. 1735–1741
[5] N.M. Dang, M.S. Babel, and H.T. Luong, “Evaluation of food risk parameters in the day river flood diversion area, Red River delta, Vietnam”, Natural Hazards 56, No. 1, 2011, pp. 169–194.
[6] C.V. Westen, “Remote sensing for natural disaster management”, International Archives of Photogrammetry and Remote Sensing, Vol. XXXIII, Part B7, 2000, pp. 1609–1617. [7] K. Arnbjerg-Nielsen, P. Willems, J. Olsson, S.
Beecham, A. Pathirana, I.B. Gregersen, , … and V.T.V. Nguyen, “Impacts of climate change on rainfall extremes and urban drainage systems: a review”, Water Science and Technology : A Journal of the International Association on Water Pollution Research 68, No. 1, 2013, pp. 16–28.
[8] K. Smith, “Environmental hazards: Assessing risk and reducing disaster”, New York, Routledge, 6th Ed., 2013.
[9] M. Morita, “Comparative evaluation of the main factors that contribute to flood risk in urban drainage areas”, NOVATECH 2013.
[10] P. Willems and M. Vrac, “Statistical
precipitation downscaling for small-scale
hydrological impact investigations of climate change”, Journal of Hydrology 402, No. 3, 2011, pp. 193–205.
[12] N.W. Chan, “Impacts of disasters and disaster risk management in Malaysia: The case of floods”, In Resilience and Recovery in Asian Disasters, Springer Japan, 2015, pp. 239–265. [13] Utusan Malaysia, “Banjir di Kedah makin,
Perlis tambah baik”, Retrieved from
http://www.utusan.com.my/utusan/info.asp?y=2 010&dt=1105&pub=Utusan_Malaysia&sec=M uka_Hadapan&pg=mh_04.htm, 2010.
[14] The Star, “Floods still bad in Alor Setar”,
Retrieved from
http://www.thestar.com.my/story/?file=/2010/11 /7/nation/7380295&sec=, 2012.
[15] S.L. Peerbolte and M.L. Collins, “Disaster management and the critical thinking skills of local emergency managers: correlations with
age, gender, education, and years in
occupation”, Disasters 37, No. 1, 2013, pp. 48– 60.
[16] G.V. Patil, M.V. Shastri, and B.K. Chaudhari,
“Spatial data mining used in marine
geographical information system”, In
International Journal of Engineering Research and Technology, ESRSA Publications, Vol. 2, No. 4, April 2013.
[17] D. Jiangyi and H. Cheng, “Discussions on the characteristics and methods of spatial data mining”, Future Computing, Communication, Control and Management, Springer Berlin Heidelberg, 2012, pp. 153–159.
[18] A. Viglione, R. Merz, J.L. Salinas, and G. Blöschl, “Flood frequency hydrology: 3. A Bayesian analysis”, Water Resources Research, 49, No. 2, 2013, pp. 675–692.
[19] K. Vogel, C. Riggelsen, F. Scherbaum, K.
Schröter, H. Kreibich, and B. Merz,
“Challenges for Bayesian network learning in a flood damage assessment application”, In 11th International Conference on Structural Safety and Reliability, June 2013, pp. 16–20.
[20] M. Peng and L.M. Zhang, “Analysis of human risks due to dam-break floods—part 1: A new model based on Bayesian networks”, Natural Hazards 64, No. 1, 2012a, pp. 903–933.
[21] M. Peng and L.M. Zhang, “Analysis of human risks due to dam break floods—part 2: Application to Tangjiashan landslide dam failure”, Natural Hazards 64, No. 2, 2012b, pp. 1899–1923.
[22] W.J. Liang, D.F. Zhuang, D. Jiang, J.J. Pan, and H.Y. Ren, “Assessment of debris flow hazards using a Bayesian Network”, Geomorphology, 171, 2012, pp. 94–100.
[23] L. Li, J. Wang, H. Leung, and C. Jiang, “Assessment of catastrophic risk using Bayesian network constructed from domain knowledge and spatial data”, Risk Analysis 30, No. 7, 2010, pp. 1157–1175.
[24] K. Zwirglmaier, P. Papakosta, and D. Straub, “Learning a Bayesian network model for predicting wildfire behavior”, Proc, ICOSSAR 2013.
[25] T.D. Nielsen and F.V. Jensen, “Bayesian networks and decision graphs”, Springer Science & Business Media, 2009.
[26] L. Uusitalo, “Advantages and challenges of Bayesian networks in environmental modeling”, Ecological modelling 203, No. 3, 2007, pp. 312–318.
[27] A.A. Bakar, Z.A. Othman, and N.L.M. Shuib,
“Building a new taxonomy for data
discretization techniques”, In 2009 2nd
Conference on Data Mining and Optimization, October 2009, pp. 132–140, IEEE.
[28] S. García, J. Luengo, and F. Herrera, Data preprocessing in data mining. New York: Springer, 2015.
[29] J. Han, J. Pei, and M. Kamber, Data mining: concepts and techniques. Elsevier, 2012.
[30] Y. Yang, G.I. Webb, and X. Wu,
“Discretization methods”, In Data Mining and Knowledge Discovery Handbook, pp. 101-116, Springer US, 2010.
[31] H. Liu, F. Hussain, C.L. Tan, and M. Dash, “Discretization: An enabling technique”, Data mining and knowledge discovery 6, No. 4, 2002, 393–423.
[32] M.M. Fischer and J. Wang, “Spatial data analysis: models, methods and techniques”, Springer Science and Business Media, 2011. [33] J. Stewart and P.J. Kennelly, “Illuminated
choropleth maps”, Annals of the Association of American Geographers 100, No. 3, 2010, 513– 534.
[34] P.A. Berger, “Rough set rule induction for
suitability assessment”, Environmental
management 34, No. 4, 2004, 546–558.
[36] J.L. Lustgarten, S. Visweswaran, V. Gopalakrishnan, and G.F. Cooper. “Application of an efficient Bayesian discretization method to biomedical data”, BMC bioinformatics 12, No. 1, 2011, 1.
[37] Y. Ge, F. Cao, and R.F. Duan, “Impact of discretization methods on the rough set-based classification of remotely sensed images”, International Journal of Digital Earth 4, No. 4, 2011, 330-346.
[38] G.F. Jenks and F.C. Caspall, “Error on choroplethic maps: definition, measurement, reduction”, Annals of the Association of American Geographers 61, No.2, 1971, 217– 244.
[39] G.M. Dawod, M.N. Mirza, and K.A. Al-Ghamdi, “GIS-based estimation of flood hazard impacts on road network in Makkah city, Saudi Arabia”, Environmental Earth Sciences 67, No. 8, 2012, 2205–2215.
[40] B.G. Marcot, J.D. Steventon, G.D. Sutherland, and R.K. McCann, “Guidelines for developing and updating Bayesian belief networks applied to ecological modeling and conservation”, Canadian Journal of Forest Research 36, No.12, 2006, 3063–3074.
[41] F.F.A. Fizri, A.A. Rahim, S. Sibly, K.C. Koshy, and N.M. Nor, “Strengthening the Capacity of Flood-Affected Rural Communities in Padang
Terap, State of Kedah, Malaysia”, In
Sustainable Living with Environmental Risks, Springer Japan, 2014, pp. 137–145.
[42] M.S. Tehrany, B. Pradhan, and M.N. Jebur, “Flood susceptibility mapping using a novel ensemble weights-of-evidence and support vector machine models in GIS”, Journal of Hydrology 512, 2014, 332–343.
[43] M.S. Tehrany, B. Pradhan, and M.N. Jebur, “Spatial prediction of flood susceptible areas using rule based decision tree (DT) and a novel ensemble bivariate and multivariate statistical models in GIS”, Journal of Hydrology 504, 2013, 69–79.
[44] D.U. Lawal, A.N. Matori, A.M. Hashim, K. Wan Yusof, and I.A. Chandio, “Natural Flood Influencing Factors: A Case Study of Perlis, Malaysia”, 2012, 1–6.
[45] S. Yahaya, N. Ahmad, and R.F. Abdalla, “Multicriteria analysis for flood vulnerable areas in Hadejia-Jama’are river basin, Nigeria”, European Journal of Scientific Research 42, No, 1, 2010, 71–83.
[46] B. Pradhan, “Flood susceptible mapping and risk area delineation using logistic regression, GIS and remote sensing”, Journal of Spatial Hydrology 9, No. 2, 2010.
[47] Y. Kwak and A. Kondoh, “A study on the extraction of multi-factor influencing floods from RS image and GIS data; a case study in
Nackdong Basin, S. Korea”, In The
International Archives Of The Photogrammetry, Remote Sensing And Spatial Information Sciences, ISPRS Congress Beijing Vol. 37, 2008, pp. 421–426.
[48] Y. Song, J. Gong, S. Gao, D. Wang, T. Cui, Y. Li, and B. Wei, “Susceptibility assessment of earthquake-induced landslides using Bayesian network: a case study in Beichuan, China”, Computers & Geosciences 42, 2012, pp. 189– 199.
[49] V. Kanagavalli and K. Raja, “A fuzzy logic based method for efficient retrieval of vague and uncertain spatial expressions in text exploiting the granulation of the spatial event queries”, In International journal of computer applications (0975-8887), national conference on future computing CoRR, 2013.
[50] M. Negnevitsky, “Artificial intelligence a guide to intelligent systems”, England: Pearson Education, 3rd Ed., 2011.