7435
STATISTICAL ANALYSIS OF IMPACT FACTORS
AFFECTING STRATEGIES OF THE VIRTUAL REALITY
SERVICE SYSTEMS AND INTERVENING EFFECTS OF
PERFORMANCE EXPECTANCY
1YOUNG-HO HWANG, 2YOO-JIN MOON
1First Author, Kunsan National University, South Korea
2Corresponding Author, Hankuk University of Foreign Studies, Division of Global Business and
Technology, South Korea
E-mail: 1[email protected], 2[email protected]
ABSTRACT
The purpose of this paper is to statistically analyze impact factors affecting strategies of the virtual reality systems and to address intervening effects of performance expectancy. The result demonstrates that the main predictors of intention to use virtual reality service systems, in the order of importance, are hedonic motivation, personal innovativeness, social influence and performance expectancy. All intervening effects were significant: interactions between effort expectancy and performance expectancy, between social influence and performance expectancy, between personal innovativeness and performance expectancy, and between hedonic motivation and performance expectancy. It implies that the higher the customer’s performance expectancy, the stronger the impacts of effort expectancy, social influence, personal innovativeness, and hedonic motivation on intention to use the service systems. Based on the statistical results, the paper suggests that consumers should experience the services with enjoyment and get benefits by utilizing them, and so system strategies for virtual reality services should appeal to consumers by positioning the using experience as an adventure or a way to reduce their stress and change a negative mood. Another system design strategy suggested for the virtual reality services is to be reputation-building in order to gain a favorable opinion from referents, and to target the early adopters.
Keywords: Virtual Reality Service, Performance Expectancy, Hedonic Motivation, Social Influence,
Personal Innovativeness
1. INTRODUCTION
One of the information technologies holding tremendous promises is virtual reality, which is quickly maturing into a viable medium for humans to connect cyberspace with the real world. The pace of innovation in virtual reality is definitely accelerating, while the costs of virtual reality devices are expected to drop rapidly as more consumers adopt the technology. Given this, the application of virtual reality to help companies service their customers is not as far-fetched as it may seem. In the intellectual information society areas of virtual reality and Artificial Intelligence (AI) are being magnified toward development of industry 4.0. In the past virtual reality had been
imagined and described in science fictions or films, but now is becoming a reality.
7436 inhabitation. Generally, virtual reality focuses on the head-mounted goggle, which enables the user to interact with the perception in the tridimensional situation as in the reality, and with electronic technology which makes the user experience the
electronic environment simulation through
accessories and clothes connected with networks. [2]
On the other hand, augmented reality focuses on the functions for complementing the reality people see. For example, augmented reality can set the reality added with the graphic design screen. Gradually virtual reality and augmented reality combined with software technology are being in the limelight and will demand differentiated system design strategies for the business. This research is going to call virtual
reality as representation of both the virtual reality and the augmented reality.
This research aims to statistically analyze impact factors that affect strategies of virtual reality service systems and intervening effects of the performance expectancy factor, for which it utilizes a new adapted and extended version of the UTAUT (unified theory of acceptance and use of technology). [3, 4, 5, 6, 7, 8] Through the research it could be found how consumers behave regarding use of virtual reality service systems.
This research is structured as follows. Section 2 presents research model and describes the research methods. Section 3 illustrates the hypothesis test and the statistical results. Finally, Section 4 concludes with discussion of the managerial and research implications of this study.
2. MODEL-SETTING AND METHODS
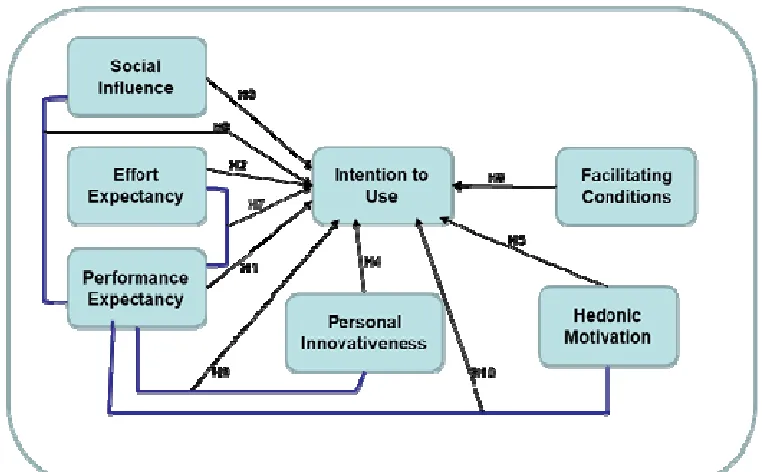
[image:2.612.123.505.382.618.2]2.1 Research Model
Figure 1: Research Model
The research model for this study is designed to investigate main factors that affect intention to use (I-U) virtual reality services. Our research model expands to adapt on Venkatesh et al.’s research [5] of user acceptance focusing on UTAUT variables and adds key dimensions to the
7437 The operationalized definition is the process of defining a fuzzy concept so as to make it
clearly distinguishable, measurable and
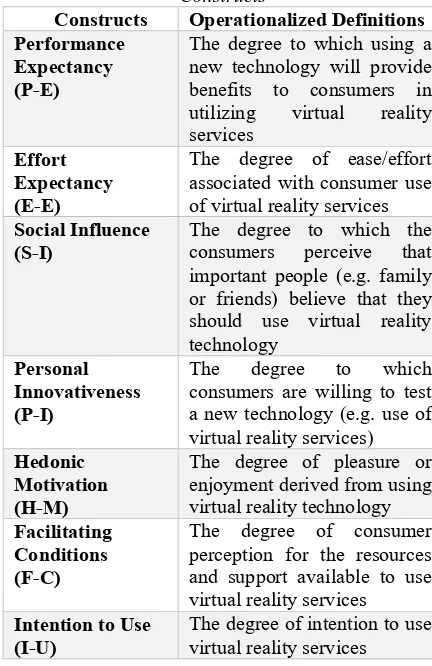
[image:3.612.83.299.171.504.2]understandable in terms of empirical observations. In this paper operationalized definitions of the main constructs are shown in Table 1.
Table 1: Operationalized Definitions of the Constructs
Constructs Operationalized Definitions
Performance Expectancy (P-E)
The degree to which using a new technology will provide benefits to consumers in
utilizing virtual reality
services
Effort Expectancy (E-E)
The degree of ease/effort associated with consumer use of virtual reality services
Social Influence
(S-I) The degree to which the consumers perceive that
important people (e.g. family or friends) believe that they should use virtual reality technology
Personal Innovativeness (P-I)
The degree to which
consumers are willing to test a new technology (e.g. use of virtual reality services)
Hedonic Motivation (H-M)
The degree of pleasure or enjoyment derived from using virtual reality technology
Facilitating Conditions (F-C)
The degree of consumer perception for the resources and support available to use virtual reality services
Intention to Use
(I-U) The degree of intention to use virtual reality services
2.2 Hypothesis Setting
Taking into account the relationships of constructs of the extended UTAUT, the research puts forward the following hypotheses in respect of virtual reality services
2.2.1 Intention to Use Virtual Reality Services (I-U)
H-1: A customer’s performance
expectancy (P-E) would have a positive impact on intention to use (I-U) virtual reality services.
H-2: A customer’s effort expectancy (E-E) would have a positive impact on intention to use (I-U) virtual reality services.
H-3: A customer’s social influence (S-I) would have a positive impact on intention to use (I-U) virtual reality services.
H-4: A customer’s personal innovativeness (P-I) would have a positive impact on intention to use (I-U) virtual reality services.
H-5: A customer’s hedonic motivation (H-M) would have a positive impact on intention to use (I-U) virtual reality services.
H-6: A customer’s facilitating conditions (F-C) would have a positive impact on intention to use (I-U) virtual reality services.
2.2.2 Intervening Effects
H-7: A customer’s effort expectancy (E-E) intervenes the relation between his/her performance expectancy (P-E) and intention to use (I-U) virtual reality services.
H-8: A customer’s social influence (S-I) intervenes the relation between his/her performance expectancy (P-E) and intention to use (I-U) virtual reality services.
H-9: A customer’s personal innovativeness (P-I) intervenes the relation between his/her performance expectancy (P-E) and intention to use (I-U) virtual reality services.
H-10: A customer’s hedonic motivation (H-M) intervenes the relation between his/her performance expectancy (P-E) and intention to use (I-U) virtual reality services.
2.3 Methods
2.3.1 Measurement
7438
2.3.2 Data Collection and Analytical Methods
To assess the research model in Figure 1, a self-administered survey approach was utilized to collect data from virtual reality service users in Seoul Metropolitan and the regional city. Participants were asked to indicate on a seven-point scale the degree to which they agreed with the statements. They were told that the survey was voluntary and their responses would be kept anonymous. To identify demographics of the respondents, a frequency analysis was performed based on a total of 217 samples. The samples chosen for this research were undergraduate students at H University in Seoul Metropolitan and at K University in Jeonbuk Province. Drennan et al. argued that university students are “representatives of a dominant cohort of online users” including virtual reality users. [9] Most of them were experienced and frequent users of the virtual reality services. This research verified reliability and validity of the model. And frequency analysis, T-test and multiple regression analysis were conducted.
3. HYPOTHESIS TEST AND STATISTICAL
ANALYSIS 3.1 Frequency Analysis
This research used purposive and non-probability sampling. Those who were questioned
completed self-reported questionnaires and
voluntarily participated in answering the
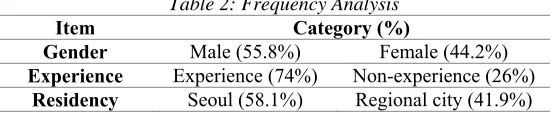
[image:4.612.164.440.388.445.2]questionnaires. A total of 240 questionnaires were distributed, of which 217 questionnaires were collected with the response rate of 90% and used in the analysis of the research. Table 2 illustrated that in the demographic distribution of the sample, 55.8% of the respondents were male, and 44.2% were female. Most of the respondents were between 20 and 30 years old and undergraduate students. In terms of experiences with virtual reality services, 74% had experience. And 58.1% of respondents lived in Seoul metropolitan area and 41.9% lived in the regional city area.
Table 2: Frequency Analysis
Item Category (%)
Gender Male (55.8%) Female (44.2%)
Experience Experience (74%) Non-experience (26%)
Residency Seoul (58.1%) Regional city (41.9%)
3.2 Validity and Reliability of the Research Model
For data analysis, Harman’s single-factor test was used to check for any common method variance because several variables were collected from the same source. [10] Common method variance means the amount of spurious covariance shared among variables because of the common method used in collecting data. Such method biases are problematic because the actual phenomenon
under investigation becomes difficult to
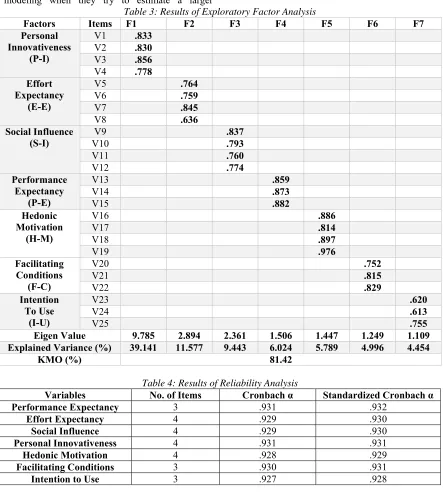
differentiate from measurement artifacts. Harman’s single-factor test requires that all variables be entered together. This research verified validity of the structural model (n=217), by conducting the exploratory factor analysis. A factor extraction method was based on principal components analysis and Varimax rotation. [11] Table 3 showed that all seven factors were extracted. Each factor showed that an Eigen value was above 1 and the rate of cumulative variance showed total variance of 81.42%. There was no single factor that accounted for majority of the covariance. This
research also found that multi-collinearity did not exist.
Latent constructs was used with multiple measurement items to explain the determinants of intention to use virtual reality services. For estimating such model, both measurement and
structural components are simultaneously
considered. [12] Generally speaking, the
covariance-based structural equation model assume multivariate normal distributions. However, lots of studies related to human belief, attitude, and behavior have repeatedly revealed that their measures might be skewed and might not meet the multivariate normality assumptions required by the covariance-based structural equation modeling. As a result, one incorrectly identified structural path or one construct having weak measures might affect all other estimates throughout the covariance-based structural equation model. [10]
7439 estimation and it is not highly demanding on sample size and residual distribution. These reasons make the technique avoid, inadmissible solutions and factor indeterminacy. Therefore, it is appropriate for researchers to use PLS path modeling when they try to estimate a larger
complex model dealing with beliefs, attitudes and behaviors. [10]
Table 3: Results of Exploratory Factor Analysis
Factors Items F1 F2 F3 F4 F5 F6 F7
Personal Innovativeness
(P-I)
V1 .833
V2 .830
V3 .856
V4 .778
Effort Expectancy
(E-E)
V5 .764
V6 .759
V7 .845
V8 .636
Social Influence (S-I)
V9 .837
V10 .793
V11 .760
V12 .774
Performance Expectancy
(P-E)
V13 .859
V14 .873
V15 .882
Hedonic Motivation
(H-M)
V16 .886
V17 .814
V18 .897
V19 .976
Facilitating Conditions
(F-C)
V20 .752
V21 .815
V22 .829
Intention To Use
(I-U)
V23 .620
V24 .613
V25 .755
Eigen Value 9.785 2.894 2.361 1.506 1.447 1.249 1.109
Explained Variance (%) 39.141 11.577 9.443 6.024 5.789 4.996 4.454
[image:5.612.86.529.157.649.2]KMO (%) 81.42
Table 4: Results of Reliability Analysis
Variables No. of Items Cronbach α Standardized Cronbach α
Performance Expectancy 3 .931 .932
Effort Expectancy 4 .929 .930
Social Influence 4 .929 .930
Personal Innovativeness 4 .931 .931
Hedonic Motivation 4 .928 .929
Facilitating Conditions 3 .930 .931
Intention to Use 3 .927 .928
In order to check that the measures used for the various constructs are reliable, reliability was calculated between multi-item scales on 25 measurement variables. In Table 4, the reliability scores are highly satisfactory. Standardized Cronbach’s α values for each construct were also
7440
3.3 T-test and Multiple Regression Analysis
As shown in Table 5, the result of T-test illustrated that significant differences between non-experiencers and non-experiencers at the level of α=.05 did not exist. It also showed that males were more likely to be personally innovative than females, and those in the metro area were more likely to use virtual reality services than those in the regional area.
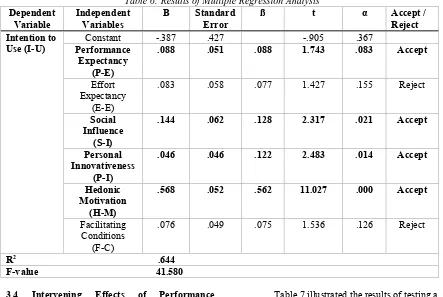
[image:6.612.90.524.521.721.2]This research used multiple regression analysis by setting Intention to Use (I-U) as a dependent variable and the other six variables (P-E, E-E, S-I, P-I, H-M and F-C) as independent variables. The results of multiple regression analysis showed that four of the six suggested hypotheses turned out to be significant, as shown in Table 6.
H-1 was accepted because I-U was significantly determined by P-E at the level of α=. 10 (ß=.088, α=.083). Generally, performance expectancy means perceived usefulness. Other studies indicated that performance expectancy had a positive impact on intention to use virtual reality services. [3, 4, 5, 6, 11, 15, 16, 17, 18, 19] This research indicated that the higher was the performance expectancy, the higher was intention to use virtual reality services.
H-2 was rejected because E-E did not influence on I-U significantly (ß=.077, α=.155). Effort expectancy means perceived ease of use for predicting extreme of adoption of new technologies. This result did not support the prior studies. [3, 4, 5, 6, 11, 15, ,16, 17, 18, 19, 20]
H-3 was accepted because S-I did have a significant impact on I-U at the level of α=. 05
(ß=.128, α=.021). Social influence may occur when an individual’s opinions, feelings or actions are affected by other people. Social influence is defined as perceived pressures from most people to make or not to make a certain behavioral decision. This result supported the prior studies. [3, 4, 5, 6, 8, 11, 19] This research showed that the higher was social influence, the higher was intention to use virtual reality services.
H-4 was accepted because P-I had a significant impact on I-U at the level of α=. 05 (ß=.122, α=.014). Previous studies indicated that personal innovativeness was a significant predictor influencing the adoption of IT devices. Innovative individuals are more prone to try out ant new IT devices and are viewed as “communicative, curious, dynamic, venturesome, and simulation-seeking”. [15, 19] This result supported the prior studies. [11, 19, 21] This research showed that higher was personal innovativeness, the higher was virtual reality services.
H-5 was accepted because H-M had a significant impact on I-U at the level of α=. 00 (ß=.562, α=.000). Hedonic motivation means perceived enjoyment. This result supported the previous studies. [3, 11, 21, 22] This research indicated that the higher was hedonic motivation, the higher was virtual reality services.
H-6 was rejected because F-C did not influence on I-U significantly (ß=.075, α=.126). Facilitating conditions are individuals’ beliefs existed or supported on organizational and technical infra-structure. This result did not support the prior studies. [3, 4, 5, 6, 11, 18, 22]
Table 5: Results of T-test between Experiencers and Non-experiencers
Levine’s Equal Variance T-test on Identity of Means
F α t α (two-tail)
Performance
Expectancy .051 .822 1.948 .057
Effort Expectancy
.078 .741 1.647 .081
Social Influence
.002 .967 1.166 .149
Personal
Innovativeness .059 .801. 1.853 .072
Hedonic
Motivation .046 .875 .889 .201
Facilitating Conditions
.089 .766 1.525 .134
Intention To Use
7441
Table 6: Results of Multiple Regression Analysis Dependent
Variable Independent Variables B Standard Error ß t α Accept / Reject
Intention to
Use (I-U) Performance Constant -.387 .427 -.905 .367
Expectancy (P-E)
.088 .051 .088 1.743 .083 Accept
Effort Expectancy
(E-E)
.083 .058 .077 1.427 .155 Reject
Social Influence
(S-I)
.144 .062 .128 2.317 .021 Accept
Personal Innovativeness
(P-I)
.046 .046 .122 2.483 .014 Accept
Hedonic Motivation
(H-M)
.568 .052 .562 11.027 .000 Accept
Facilitating Conditions
(F-C)
.076 .049 .075 1.536 .126 Reject
R2 .644
F-value 41.580
3.4 Intervening Effects of Performance Expectancy
To test intervening effects of
performance expectancy proposed by 7, 8, H-9, and H-10, this research followed Chin et al.’s Partial Least Squares Product-Indicator approach. [12] It created the intervening variables by cross-multiplying the items of E-E and P-E, SI and P-E, P-I and P-E, H-M and P-E. When the predictor had four measures and the intervener had one indicator, four measures represented the construct of intervening effects.
As shown in Table 7, all intervening effects were significant: interaction between E-E and P-E (ß=1.126, p<.000), interaction between S-I and P-E (ß=.728, p<.000), interaction between P-I and P-E (ß=2.770, p<.05), and interaction between H-M and P-E (ß=1.272, p<.000). Based on these results, hypothesis H-7, H-8, H-9, and H-10 were supported. Consequently, we could conclude that a consumer’s performance expectancy intervened the impacts of E-E, S-I, P-I, and H-M on intention to use virtual reality services, which implies that the higher were the impacts of E-E, S-I, P-I, and H-M on intention to use virtual reality services the higher was a customer’s performance expectancy.
Table 7 illustrated the results of testing a performance expectancy factor as an intervener on the relations between each independent variable and the dependent variable by Product-Indicator approach. [13]
7442
Table 7: Results of Intervening Effects
Variables B Standard
Error ß t α Accept / /Reject
E-E→P-E →I-U
1.213 .227 1.126 5.343 .000*** Accept
S-I→P-E
→I-U .822 .134 .728 6.137 .000
*** Accept
P-I→P-E
→I-U 2.585 1.141 2.770 2.266 .024
* Accept
H-M→P-E
→I-U 1.286 .194 1.272 6.631 .000
*** Accept
*p <.05, **p<.01, ***p<.001
Figure2: Results of the Structural Equation Model
4. SYSTEM STRATEGIES AND
CONCLUSION
This research developed and evaluated a model of the relation between six factors and use of virtual reality service systems. This research empirically analyzed factors that affected intention to use virtual reality service systems and intervening effects of the performance expectancy factor, for which it utilized exploratory factor analysis, T-test, multiple regression analysis, and Chin et al.’s Partial Least Squares Product-Indicator approach etc.
The research put forward ten
hypotheses in respect of virtual reality services. Figure 2 showed the results of the covariance-based structural equation modelling approach assuming multivariate normal distribution.
H-1 was accepted, which means that intention to use virtual reality services is positively affected by helping you improve your finance management and save your time through the virtual reality services.
H-2 was rejected, which means that ease of using virtual reality services and ease of learning how to use them have nothing to do with intention to use them.
7443 intention to use virtual reality services is positively affected by recognition of family, influential people, and important people who believe that I should use virtual reality services.
H-4 was accepted, which means that the higher the personal innovativeness of new technology is, the higher the intention to use virtual reality services is.
H-5 was accepted, which means that the higher is the hedonic motivation that the
consumers enjoy when using virtual reality services, the higher is the intention to use virtual reality services.
H-6 was rejected, which means that consumer perceptions of the support and the resources for using virtual reality services do not influence intention to use virtual reality services.
H-7, H-8, H-9, and H-10 were accepted, which means that the effects of E-E, S-I,
P-I, and H-M on intention to
use virtual reality services are high at higher levels
of a customer’s performance expectancy
respectively.
The result obtained from this research illustrates some important implications for the management of virtual reality systems. In particular, a deep understanding of performance expectancy in virtual reality services and its effects can be very useful to determine the strategies and actions leading the virtual reality users to become real purchasers. Moreover, virtual reality merchants should make various strategies based on the target consumer’s age. The third-party recognition should play an important role in using virtual reality services.
Implications of the two factors of hedonic motivation and performance expectancy can be headed for the management and system design strategies of virtual reality service providers, which imply that consumers should experience the services with enjoyment and get benefits by utilizing them. Thus, the virtual reality service systems have to be elaborated in the pleasant and beneficial way. That is, system design strategies should appeal to consumers by positioning the using experience as an adventure or a way to reduce their stress and change a negative mood.
In addition, the positive effects of social influences on intention to use virtual reality services imply that one of the system design strategies for virtual reality services should be reputation-building, in order to gain a favorable opinion from referents, whether they are existing users or not. By the social influences these persons can actively recommend others to use the services. Another system design strategy should target the early adopters. Early adopters may not be your first choice, but when targeted correctly, they can build buzz within exclusive inner circles and eventually entice mainstream customers to give your virtual reality product a try.
This research has some limitations. Data collection followed convenience sampling and
snowballing sampling. In this study, for the sample population students were selected living in the Seoul metropolitan and in the regional city. Geographical distribution was not tracked and the results may only represent that of a particular area. Therefore, a different group such as students living in large cities and small towns may yield different results. In the future, research may be extended by selecting samples from wider areas including both large cities and small towns. Another limitation is that social classes of samples based on their income and occupation were not considered. Different classes might have different behaviors toward use of virtual reality service systems. By comparing different results from different classes, we might have a more significant result on use of virtual reality service systems. In summary, the model developed through this study has practical implications as it helps to identify motivating factors and barriers of virtual reality service use and also more complex interactions between the factors, in order to enable virtual reality designers and other stakeholders to perform better design of virtual reality systems and to attract customers.
ACKNOWLEDGEMENTS
This work was supported by Hankuk University of Foreign Studies Research Fund of 2018
REFERENCES:
[1] Minh-Tu Nguyen, Hai-Khanh Nugyen, Khanh-Day Vo-Lam, Xuan-Geing Nugyen, and MinhTtriet Tran, “Appling Virtual Reality in
City Planning”, Lecture Notes in Computer
Science, Vol. 9740, 2016, pp. 724-735.
[2] Ahmed Almusawi, L. Canan Dülger, Sadettin Kapucu, “Robotic Arm Dynamic and Simulation with Virtual Reality Model”,
International Conference on CoDIT, 2016, pp.
335-340.
7444
New Information Technology?”, Decision
Sciences, Vol. 30. No. 2, 1999, pp. 361-391.
[4] M. Ibraheem Ahmad, “Unified Theory of Acceptance and Use of Technology (UTAUT):
A Decade of Validation and Development”, In
Proceedings of Fourth International
Conference on ICT, December 20-22, 2014,
pp. 1-13.
[5] V. Venkatesh, M. Morris, G Davis, and F. Davis, “User Acceptance of Information Technology: Toward a Unified View”,
Management Information Science Quarterly,
Vol. 27, No. 3, 2003, pp. 425-478.
[6] Michael D. Williams, Nripendra P. Rana, Yogesh K. Dwivedi, “The Unified Theory of Acceptance and Use of Technology (UTAUT):
A Literature Review”, Journal of Enterprise
Information Management, Vol. 28, Issue 3,
2015, pp. 443-488.
http://doi.org/10.1108/JEIM-09-2014-0088. [7] Maira Lescevica, Eglis ginters, and Riccardo
Mazza, “Unified Theory of Acceptance and Use of Technology (UTAUT) for Market analysis of FP7 CHOReOS Products”,
Procedia Computer Science, Vol. 26, 2013, pp.
51.68.
[8] Karoly Bozan, Kevin Parker, and Bill Davey, “A Closer Look at the Social Influence Constructs in the UTAUT Model: An Institutional Theory Based Approach to Investigate Health IT Adoption Patterns of the Elderly”, 2016 49th Hawaii International Conference on System Sciences, 2016, pp. 3105-3114.
[9] J. Drennan, G. S. Mort, and J. Previte, “Privacy, Risk Perception, and Expert Online Behavior: An Exploratory Study of Household End
Users”, Journal of Organizational and End
User Computing, Vol. 18, 2006, pp. 1–22.
[10] Hyun Shik Yoon and Luis G. Occena, “Influencing Factors of Trust in Consumer-to-Consumer Electronic Commerce with Gender
and Age”, International Journal of Information
Management, Vol. 35, 2015, pp. 352-363.
[11] Young-Ho Hwang and Yoo-Jin Moon, “Analysis of Factors Influencing Intention to Use the Online-Only Bank and Interaction
Effects Among the Factors”, Advanced Science
Letters, Vol. 22, No. 9, 2016, pp. 2588-2591.
[12] J. Hair, W. Black, B. Babin, R. Anderson, and
R. Tatham, Multivariate Data Analysis (6th
ed.), 2006, Saddle River, NJ: Pearson Prentice
Hall.
[13] W. W. Chin, R. A. Peterson, and S. P. Brown, “Structural Equation Modeling in Marketing:
Some Practical Reminders”, The Journal of
Marketing Theory and Practice, Vol. 16, No.
4, 2008, pp. 287-298.
[14] J. C. Nunnally and I. H. Bernstein,
Psychometric Theory, 1994, New York:
McGraw-Hill.
[15] Gaurav Kabra, A. Ramesh, Pervaiz Akhtar, and Manoj Kumar Dash, “Understanding Behavioral Intention to Use Information Technology: Insights from Humanitarian
Practitioners”, Telematics and Informatics,
Vol. 34, No. 7, 2017, pp. 1250-1261.
[16] Williard Van De Bogart and Saovapa Wichadee, “Exploring Students’ Intention to Use LINE for Academic Purposes Based on
Technology Acceptance Model”, International
Review of Research in Open Distributed
Learning, Vol. 16, No. 3, 2015, pp. 65-85.
[17] Timothy Teo and Mingming Zhou, “Explaining the Intention to Use Technology among University Students: A Structural
Equation Modeling Approach”, Journal of
Computing in Higher Education, Vol. 26,
2014, pp. 124-142.
[18] Harun Cigdem and Mustafa Ozturk, “Factors Affecting Students’ Behavioral Intention to Use LMS at a Turkish Post-Secondary
Vocational School”, International Review of
Research in Open and Distributed Learning,
Vol. 17, No. 3, 2016.
http://www.irrodl.org/index.php/irrodl/article/v iew/2253.
[19] H. S. Yoon and Linsey M. B Steege, “Development of a Quantitative Model of the Impact of Customers’ Personality and Perceptions on Internet Banking Use”,
Computers in Human Behavior, Vol. 29, 2013,
pp. 1133-1141.
[20] C. Kim, M. Mirusmonov, and I. Lee, “An Empirical Examination of Factors Influencing the Intention to Use Mobile Payment”,
Computers in Human Behavior, Vol 26. No. 3,
2010, pp. 310-322.
[21] S. Parameswaran, R. Kishore, and P. Li, “Within-Study Measurement Invariance of the UTAUT Instrument: An Assessment with User
Technology Engagement Variables”,
Information and Management, Vol. 52, No. 3,
2015, pp. 317-336.
[22] T. Escobar-Rodriguez and E. Carvajal-Trujillo, “Online Purchasing Tickets for Low Cost Carriers: An Application of the Unified Theory of Acceptance and Use of Technology
(UTAUT) Model”, Tourism Management, Vol.
7445
[23] R. B. Kline, Principles and Practice of
Structural Equation Modeling (4th ed.), 2015,
New York: Guilford Publications.
[24] Joseph F. Hair, Jr., G. Tomas M. Hult,
Christian M. Ringle, and Marko Sarstedt, A
Primer on Partial Least Squares Structural
Equation Modeling (PLS-SEM), 2017, Los
![Table 6. seeking”. [15, 19] This result supported the prior](https://thumb-us.123doks.com/thumbv2/123dok_us/8901384.955008/6.612.90.524.521.721/table-seeking-result-supported-prior.webp)