Image Super Resolution on the Basis of DWT and
Bicubic Interpolation
Gaurav Kumar
ME Student (ECE) Thapar University, Patiala
Kulbir Singh
Associate Professor (ECED) Thapar University, Patiala
ABSTRACT
This paper describes a super-resolution technique based on interpolation of the high-frequency subband images obtained by discrete wavelet transform (DWT) and the input image. This technique uses DWT to decompose an image into different subband images. Then the high-frequency subband images and the low-resolution input image have been interpolated, followed by combining all these images to generate a new super-resolved image by using inverse discrete wavelet transform (IDWT). This super resolution technique has been tested on various images. The peak signal-to-noise ratio (PSNR) and visual results show the superiority of this technique over the conventional and state-of-art image resolution enhancement techniques.
Keywords
Discrete wavelet transform, super- resolution.
1.
INTRODUCTION
Resolution of an image has been always an important issue in many video and image processing applications, such as video resolution enhancement, feature extraction, and satellite image resolution enhancement. Images are being processed in order to obtain more enhanced resolution. One of the commonly used techniques for image resolution enhancement is interpolation. Interpolation has been widely used in many image processing application such as facial reconstruction [1], multiple description coding and post processing of decoding [2].
Image resolution enhancement in the wavelet domain is relatively new research topic, and recently many new algorithms have been proposed. Discrete wavelet transform (DWT) is one of the recent wavelet transform used in image processing. DWT decomposes an image into different subband images, namely low-low (LL), low- high (LH), high-low (HL), and high-high (HH) [3]. Carey and others have estimated the unknown details of wavelet coefficients in an effort to improve the sharpness of the reconstructed images [4]. Their estimation was carried out by investigating the evolution of wavelet transform among the same type of subbands. Edges identified by an edge detection algorithm in lower frequency subbands were used to prepare a model for estimating edges in higher-frequency subbands, and only the coefficients with significant values were estimated as the evolution of the wavelet coefficients. These significant coefficients correspond to salient
image discontinuities, and consequently, only the portrayal of those can be targeted with this approach.
The main goal of this algorithm is to do image enhancement using wavelet based interpolation. Super resolution technique uses discrete wavelet transform (DWT) to decompose a low resolution image into different subband images. Then the high frequency subband images are interpolated using bicubic interpolation. In parallel, the input image is also interpolated separately. Finally, the interpolated high-frequency subband images and interpolated input image are combined by using inverse discrete wavelet transform (IDWT) to achieve a high-resolution output image. This technique has been compared with conventional and state-of-art image resolution enhancement techniques. The conventional techniques used are:-
• Interpolation techniques namely, nearest neighbor, bilinear,
and bicubic interpolation.
• Wavelet zero padding (WZP).
The state-of-art techniques used for comparison purposes are:-
• Regularity-preserving image interpolation [4].
• New edge-directed interpolation (NEDI) [6].
• HMT-based image super resolution (HMT SR) [7].
• WZP and cycle-spinning (CS) [8].
• WZP, CS, and edge rectification (ER) [9]
According to the results, the super resolution technique outperforms the aforementioned state-of-art and conventional techniques for image resolution enhancement.
This paper is organized as follows: Section 2 describes the functionality of discrete wavelet transform. Section 3 of the paper contains various linear interpolation techniques. The main part of this paper is section 4 which describes the Super resolution enhancement technique. Section 5 presents the results obtained, section 6 concludes and references are given in section 7.
2.
DISCRETE WAVELET TRANSFORM
provides the information about high frequency details at different levels of decomposition.
In the literature [11], the equations of discrete wavelet transform and its inverse transform are given as follow:
[image:2.595.37.282.460.595.2]
where, is an input image, is the approximation coefficient and are its detailed coefficients. The functionality of DWT [7] is that the columns of the original image are passed through a high-pass and low-pass filter. Then the rows of the filtered image are low-passed through the high-pass and low-pass filter.
Fig 1: Block Diagram of 1 level Discrete Wavelet Transform (DWT) [7]
After the wavelet decomposition has been completed, the image will be divided into four sub images which are the approximate (LL), horizontal (LH), vertical (HL) and diagonal (HH) as shown in Fig 1.
In order to obtain the approximate coefficients (LL), the rows and columns are passed through the low-pass filter which resembles the original image, but at a smaller resolution. The horizontal coefficients (LH) are obtained by passing the rows through the low-pass filter and the columns through the high-pass filter which will emphasize the horizontal edges. The vertical coefficients (HL) obtained by passing the columns through the low-pass filter and the rows through the high-pass filter that will stress the vertical edges. Lastly, when both the columns and rows are passed through the high-pass filter, this will produce the diagonal coefficients (HH) which accents the diagonal edges.
3. INTERPOLATION TECHNIQUES
Interpolation is estimation of the value of the discrete function at unknown positions based on the given and known surrounding samples. The goal of image interpolation is to produce acceptable images at different resolutions from a single low-resolution image [10]. The actual resolution of an image is defined as the number of pixels, but the effective resolution is a much harder quantity to define as it depends on subjective human judgment and perception. Image interpolation is used for several different purposes such as image resolution enhancement, multi-resolution pyramidal compressing, and position computing for rotated image pixels etc. In the past years, many linear and nonlinear image interpolation techniques have been proposed. In the linear methods, the nearest-neighbor, bilinear, and bicubic interpolation methods are widely used to increase resolution of images.
Some image interpolation examples [5] are chosen to demonstrate the three interpolation method in Fig 2. The main problem of the nearest-neighbor interpolation is jaggedness while the main problem associated with bilinear interpolation is image blurring. Bicubic interpolation adds proper high frequency information to the image and reduces blurring effects at the same time.
4.
SUPER RESOLUTION
ENHANCEMENT TECHNIQUE
(a) (b) (c) (d)
Fig 2: Three most commonly used interpolation methods (a) Original image, (b) nearest neighbor interpolated image, (c) Bilinear interpolated image, (d) Bicubic interpolated image [5]
In the wavelet domain, the LL subband image is the low-resolution of the original image. Therefore, instead of using LL, which contains less information, low resolution input image is used for interpolation. Hence, using low resolution input image instead of the LL subband image increases the quality of the super-resolved image [11]. Note that input image is interpolated with half of the interpolation factor α, used to interpolate the high frequency subbands, as illustrated in Fig 3. By interpolating input image by α/2, and interpolating LH, HL, and HH by α, and then applying inverse discrete wavelet transform (IDWT), the output image will contain sharper edges than the interpolated image obtained by interpolation of the input image directly. This is because the interpolation of isolated high-frequency components in HH, HL, and LH will preserve more high-frequency components after the interpolation of the respective subbands separately than interpolating image directly.
In summary, the super resolution technique interpolates the input image as well as the high-frequency subband images obtained through the DWT process. The final high-resolution output image is generated by using the IDWT of the interpolated subband images and the input image [12]. The interpolation technique and the wavelet function are two important factors in determining the quality of the
super-resolved images. The visual and PSNR results in the proceeding section show that the super resolution technique out performs conventional and state-of-art techniques.
PSNR values (dB) are used to measure the quality of an image. Peak signal-to-noise ratio (PSNR) has been implemented in order to obtain some quantitative results for comparison. PSNR can be obtained by using the following formula:
where, R is the maximum fluctuation in the input image (255 in here as the images are represented by 8 bit, i.e., 8- bit grayscale representation have been used).
Fig 3: Block diagram of Super resolution Technique [12]
5.
RESULTS
(a) (b) (c) (d) (e)
Fig 4: (a) and (b) original low resolution image, (c) bicubic interpolated image, (d) super resolved image, and (e) high resolution image
Fig 4 shows that the Lena image in (d) is much better than the low-resolution image in (b) and the interpolated image in (c) whereas (e) is the high resolution image.
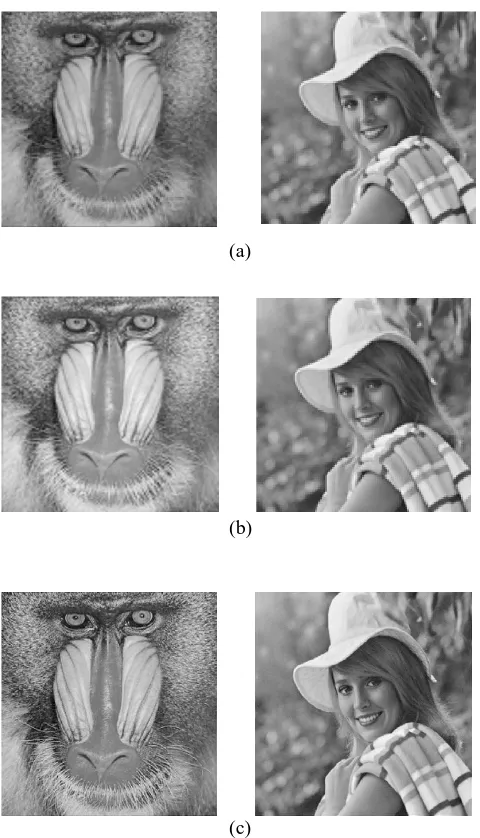
In order to show the effectiveness of this technique over the conventional and state-of-art image resolution enhancement techniques, three well-known test images (Lena, Baboon, and Peppers) with different features are used for comparison. Fig 5 shows the strength of the method by including Baboon for texture and Elaine for edges. Table 1 compares the PSNR (dB) performance of super resolved technique with
[image:4.595.43.557.428.571.2](a)
(b)
(c)
Fig 5: (a) Original images, (b) bicubic interpolated images, and (c) super resolved images
6.
CONCLUSION
[image:5.595.60.300.79.498.2]This paper describes a new super-resolution technique based on the interpolation of the high-frequency subband images obtained by DWT and the input image. This technique uses DWT to decompose an image into different subband images. The high-frequency subband images are interpolated. An original image is interpolated with half of the interpolation factor used for interpolating the high-frequency subband images. Afterwards all these images are combined using IDWT to generate a super-resolved image. The super resolution technique has been tested on well-known benchmark images, where their PSNR and visual results show the superiority of this technique over conventional and state-of-art image resolution enhancement techniques.
Table 1. PSNR results for resolution enhancement from 128 × 128 to 512 × 512 of the super resolution technique compared with the conventional and state-of-art image
resolution enhancement techniques
7. REFERENCES
[1] Yi-bo, L., Hong, X. and Sen-yue, Z. “The Wrinkle Generation Method for Facial Reconstruction Based on Extraction of Partition Wrinkle Line Features and Fractal Interpolation,” 4thInt. Conf. Image Graphics, Aug. 22-24, 2007, pp. 933-937.
[2] Rener, Y., Wei, J. and Ken, C. “Down sample-Based Multiple Description Coding and Post-Processing of Decoding,” 27th Chinese Control Conf., 2008, pp. 253-256.
[3] Piao, Y., Shin, L., and Park, H.W. “Image Resolution Enhancement Using Inter-Subband Correlation in Wavelet Domain,” Int. Conf. Image Process., vol. 1, 2007, pp.I–445-448.
[4] Carey, W.K., Chuang, D.B., and Hemami, S.S. “Regularity- Preserving Image Interpolation,” IEEE Trans. Image Proc., vol. 8, no. 9, Sept. 1999, pp. 1293-1297.
[5] Parker, J., Kenyon, R., and Troxel, D. “Comparison of interpolating methods for image resampling,” IEEE Trans. Med. Imaging 2(1), pp. 31–39, 1983.
[6] Li, X. and Orchard, T. “New Edge-Directed Interpolation” IEEE Trans. Image Process., vol. 10, no.
Technique PSNR(dB)
Lena Baboon Elaine
Bilinear 26.34 20.51 25.38
Bicubic 26.86 20.61 28.93
WZP(db.9/7) 28.84 21.47 30.44
Carey and others [4]
28.81 21.47 30.42
NEDI [6] 28.81 21.18 29.97
HMT SR[7] 28.88 21.49 30.51
WZP-CS [8] 29.27 21.54 30.78
WZP-CS-ER[9]
29.36 21.56 30.89
Super Resolution
technique
[image:5.595.335.548.124.453.2][7] Zhao, S., Han, H. and Peng, S. “Wavelet Domain HMT-Based Image Super Resolution,” IEEE Int. Conf. Image Process, vol. 2, Sept. 2003, pp. 933-936.
[8] Temizel, A. and Vlachos, T. “Wavelet Domain Image Resolution Enhancement Using Cycle-Spinning,” Electron. Letter, vol. 41, no. 3, Feb. 2005, pp.119-121. [9] Temizel, A. and Vlachos, T. “Image Resolution Up
scaling in the Wavelet Domain Using Directional Cycle Spinning,” J. Electron. Imaging, vol. 14, no. 4, 2005.
[10] Thvenaz, P., Blu, T. and Unser, M. "Image Interpolation and Re sampling," Handbook of Medical Imaging, Processing and Analysis, I.N. Bankman, Ed., Academic Press, San Diego CA, USA, pp. 393-420, 2000.
[11]Lin, C. and Liu (2010), A Tutorial of the Wavelet Transform.
[12]Anbarjafari, G. and Demirel, H. “Image super resolution based on interpolation of wavelet domain high frequency subbands and the spatial domain input image,” ETRI J., vol. 32, no. 3, pp. 390–394, Jun. 2010.
[13] Gonzalez, R.C and Woods, R.E. "Digital image processing", 3rd edition, Pearson Prentice Hall, 2008.
[14]Mallat, S. A Wavelet Tour of Signal Processing, 2nd ed., Academic Press, 1999.
![Fig 1: Block Diagram of 1 level Discrete Wavelet Transform (DWT) [7]](https://thumb-us.123doks.com/thumbv2/123dok_us/8085123.783391/2.595.37.282.460.595/fig-block-diagram-level-discrete-wavelet-transform-dwt.webp)
![Fig 2: Three most commonly used interpolation methods (a) Original image, (b) nearest neighbor interpolated image, (c) Bilinear interpolated image, (d) Bicubic interpolated image [5]](https://thumb-us.123doks.com/thumbv2/123dok_us/8085123.783391/3.595.58.560.232.409/commonly-interpolation-original-neighbor-interpolated-bilinear-interpolated-interpolated.webp)
![Fig 3: Block diagram of Super resolution Technique [12]](https://thumb-us.123doks.com/thumbv2/123dok_us/8085123.783391/4.595.113.470.68.374/fig-block-diagram-super-resolution-technique.webp)