ABSTRACT
Data mining is the process of extracting hidden patterns from data. With the explosion of data, data mining is essential to extract useful information. Association rule mining is a method for finding correlation among large set of data items. A rule is characterized as sensitive if its disclosure risk is above a certain confidence value. Sensitive rules should not be disclosed to the public, as they can be used to infer sensitive data and provide an advantage for the business competitors. Techniques for hiding association rules are almost limited to binary items. But, real world data mostly consists of quantitative values. In this paper, a method to hide fuzzy association rule is proposed, in which, the fuzzified data is mined using modified apriori algorithm in order to extract rules and identify sensitive rules. The sensitive rules are hidden by decreasing the support value of Right Hand Side(RHS) of the rule. Genetic algorithm is used to ensure security of the database and keep the utility and certainty of the mined rules at highest level. Experimental results of the proposed approach demonstrate efficient information hiding with less side effects.
Keywords
Association Rules, Data Mining, Fuzzy Logic, Sensitive Rules, membership Function
1.
INTRODUCTION
Data mining is the process of extracting useful patterns or knowledge from large databases. Association rule analysis is a popular tool for discovering useful associations from large amount of data. However, data mining also poses a threat to privacy and information protection if not used properly. Once private data is released, it will be impossible to prevent misuse [1]. Sensitive hidden information could be easily exposed using this kind of tool. Information privacy is essential to prevent private data from being available to others. This prevents misuse of information. Therefore, the protection of sensitive hidden information has become a critical issue to be resolved.
Privacy preserving data mining that involves getting valid data mining results without learning the underlying data values has been receiving attention in the research community. Consider the case of a health drink reseller who purchase health drink at low price from two companies, A and B. Reseller also grants them access to his customer database. B supplier may misuse the database to mine association rules related to A, inferring facts like “People who buy Milk also buy the product A”. Using this information, B supplier offers a discount coupon on milk with each purchase of B. Hence, sales on A drops rapidly and A
supplier cannot offer it at low price as before. This enables product B monopolize the health drink market which results in the hike of health drink prices. As a result, reseller may start losing business to his competitors. This scenario emphasis need for research on sensitive knowledge hiding in database. Techniques of hiding sensitive association rules can be classified into two broad categories [2]. -- Distortion based technique and Blocking based technique. In distortion based technique, the data is distorted such that the support and confidence of sensitive association rules is reduced below threshold. Here threshold refers to minimum value of support and confidence below which the association rule becomes uninteresting. This technique has side effects of ‘Lost Rules’ and ‘Ghost Rules’. Lost Rules refers to undesirable hiding of items and association rules that are not sensitive. Ghost rules are non genuine association rules which become part of association rules set. Distortion based technique reduces these side effects while maintaining a linear time complexity with dataset size. This technique also pose a serious bottleneck in some specific situations like medical database where deleting a part of dataset may infer to a wrong prescription.
Blocking based technique is characterized by introducing uncertainty without distorting the database. It also suffers from side effects of lost item, lost rule and ghost rule.
Initially, rule hiding techniques were proposed by Vassilios et al. [3]. They are distortion based algorithms and are evaluated based on their efficiency and side effects. Side effects of these algorithms were high. Chih-Chia proposed novel algorithms - Frequent Hiding Sensitive Frequent Item & Frequent Hiding Sensitive Association Rule[4][5]. Both were based on support and confidence framework. Each transaction in dataset was assigned a weight based on its support for a sensitive rule. All of the transactions in dataset were sorted by weight in descending order. Transactions were modified till the confidence of sensitive association rules fall below given threshold. Among antecedent and consequent, random selection was made for pruning.
S. L. Wang et. al.[6] introduced two strategies for hiding sensitive association rules. The first strategy, called ISL(Increasing the Support of LHS(Left Hand Side)), decreases the confidence of a rule by increasing the support of the itemset in its LHS. The second approach, called DSR(Decreasing the Support of RHS(Right Hand Side)), reduces the confidence of the rule by decreasing the support of the itemset in its RHS. Both algorithms rely on the distortion of a portion of the database transactions to lower the confidence of the association rule. The algorithms required a reduced number of database scans and exhibit an efficient pruning strategy. Moreover, the DSR algorithm seems to be more effective when the sensitive items have high support.
A New Method for Preserving Privacy in Quantitative
Association Rules using Genetic Algorithm
K. SathiyaPriya, G. Sudha Sadasivam,
PhD.V.B. Karthikeyan,
Assistant Professor, Professor, Student,Dept. of CSE, Dept. of CSE, Dept. of CSE, PSG College of Technology, PSG College of Technology, PSG College of Technology,
Yuhong et al. presented FP-tree based method for inverse frequent set mining [7]. In this algorithm after extraction and pruning of frequent itemset, FP-tree is constructed, which is later converted into many versions of modified database. The strength of this technique is that it is more efficient and more than one modified database can be released. Number of released databases was characterized by the number of non frequent items chosen. Limitation of this technique is that it focused on hiding sensitive items only and also has side effect of large number of lost rules.
Duraiswamy et.al [8] described an algorithm called Sensitive Rule Hiding. In this algorithm sensitive rules with single antecedent and consequent were clustered. Each rule is modified to reduce its confidence. When all sensitive association rules are hidden, clusters are converted into a modified database. This technique shows high side effects both in terms of ghost rules as well as loss of non sensitive rules.
Dehkordi et.al[9] proposed a novel method for privacy preserving association rule mining based on genetic algorithms. The objective of this paper is to prevent sensitive rules from being revealed. It also makes sure that no normal rules are falsely hidden (lost rules) and no extra fake rules (ghost rules) are mistakenly mined after the rule hiding process using genetic algorithm.
As cited above, most of the studies proposed concentrated on hiding association rules associated with binary items without giving importance to its quantity. However, many transactions in real world applications have quantitative values. For example, for a diabetes patient the quantity of the attribute sugar in blood is more important than the presence or absence of sugar. The basic idea in quantitative data mining is to map the categorical attribute values into corresponding binary attribute values. Some work has been done to discover fuzzy association rules from quantitative data using fuzzy set concepts. But, only limited research papers are available in the field of hiding fuzzy association rule in quantitative data. Hiding quantitative rule can be done by increasing the support of LHS of the rule which in turn decreases the confidence of the rule[10].
Fuzzification of support and confidence framework with variable numbers of fuzzy membership function and decreasing the support can also be used for quantitative association rule hiding[11]. In this technique, two strategies were employed to be used to decrease the confidence of an association rule . First strategy increases the count of support (A) without affecting the count of support (AUB). Second strategy incorporates count of support(A) as unchanged while decreasing the count of support(AUB)
However both the works require the member ship function to be predefined and are usually built by human experts. In absence of expertise, the membership functions cannot be accurately defined which reduces system performance[12][16]
This paper presents a method for preventing extraction of useful association rules from quantitative data by decreasing the support of the rule. The support of a rule A→B is decreased by decreasing the support count of itemset AB which is achieved by decreasing the support value of B on R.H.S. of the rule. This is done until either support or confidence value of the rule goes below minimum support or minimum confidence value respectively. This problem of sanitization was proved to be NP-Hard[13]. A source dataset is modified such that the released dataset maximizes the number of non-sensitive interesting rules. This involves a specific optimization problem as it is necessary
to modify the dataset in such a way that the utility of modified dataset should be maintained in order to extract useful information and rules. Therefore genetic algorithm approach is used to solve this optimization problem.
The rest of this paper is organized as follows. Fuzzy association rule mining in quantitative data and genetic algorithm is described in Section II. Proposed GA based solution for privacy preservation is given in section III. The method to hide useful fuzzy association rules is described in Section IV. Experimental results are given in Section V. Section VI includes the conclusion.
2.
PROBLEM
STATEMENT
An association rule is defined as an implication X→Y, where both X and Y are defined as sets of attributes (interchangeably called items) . Here X is called as the body (LHS) of the rule and Y is called as the head (RHS) of the rule. It is interpreted as follows: “for a specified fraction of the existing transactions, a particular value of an attribute set X determines the value of attribute set Y as another particular value under a certain confidence”. For instance, an association rule in a supermarket basket data may be stated as, “In 20% of the transactions, 75% of the people buying butter also buy milk in the same transaction”; 20% and 75% represent the support and the confidence, respectively. The significance of an association rule is measured by its support and confidence. Simply, Support is the percentage of transactions that contain both X and Y, while confidence is the ratio of the support of X UY to the support of X.
Let I={i1, i2, i3} be the complete item set where each i j(1≤j ≤m)is a quantitative attribute. Given a database D={t1, t2,…., tn} where each tj is a transaction with attributes I and the fuzzy sets associated with attributes in I, our goal is to find out some interesting useful association rules.
Let X ={x1, x2,…,xp} and Y = {y1, y2,….., yq} be two large itemsets. Then, the fuzzy association rule is given as follows:
A→B
where A={ f1, f2,…fp} and B ={g1, g2,….. gq} and fi {the fuzzy regions related to attribute xi} g j {the fuzzy regions related to attribute yj}
X and Y are subsets of I and are disjoint. A and B contain the fuzzy sets associated with the corresponding attributes in X and Y[11].
In a classical set or crisp set, the objects in a set are called elements or members of the set. An element x belonging to a set A is defined as x A. A characteristic function or membership function A(x) is defined as an element in the universe U having a crisp value of 1 or 0. For every x U,
The membership functions for crisp set can take a value of 1or 0, the membership functions for fuzzy sets can take values in the interval [0,1]. The range between 0 and 1 is referred to as the membership grade or degree of membership [14]. A fuzzy set A is defined below:
Where A(x) is a membership function belonging to the interval [0,1]. So, the problem can be stated as, “Mining fuzzy association rules and
A.
for
0
A,
for
1
x
x
x
A
,
|
,
0
,
1
x
x
x
A
x
hiding the sensitive association rule by decreasing the support of item on right hand side of the rule using genetic algorithm until confidence goes below minimum confidence”.
A genetic algorithm uses genetics as its model of problem solving. It is a search technique to find approximate solutions to optimization and search problems.
The basic genetic algorithm is as follows:
1. [start] Generate random population of n chromosomes (An individual is a single solution while the population is the set of individuals currently involved in the search process.)
2. [Fitness] Evaluate the fitness f(x) of each chromosome x in the population.
3. [New population] Create a new population by repeating following steps until the New population is complete.
a. [Selection] Select two parent chromosomes from a population according to their fitness (the better fitness, the bigger chance to get selected).
b. [Crossover] With a crossover probability, cross over the parents to form new offspring (children).If no crossover was performed, offspring is the exact copy of parents. c. [Mutation] With a mutation probability,
mutate new offspring at each locus (position in chromosome).
d. [Accepting] Place new offspring in the new population.
4. [Replace] Use new generated population for a further sum of the algorithm.
5. [Test] If the end condition is satisfied, stop, and return the best solution in current population.
6. [Loop] Go to step(2) for fitness evaluation
Cross over is the process by which the genetic material in two or more parents is combined to obtain one or more offspring. In fitness evaluation step, the individual’s quality is assessed. Mutation is performed to one individual to produce a new version of it where some of the original genetic material has been randomly changed. Selection process helps to decide which individuals are to be used for crossover and mutation helps to produce new search points.
3.
PROPOSED
GA
SOLUTION
FOR
PRIVACY PRESERVATION
In a quantitative database, if a critical rule X→Y needs to be hidden, its confidence value is decreased to a value smaller than the minimum confidence value. One way of decreasing confidence value is decreasing the support value of an item Y at RHS, and the other way is increasing the support value of item X at LHS.
Our approach decreases confidence value of a rule, by decreasing the support value of the item. If the difference between the value of item in RHS and LHS is greater than 0.5 and RHS value is greater than LHS value then the RHS value is replaced with a value obtained by subtracting this difference from 0.5. Similarly, if LHS value is greater than RHS value then the LHS value is replaced with a value obtained by subtracting this difference from 0.5
Parameters used in the proposed algorithm are given as follows:
D : Initial database with n transaction data C : Cleaned database with n transaction data F : Fuzzified database
Mutation used : Bit-flipping
Cross-over used : Single-point cross-over
Convergence-criteria : maximum number of generations Rh : Set of rules to hide
Xij : ith gene of jth chromosome a: Attribute Region
NA – No. of attribute regions
NS – No. of attribute regions in the interesting & sensitive rules
Input:
(1) Source database D,
(2) Minimum support value (min_support), (3) Minimum confidence value (min_confidence).
Output:
A transformed database D’ so that useful fuzzy association rules cannot be mined.
Algorithm :
1. Cleaning of database, D→C
2. Fuzzification of the cleaned database, C → F; 3. Calculation of every item’s support
value where f F, in fuzzified database F. 4. IF all f (support) < min_support THEN EXIT; // there isn’t any rule
6. Find large 2-itemsets from F;
7. FOR EACH X’s large 2-itemset //find all rules
Find R = {Rules from itemset X}; //for X= {i1, i2}, rules are i1 → i2, i2 → i1.
Compute confidence of the rule U;
IF confidence (U) > min_confidence and sensitive THEN Add the rule U to Rh;
end//if
end//end of FOR EACH //Hides all rules in Rh
8. Extract all items in the sensitive rules.
9. Encode the transaction with the extracted items into chromosomes
10. Evaluate the fitness of each chromosome using f(Ci) =
11. Repeat until for specified number of generations Choose parents using roulette wheel selection perform crossover
perform mutation
Selection: F(Ci) > minimum confidence Evaluate the f(Curr-gen.)
f(curr_gen.) = 0.5 * Differencefactor / 100 + 0.5 * Modification factor.
End Repeat.
12. Transform the modified values in generation with minimum fitness to fuzzified database F.
14. Transform the updated database F to D’ and output updated D’;
15. end
Details of this algorithm is presented in the following section.
4.
METHOD TO HIDE USEFUL FUZZY
ASSOCIATION RULES.
An illustration of the working of the proposed algorithm is as follows
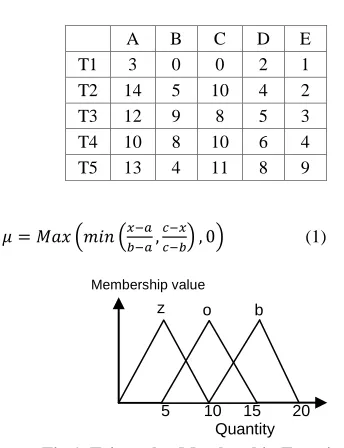
The database as in Table1 is cleaned by substituting the unknown values by zero, and eliminating the redundant records.
Table 1. Sample data with 5 attributes
STEP 2: Fuzzification
[image:4.612.376.517.239.379.2]The cleaned database as shown in table 2 is fuzzified using triangular membership function given in equation (1) into 3 regions Z, O, B as shown in fig 1. The fuzzified data is shown in table 3.
Table 2. Cleaned data
(1)
Fig 1. Triangular Membership Function used
Where a is the left end of the triangle, b is the peak of the triangle and c is the right end of the triangle (values are the corresponding x axis values)
[image:4.612.63.235.279.503.2]STEP 3: Calculate the support count of each attribute region, R on the transactions data by summing up the fuzzy values of all the transactions in the fuzzified transaction data as in table 3.
Table 3. Fuzzification of transaction data
STEP 4: Check whether count of each attribute is greater than or equal to the predefined minimum support value. If an attribute satisfies the above condition, put it in the set of large-2 itemsets (L2). Consider the minimum support is set to 2.2 and minimum confidence to 70%. The regions Ao, Bz, Co, Dz and Ez are have their support value greater than minimum support, so are considered in forming the rules and finding the corresponding confidence value. The rules can be Ao→Bz, Ao→Co, Ao→Dz, Ao→Ez, Bz→Ao, Co→Ao, Dz→Ao, Ez→Ao, Ez→Bz, Ez→Co, Ez→Dz, Bz→Ez, Co→Ez, Dz→Ez, Bz →Co, Co →Dz, Bz →Dz, Co →Bz, Dz→ Co, Dz→ Bz. Consider the rule Bz →Co, the support of the rule is calculated as shown in table 4.
Table 4. Fuzzy values of Bz and Co
STEP 5: For each 2 large itemsets, based on user specified minimum confidence value, rules are extracted. Confidence value of A→B rule is computed as follows:
The confidence value is calculated for the rule Bz→Co
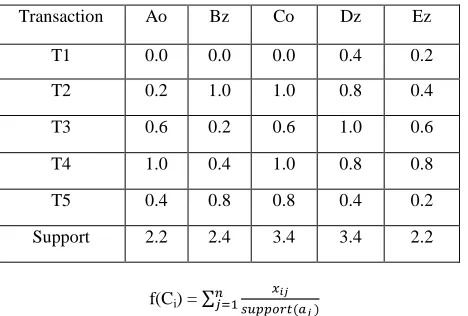
STEP 6: Mark the sensitive rules. Extract the items occurring in the sensitive rules into a new table. In the example, if Ao→Bz, Ao→Ez, Bz →Dz, Bz →Co, Co →Dz, Dz→Ao, Ez→Bz are marked as sensitive then the items occurring in the sensitive rules are extracted as shown in table 5. Each row in the table 5 is encoded as a chromosome and the initial population is generated.
A B C D E
T1 3 ? ? 2 1
T2 14 5 10 4 2
T3 12 9 8 5 3
T4 10 8 10 6 4
T5 13 4 11 8 9
A B C D E
T1 3 0 0 2 1
T2 14 5 10 4 2
T3 12 9 8 5 3
T4 10 8 10 6 4
T5 13 4 11 8 9
cc A B C D E
n Az Ao Ab Bz Bo Bb Cz Co Cb Dz Do Db Ez Eo Eb
T1 0.6 0.0 0.0 0.0 0.0 0.0 0.0 0.0 0.0 0.4 0.0 0.0 0.2 0.0 0.0
T2 0.0 0.2 0.8 1.0 0.0 0.0 0.0 1.0 0.0 0.8 0.0 0.0 0.4 0.0 0.0
T3 0.0 0.6 0.4 0.2 0.8 0.0 0.4 0.6 0.0 1.0 0.0 0.0 0.6 0.0 0.0
T4 0.0 1.0 0.0 0.4 0.6 0.0 0.0 1.0 0.0 0.8 0.2 0.0 0.8 0.0 0.0
T5 0.0 0.4 0.6 0.8 0.0 0.0 0.0 0.8 0.2 0.4 0.6 0.0 0.2 0.8 0.0
Count 0.6 2.2 1.8 2.4 1.4 0.0 0.4 3.4 0.2 3.4 0.8 0.0 2.2 0.8 0.0 Bz Co Support
T1 0.0 0.0 0.0
T2 1.0 1.0 1.0
T3 0.2 0.6 0.2
T4 0.4 1.0 0.4
T5 0.8 0.8 0.8
Count 2.4 2.4
5 10 15 20 Quantity
Membership value
[image:4.612.83.531.609.731.2]STEP 7: Evaluate the fitness of the chromosome as follows. Let x be the fuzzy value in a chromosome and n be the number of attribute-regions and let aj represent each attribute-region. The fitness of a chromosome is evaluated as per the following equation
Table 5. Items in the critical rule
Transaction Ao Bz Co Dz Ez
T1 0.0 0.0 0.0 0.4 0.2
T2 0.2 1.0 1.0 0.8 0.4
T3 0.6 0.2 0.6 1.0 0.6
T4 1.0 0.4 1.0 0.8 0.8
T5 0.4 0.8 0.8 0.4 0.2
Support 2.2 2.4 3.4 3.4 2.2
f(Ci) =
STEP 8 :Selection : Roulette Wheel Selection
Parents are selected according to their fitness. The better the chromosomes are, the more chances for them to get selected. This can be simulated by following algorithm.
8.1 [Sum] Calculate sum of all chromosome fitnesses in population - sum S.
8.2 [Select] Generate random number from interval (0,S) - r. 8.3 [Loop] Go through the population and sum fitnesses from 0 - sum s. When the sum s is greater then r, stop and return the chromosome where you are.
Step 8.1 is performed only once for each population. STEP 9: Apply cross over
repeat for all chromosomes choosen using step 8,
for two regions ri and rj
if value(ri) - value(rj) > 0.5 swap(value(ri),value(rj)) if(value(ri) > value(rj))
value(ri) = (value(ri) - value(rj)) - 0.5 if(value(ri) < value(rj))
value(rj) = (value(rj) - value(ri)) - 0.5 Update the support values
Endif
[image:5.612.63.267.579.624.2]Consider the regions Bz and Ez in transaction T2 as in table 6.
Table 6. Fuzzy values of Bz and Ez in transaction T2.
Here, Value(Bz) – Value(Ez) = 1.0 – 0.4 = 0.6 > 0.5, so swap both the values and the attribute with higher value is replaced with difference - 0.5. ie, Ez = (1.0-0.4) - 0.5 = 0.6 -0.5 = 0.1. The fitness of the child is evaluated. If it is greater than the parent then it is mutated depending on mutation probability and the new individual replaces the parent.
STEP 10: Mutation is performed on the new individual. If the mutation probability is 20% of the population size a random
number is generated. if it is less than 0..2 then the new individual is mutated as follows
repeat until mutation count is reached if support > min_support
if any fuzzy value is 1.0 change it to 0.0
In Table 5 region Dz has the support 3.4 which is greater than the threshold. And T3 has the value 1.0 in Dz, by mutation it is flipped to 0.0 as shown in Table 7. The updated table is as follows.
Table 7. Dz after applying mutation
Table 8 shows the transactions after applying crossover and mutation.
Table 8. Modified transaction values after mutation and crossover
STEP 10: The fitness of the chromosomes is evaluated and fitness of the generation is evaluated as follows
For a rule A → B, let old_conf denote the confidence of the rule in the population before genetic operators are applied and new_conf denote the confidence of the rule in the population after genetic operators are applied and diff = old_conf - new_conf and n be the total no of interesting rules
Difference factor =
Modification factor = No. of modified attribute-regions / Total no of attribute regions
A weight factor of 0.5 is assigned for each of the above factors. f(gi) = 0.5 * Difference factor/100 + 0.5 * Modification factor Difference factor = (9.09+0+6.8+0+12.18+(-2.71)+9.09)/7 =34.45/7 = 4.92
Modification factor = 3/15 = 0.2
Fitness = 4.92/100 + 0.2 =0.049 +0.2 = 0.25 Transaction Ao Bz Co Dz Ez
T2 0.2 1.0 1.0 0.8 0.4
Transaction Ao Bz Co Dz Ez
T1 0.0 0.0 0.0 0.4 0.2
T2 0.2 0.4 1.0 0.8 0.1
T3 0.6 0.2 0.6 0.0 0.6
T4 1.0 0.4 1.0 0.8 0.8
T5 0.4 0.8 0.8 0.4 0.2
Support 2.2 1.8 3.4 2.4 1.9
Transaction Ao Bz Co Dz Ez
T1 0.0 0.0 0.0 0.4 0.2
T2 0.2 0.4 1.0 0.8 0.1
T3 0.6 0.2 0.6 0.0 0.6
T4 1.0 0.4 1.0 0.8 0.8
T5 0.4 0.8 0.8 0.4 0.2
The above steps are repeated until the specified number of generations is reached.
The modified values of the generation with least fitness ie, generation with minimum modification to data values is used to replace the original fuzzified values in the fuzzification table as shown in table 10.
Table 9. Difference table
Defuzzification using centroid method is done on the modified values to get back quantitative values using the equation (2). The updated table D' is shown in Table 11
(2) X is the quantitative value n is the number of regions xi is the center point of that triangle
[image:6.612.334.528.113.295.2]µ(xi) corresponding membership value in that triangle
Table 11. Defuzzified Table
5.
EXPERIMENTAL RESULTS
Experimental results were taken using Wisconsin Breast Cancer dataset from UCI Machine Learning Repository [17]. The dataset consists of one id attribute, nine quantitative attributes and one categorical attribute. This algorithm was implemented using the nine quantitative attributes. Eight rules were randomly selected for hiding.
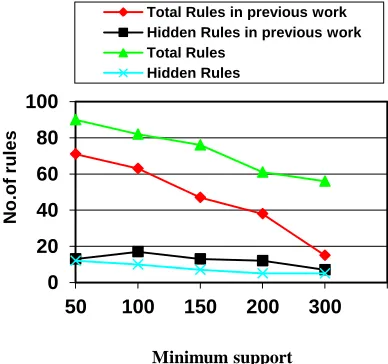
Different experiments were performed to compare the performance of the proposed algorithm with previous work[16]. Population size was fixed to the number of transactions in the dataset. The number generations was fixed to 60. Mutation rate
[image:6.612.101.233.369.473.2]is set as 0.2 and Cross over rate is set as 0.6. Figure 2 shows the
Table 10. Defuzzified Table
number of generated rules and hidden rules for varying confidence of 50, 60, 70, 80, 90 and the corresponding support of 50, 100, 150, 200, 300.
Fig 2. Number of rules under different minimum confidence
The second experiment shows relation between the number of rules and the interesting rules for varying number of transactions from abalone(dataset1) and breast cancer dataset(dataset2) of UCI repository as shown in figure 3. The abalone dataset contains seven continuous, one integer and one categorical attributes. Only the numerical attributes were the numerical attributes were considered for rule mining. The number of instances is 4177. Minimum support for abalone dataset was set as 30 and the minimum confidence as 60. Minimum support for breast cancer dataset was set as 2.3 and the minimum confidence as 70.
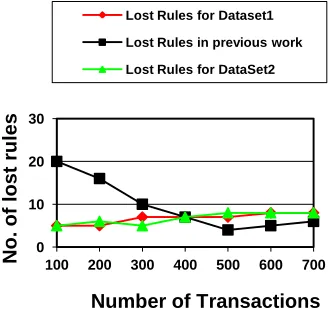
The third experiment shows the number of new rules or ghost rules generated as a side effect of hiding process for different number of transactions. The results are depicted in Figure 4. The fourth experiment shows the number of lost rules for different number of transactions as shown in figure 5. The new rules generated and the number of rules lost when trying to hide eight rules were almost same for all datasets.
Figure 6 shows the lost rules and ghost rules when the number of transactions were increased. Table 12 gives the number of entries modified out of the total number of entries for a given number of transactions.
No. Rule Old_conf(%) New_conf(%) diff
1 Ao->Bz 54.54 45.45 9.09
2 Ao->Ez 81.81 81.81 0
3 Bz->Dz 74.99 68.18 6.81
4 Bz->Co 100.0 100.0 0
5 Co->Dz 76.47 64.28 12.18
6 Dz->Ao 58.82 61.53 -2.71
7 Ez->Bz 54.54 45.45 9.09
A B C D E
T1 3 0 0 2 1
T2 14 0 10 4 2
T3 12 9 8 5 3
T4 10 8 10 6 4
T5 13 4 11 8 9
Transaction A B C D E
n Az Ao Ab Bz Bo Bb Cz Co Cb Dz Do Db Ez Eo Eb
T1 0.0 0.1 0.0 0.0 0.0 0.0 0.0 0.0 0.0 0.4 0.0 0.0 0.2 0.0 0.0
T2 0.0 0.2 0.8 0.0 0.0 0.0 0.0 1.0 0.0 0.8 0.0 0.0 0.4 0.0 0.0
T3 0.0 0.6 0.4 0.2 0.8 0.0 0.4 0.0 0.0 0.2 0.0 0.0 0.6 0.0 0.0
T4 0.0 1.0 0.0 0.4 0.6 0.0 0.0 0.4 0.0 0.8 0.2 0.0 0.8 0.0 0.0 0
20 40 60 80 100
50 100 150 200 300
No.o
f
rule
s
Minimum support
Total Rules in previous work Hidden Rules in previous work Total Rules
[image:6.612.55.521.630.761.2]Fig 3. Number of rules Generated for two datasets
Fig 4. Number of new rules generated when hiding a set of eight rules.
Fig 5. Number of rules lost when hiding a set of eight rules.
[image:7.612.61.286.78.276.2]
Fig 6. Number of lost rules and ghost rules
Table 12. Number of entries modified for total number of entries
No. of
Transactions
Dataset1 Dataset2
Total entries
Modified entries
Total entries
Modified entries
100 800 47 900 116
200 1600 112 1800 216
300 2400 145 2700 351
400 3200 234 3600 456
500 4000 234 4500 527
600 4800 290 5400 579
700 5600 320 6300 657
From figure 4, 5 and 6, it can be seen that this algorithm generate less side effects and modify only a small number of entries in comparison to previous work. The reason is that our algorithm makes minimum modification of data because of the criterion used for selection of chromosome for crossover. The generation which hides the rule with minimum modification to data, that is, the generation with least fitness is defuzzified . Therefore, higher data quality of the released database is maintained by our algorithm than the previous work.
6.
CONCLUSION
In this paper, a Genetic algorithm based method for preventing extraction of sensitive association rules from quantitative data is proposed. The sensitive rules were hided by decreasing the support of the RHS of the rule. Unlike previous approaches which mainly deals with association rules in binary database, the proposed approach deals with hiding the association rules in quantitative database. Genetic Algorithm maximizes the number of non sensitive rules that can be mined from the released dataset by minimizing the number of modifications to the data. that is, it reduces 45- 65% of lost rules and 18 - 12% of ghost rules when compared with previous work. Experimental results demonstrate that the proposed approach is more efficient as it hides more rules for different values of support and confidence with minimum rules lost and no ghost rules generated. Also, this approach makes minimum modification of data. we were working on finding the criteria to choose the best chromosome for crossover in order to reduce the number of generation. It is
0 50 100 150 200 250 300
100 200 300 400 500 600 700
N
u
m
b
e
r
o
f r
u
le
s
Number of transactions Total Rules in dataset1 Sensitive Rules in dataset1 Total Rules in dataset2 Sensitive Rules in dataset2
0 10 20 30
100 200 300 400 500 600 700
No
.
o
f lost
r
u
les
Number of Transactions
Lost Rules for Dataset1 Lost Rules in previous work Lost Rules for DataSet2
0 10 20 30
100 200 300 400 500 600 700
N
o.
of
new
rul
e
s
gene
ra
te
d
Number of transactions
New Rules in previous work New Rules in Dataset1 New Rules in Dataset2
0 5 10 15 20
1000 2000 3000 4177
N
o.
of
rul
e
s
Number of Transactions
[image:7.612.375.517.88.198.2] [image:7.612.69.239.315.475.2] [image:7.612.85.249.515.672.2]also required to reduce the side effects when choosing the generation with minimum modification.
7. REFERENCES
[1] Chris Clifton and Murat Kantarcioglu and Jaideep Vaidya, "Defining Privacy for Data Mining," in Proceedings of the National Science Foundation Workshop on Next Generation Data Mining, November 1-3, 2002, Baltimore, MD.
[2] Yucel Saygin, Vassilios Verykios, and Chris Clifton, "Using Unknowns to Prevent Discovery of Association Rules", SIGMOD Record 30 (2001), no. 4, 45–54
[3] Vassilios S. Verykios, A.K. Elmagarmid, E. Bertino, Y. Saygin, and E. Dasseni, “Association Rule Hiding,” IEEE Transactions on Knowledge and Data Engineering, vol. 16, no. 4, pp. 434-447, 2004.
[4] Chih-Chia Weng, et et., “A Novel Algorithm for Completely Hiding Sensitive Frequent Itemset” , Dept. of Information Science, Chung Cheng Institute of Technology, National Defense University , 2007
[5] Chih-Chia Weng, Shan-Tai Chen, Hung-Che Lo , “A Novel Algorithm for Completely Hiding Sensitive Association Rules” , Eighth International Conference on Intelligent Systems Design and Applications, 2008
[6] S.L. Wang, and A. Jafari, “Using unknowns for hiding sensitive predictive association rules,” In Proceedings of the 2005 IEEE International Conference on Information Reuse and Integration (IRI 2005), pp.223–228, 2005
[7] Yuhong Guo, 2007, “Reconstruction-Based Association Rule Hiding”, Proceedings of SIGMOD2007 Ph.D. Workshop on Innovative Database Research 2007(IDAR2007), 51-56
[8] Dr. Duraiswamy. K, Dr. Manjula. D, and Maheswari. N “A New Approach to Sensitive Rule Hiding”, ccsenet journal, vol 1, No. 3, August, 107-111
[9] Mohammad Naderi Dehkordi, Kambiz Badie, Ahmad Khadem Zadeh, "A Novel Method for Privacy Preserving in Association Rule Mining Based on Genetic Algorithms", Journal of software, vol. 4, no. 6, August 2009
[10] T. Berberoglu and M. Kaya, “Hiding Fuzzy Association Rules in Quantitative Data”,The 3rd InternationalConference on Grid and Pervasive Computing Workshops, May 2008, pp. 387-392.
[11] Manoj Gupta and R. C. Joshi, “Privacy Preserving Fuzzy Association Rules in in Quantitative Data”, International Journal of Computer Theory and Engineering, Vol. 1, No. 4, October, 2009, 382-388
[12] T. P. Hong, C. Y. Lee, ”Induction of fuzzy rules and membership functions from training examples”, Fuzzy Sets and Systems - FSS , vol. 84, no. 1, pp. 33-47, 1996
[13] M. Atallah, E. Bertino, A. Elmagarmid, M. Ibrahim and V. Verykios. "Disclosure limitation of sensitive rules." Proc. of IEEE Knowledge and Data Engineering Exchange Workshop (KDEX), November 1999.
[14] Cano, J. and P. Nava, "A Fuzzy Method for Automatic Generation Of Membership Function Using Fuzzy Relations from Training Examples", Proceedings of the 21st NAFIPS International Conference, pp. 158-162, June 2002.
[15] Chirag Modi. N, Udai Pratap Rao and Dhiren Patel. R, “An Efficient Solution for Privacy Preserving Association Rule Mining”, International Journal of Computer and Network Security, Vol. 2, No. 5, May 2010, 79-85
[16] K. Sathiyapriya, G. Sudhasadasiavm, N. Celin, "A New Method for preserving privacy in Quantitative Association Rules Using DSR Approach With Automated Generation of Membership Function", In the Proceedings of World Congress on Information and Communication Technologies, Mumbai 2011, pp.148-153. Dec. 2011
[17] D.E. Goldberg, Genetic Algorithms: in Search, Optimization, and Machine Learning. New York :Addison-Wesley Publishing Co. Inc. 1989.
[18] L.A. Zadeh, “Fuzzy Sets”, Information and Control, Vol.8, pp.338-353, 1965.
![Bis[4 (dimethylamino)pyridinium] pentabromidochloridostannate(IV)](data:image/gif;base64,R0lGODlhAQABAIAAAP///wAAACH5BAEAAAAALAAAAAABAAEAAAICRAEAOw==)